Abstract
Time-of-flight methods allow quantitative measurement of shear wave speed (SWS) from ultra-sonically tracked displacements following impulsive, acoustic radiation force excitation in tissue. In heterogeneous materials, reflections at boundaries can distort the wave shape and confound determination of the wave arrival time. The magnitude of these effects depends on the shear wavelength of the excitation, the kernel size used to calculate the SWS, and the method used to determine the wave arrival time. In this study, we perform a parametric analysis of these factors using finite element modeling of the tissue response, and simulated ultrasonic tracking. Two geometries are used, a stiff, vertical layer, and a stiff spherical inclusion, each in a uniform background. Wave arrival times are estimated using the peak displacement, peak slope of the leading edge, and cross correlation methods. Results are evaluated in terms of reconstruction accuracy, resolution, contrast, and contrast-to-noise ratio of reconstructed SWS images. Superior results are obtained using narrower excitation widths and arrival time estimators which identify the leading edge of the propagating wave. The optimal kernel size is determined by a tradeoff between improved accuracy for larger kernels at the expense of spatial resolution.
I. Introduction
Physicians use manual palpation to diagnose disease since pathologic tissues are often stiffer than adjacent healthy tissue. This increase in tissue stiffness is typically associated with the replacement of healthy tissue by fibrotic tissue, as occurs in disease processes such as liver cirrhosis, or an increase in tissue cellular density in malignant masses, as is believed to occur with certain focal cancers. Manual palpation, however, has limitations associated with physician access to organs and deep tissues, and there can be large subjective variability from one clinician to another when describing the “stiffness” or “softness” of a mass or organ.
Ultrasonic elasticity imaging is one tool that clinicians are starting to utilize to help diagnose and monitor disease based on the stiffness contrast between healthy and diseased tissue. Shear Wave Elasticity Imaging (SWEI) is a non-invasive, ultrasonic method that utilizes acoustic radiation force to generate shear waves that propagate in soft tissues [1]. Several research groups have developed techniques to use propagating shear waves following acoustic radiation force excitations to reconstruct soft tissue material properties including Shearwave Dispersion Ultrasound Vibrometry (SDUV) [2], [3], Super Sonic Imaging (SSI) [4], [5], Spatially-Modulated Ultrasonic Radiation Force (SMURF) [6], and Acoustic Radiation Force Impulse (ARFI) shear wave imaging [7], [8].
Many of the above-mentioned imaging modalities rely on time-of-flight (TOF) based reconstruction algorithms to estimate the speed of propagating shear waves that are generated from impulsive acoustic radiation force excitations. These TOF methods utilize assumptions about tissue homogeneity in the region of interest (ROI) to provide spatial domains over which the reconstruction kernels can be expanded to generate robust speed estimates. However, when quantitative shear stiffness images of structures in tissue are sought, these homogeneity assumptions can be violated and artifacts can be created in the resulting shear stiffness images.
This manuscript explores the impact of shear wave speed (SWS) reconstruction kernel size, arrival time estimation methodology, and shear wave excitation beamwidth on the accuracy, spatial resolution, and contrast of shear stiffness images using validated simulation tools. Section II reviews acoustic radiation force and shear wave mechanics as applied in these studies. Section III details the finite element method (FEM) simulations used in these studies and the SWS reconstruction algorithms that were investigated, with results from these simulations presented in Section IV. The results are discussed in Section V in the context of artifacts that can be present in SWS images of heterogeneous media and methods for optimizing the accuracy, spatial resolution, and contrast in TOF SWS images.
II. Background
The acoustic radiation force F⃗ generated in soft tissues by focused ultrasound can be described by [9], [10]
| (1) |
where α is the ultrasonic attenuation coefficient of the tissue, c is the tissue’s sound speed, and I⃗ is the acoustic intensity at a given point in space. The acoustic radiation force is generated by a transfer of momentum from the propagating acoustic wave to the propagation medium through attenuation mechanisms such as absorption and scattering of the ultrasonic wave. Focusing the acoustic radiation force allows for shear waves to be generated directly in tissues of interest, and the shape and size of these shear waves is dictated by both the acoustic excitation parameters such as F-number and frequency, and the acoustic properties of the tissue such as the ultrasonic attenuation [11], [12].
In linear, isotropic, elastic solids, the speed cT of shear wave propagation is related to shear modulus µ and Young’s modulus E by
| (2) |
where ρ is the density and ν is Poisson’s ratio. Thus, by measuring the speed of shear wave propagation in tissue, one can infer a quantitative estimate of the tissue stiffness. For incompressible solids, Poisson’s ratio is 0.5 and E = 3µ. All three metrics (E, µ, cT) related to stiffness are commonly quoted in the literature and provided by commercial systems.
The estimation of SWS can be accomplished through a variety of methods. For magnetic resonance elastography, acquisition of a full, three dimensional set of displacement data u⃗ allows the direct inversion of the Helmholtz equation [13], [14], [15]
| (3) |
However, most ultrasonically-tracked displacement data are acquired in a single imaging plane, and additional assumptions are required to use the direct inversion of (3). In addition, the jitter present in ultrasonically-tracked displacement data results in noise and artifacts from calculating second-order spatial and temporal derivatives of the displacement field data using the Helmholtz inversion approach [4], [7].
These challenges have motivated the use of time-of-flight (TOF) SWS reconstruction algorithms that take advantage of a priori information regarding shear wave propagation direction to estimate wave speed [3], [5], [8], [16]. Typically, TOF SWS estimation is performed by estimating the wave arrival time at lateral positions offset from the excitation, and performing linear regression of time vs. position data within a kernel to determine the speed. Methods used to determine the arrival time include the time to peak (TTP) displacement algorithm [8], determination of the arrival phase of a CW, amplitude modulated wave [3], and cross-correlation techniques [16], [5]. Beyond ”simple” linear regression, several methods have been described to improve TOF SWS estimation including outlier removal using the RANSAC algorithm [17], evaluation of linear trajectories [18], and level set methods to utilize continuity of the wave front with depth [19], [5]. In this paper, we consider factors which influence the reconstruction accuracy and resolution in TOF SWS estimation with particular attention to the effects of kernel size, shear wavelength, and the method of arrival time determination.
III. Methods
A. FE Models
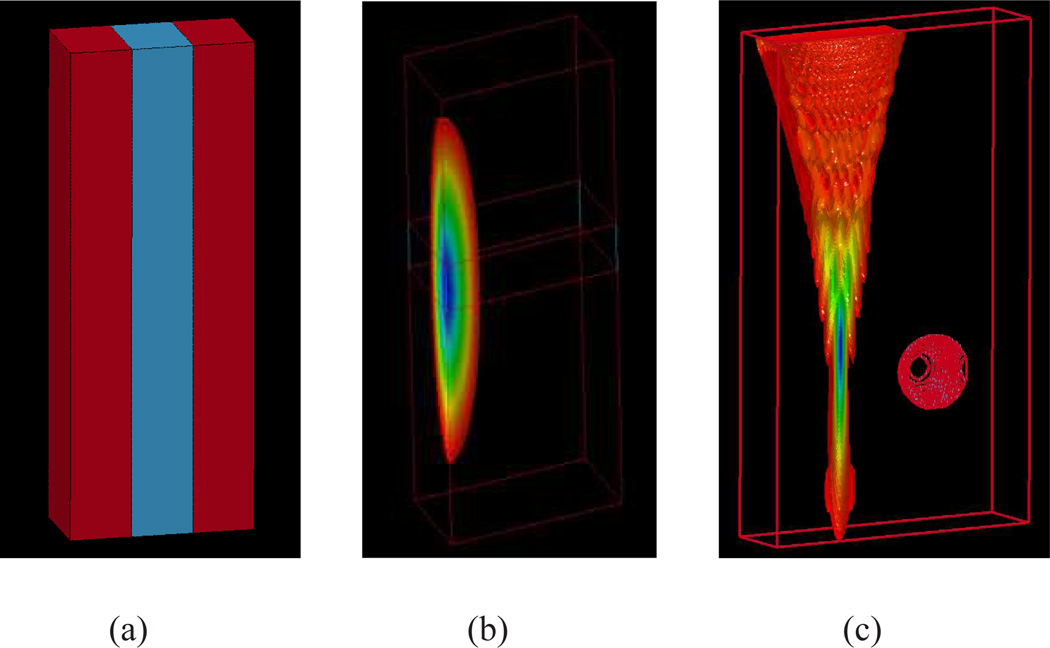
Previously validated finite element (FE) models [12] were used to simulate the dynamic response of tissue following impulsive acoustic radiation force excitations. Two configurations of materials were used. The first configuration consisted of a stiff, vertical layer with Young’s modulus E = 20 kPa in a background with E = 5 kPa, see Fig. 1(a). The layer ranged in thickness from 2 to 10 mm and was positioned so the first boundary was 10 mm from the excitation axis. The second configuration consisted of a spherical inclusion with E = 20 kPa in a background with E = 5 kPa. The sphere had a diameter of 10 mm and was positioned with its center at a depth of 49 mm and at a distance of 15 mm from the excitation axis, see Fig. 1(c).
Fig. 1.
Illustration of the material and excitation configurations used in this investigation. (a) A stiff vertical layer (E = 20 kPa) with a thickness of 2–10 mm in a soft (E = 5 kPa) background. (b) An example Gaussian excitation used to image the layered models. (c) An example of the experimental excitation configuration described in Table I, that was used in the simulation of a stiff (E = 20 kPa) 10 mm diameter spherical lesion in a soft (E = 5 kPa) background.
Materials were modeled as linear, elastic, isotropic solids with a Poisson ratio ν = 0.499 and density ρ = 1 g/cm3 so that the SWS given by (2). No mechanism of shear wave attenuation was included in the model [12]. The FE mesh used elements with a dimension of 0.25 × 0.25 × 0.25 mm3. For the vertical layer configuration, quarter symmetry was used, and the mesh had elevation × lateral × axial dimensions of 15 × 30 × 80 mm3. For the spherical inclusion geometry, half symmetry with non-reflecting boundaries on the lateral and elevation faces of a 5 × 40 × 80 mm3 mesh were used to simulate a semi-infinite medium without reflection artifacts.
Two excitation configurations were used. For the layered model, a Gaussian excitation (see Fig. 1(b)) with adjustable width was used to investigate the effect of shear wavelength on SWS reconstruction. These excitations used an axial force distribution given by
| (4) |
where A(t) is the time dependent force amplitude, x, y, and z are the lateral, elevational, and axial coordinates, σx, σy, and σz are the −6 dB beamwidths in each dimension, and z0 is the coordinate at the axial center of the excitation. Axisymmetric excitations with 0.5 mm ≤ σx = σy ≤ 5 mm and σz = 20 mm were used to model shear wavelengths in the range typically used for experimental radiation force excitations. The force amplitude A(t) was set to zero except for 0 < t < 200 µs where it was set to a constant value chosen empirically for each beamwidth to achieve a maximum, on-axis displacement of roughly 20 µm. These Gaussian excitations were used only for the vertical layer simulations, and provided an axisymmetric excitation with an easily adjusted width to quantify edge resolution. The second excitation configuration modeled our experimental setup [8] using a CH4-1 curvilinear array (Siemens Medical Solutions, Mountain View, CA) which was simulated using Field II [20] with the parameters listed in Table I, see Fig. 1(c). Lateral F-numbers F/2 and F/4 were used in the simulations that modeled our experimental setup to give −6 dB lateral excitation beamwidths of 1.4 mm and 2.8 mm, respectively.
TABLE I.
Excitation and Tracking Parameters for the CH4-1 Transducer Simulations.
| Parameter | Excitation | Tracking |
|---|---|---|
| Lateral Focus (mm) | 49 | 100 |
| Elevation Focus (mm) | 49 | 49 |
| Tx Freq. (MHz) | 2.2 | 3.1 |
| Tx F/# | 2, 4 | 3, 3 |
| Tx beamwidth (mm) | 1.4, 2.8 | 1.5, 1.5 |
| Excitation duration (µs) | 180 | NA |
| Rx F/# | NA | 0.5 |
| PRF (kHz) | NA | 10 |
The three-dimensional, dynamic response of the elastic solid was solved through the balance of linear momentum using LS-DYNA3D (Livermore Software Technology Corp., Livermore, CA) with an explicit, time-domain method [12]. Simulations were performed for a total time of 30 ms to allow shear wave propagation through a lateral range of 30 mm, and thus to extend at least 10 mm beyond the far edge of the layer or sphere. Calculations were performed on a Linux cluster with an average CPU speed of 2.6 GHz. In addition to LS-DYNA3D, calculations were performed using Field II [20] (see below), and Matlab (The MathWorks, Natick, MA).
B. Simulation of Ultrasonic Tracking
Ultrasonic displacement simulation was performed using the methods detailed in [21] for the models using the CH4-1 transducer configuration. Briefly, Field II [20] was used to simulate RF data acquired using the parameters listed under Tracking in Table I from ten, three-dimensional scatterer distributions that had been displaced using the time-dependent results of the FE models. RF data were simulated using dynamic receive focusing and receive aperture growth with a lateral line spacing of 0.2 mm, and were sampled at 100 MHz. Displacements between tracking lines were estimated using normalized cross correlation with a symmetric search region and 1.5 λ kernel, subject to a correlation coefficient threshold of 0.99. No electronic noise was added to the simulated displacement data since the primary source of jitter in focused radiation force-induced displacements is decorrelation of the speckle pattern in the tracking beam which arises in these data from shearing of the scatterers contained within the tracking point spread function [21], [22]. The jitter due to decorrelation is worst at the focal point of the radiation force excitation. For the ten scatterer realizations used here, the displacement-to-jitter ratio at the focal depth was 5.9 ± 0.2 dB which is consistent with our experimental data.
C. SWS Estimation
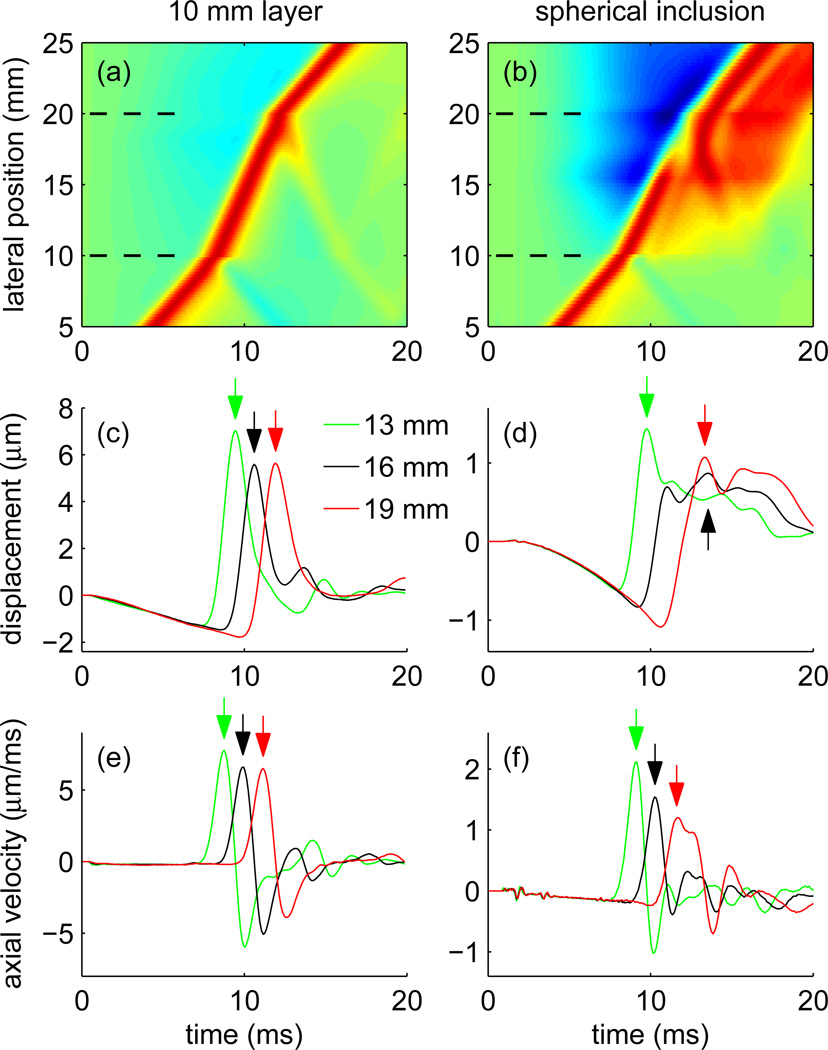
Displacement data from either pure FE models, or from simulated ultrasonic tracking of the FE modeled displacements, were tabulated in three dimensional data sets as a function of axial position, lateral position, and time. Figure 2 shows typical displacement data from an axial position located at the center of excitation for simulations performed using a σx = σy = 1 mm Gaussian excitation and 10 mm thick layer (left), and at an axial position equal to the focal depth for the CH4-1 excitation and spherical inclusion (right). Figures 2(a) and 2(b) show displacement data displayed as a two dimensional image in position and time. These images have been normalized by dividing the displacement vs. time profile at each lateral position by its maximum value to help visualize the data across the entire lateral range. Figures 2(c) and 2(d) shows displacement vs. time profiles at the specific lateral positions of 13, 16, and 19 mm, and Figs. 2(e) and 2(f) show the axial velocity of the tissue calculated by differentiation of the displacement data with respect to time.
Fig. 2.
Simulated FEM displacement data resulting from excitations centered at a lateral position of 0 mm showing shear wave propagation across a 10 mm thick layer ((a),(c),(e)), and across the center of a 10 mm diameter spherical inclusion ((b),(d),(f)). For the 10 mm thick layer, a 1 mm wide Gaussian excitation was used and displacement data are shown at an depth equal to the axial center of the excitation. For the spherical inclusion, a simulated CH4-1 excitation was used and displacement data are shown at an axial position equal to the focal depth. Images (a) and (b) show displacement data for all lateral positions. These data have been normalized by dividing the displacement profile at each lateral position by its maximum displacement to help visualize the trajectory through the entire lateral range. The boundaries of the layer or sphere at 10 and 20 mm are indicated by dashed lines. Plots (c) and (d) show displacement vs. time profiles for specific lateral positions of 13 mm, 16 mm, and 19 mm. Plots (e) and (f) show axial velocities at the same lateral positions obtained by differentiation of the displacement profiles with respect to time. The arrows indicate the peak displacements ((c),(d)) and peak velocities ((e),(f)) corresponding to the wave arrival times determined using the TTP and TTPS methods.
TOF methods were used to estimate the SWS from displacement data by determining the wave arrival time at each lateral position and calculating the slope of the position vs. time data. For the case of inhomogeneous models in this study, the slope was calculated using data from positions within a lateral kernel that was stepped across the lateral range. Kernel sizes studied ranged from 0.5 to 6 mm. Before estimating the wave arrival time, displacement vs. time data were upsampled to a frequency of 100 kHz to increase the temporal resolution. In addition, tracked displacement data were smoothed using a low pass filter with a cutoff frequency of 1 kHz to reduce jitter.
Three methods were explored to determine the wave arrival time from displacement vs. time profiles. First, the time-to-peak (TTP) method [8] was used to estimate the wave arrival time as the time of peak displacement at each lateral position. These peak displacements and the corresponding times are indicated by the arrows for each of the three displacement profiles shown in Figs. 2(c) and 2(d). Second, the time-to-peak-slope (TTPS) method was used to estimate the arrival time by differentiating the displacement vs. time profiles and finding the time of the maximum slope at each lateral position. These peak slopes and their corresponding times are indicated by the arrows on the differentiated displacement data (i.e., the velocity profiles) shown in Figs. 2(e) and 2(f).
The third method used to estimate the wave arrival time used cross correlation of the wave shape [16] to determine the time lag at one lateral position relative to an adjacent lateral position. The correlation function cl(j) between a displacement profile fl(ti) at position l and an adjacent position l + 1 was calculated using the relation
| (5) |
where each sum includes the timesteps ti in the displacement vs. time profile. After determining the lag corresponding to the maximum correlation function, quadratic interpolation was used to refine the estimate of the time lag. This procedure was repeated for each pair of adjacent lateral positions l and l + 1, and the time lags were accumulated over lateral position to determine the wave arrival time at each position. In this study, the correlation function cl(j) was calculated using only displacement data near the leading edge of the wave by setting the displacement function fl(ti) to zero at timesteps greater than the time required for the wave to reach a fraction of its maximum displacement. (Since the location of the leading edge changed with position and time, different numbers of points were used in the evaluation of (5) at different positions.) Specifically, SWS estimates were performed using thresholds of 50% and 100% of the maximum displacement, and we refer to these methods to estimate the SWS as the Xcorr50 and Xcorr100 methods. Because the Xcorr50 and Xcorr100 methods only determine the difference in wave arrival times at adjacent lateral positions, these methods only determine relative arrival times, in contrast to the TTP and TTPS methods which give absolute values.
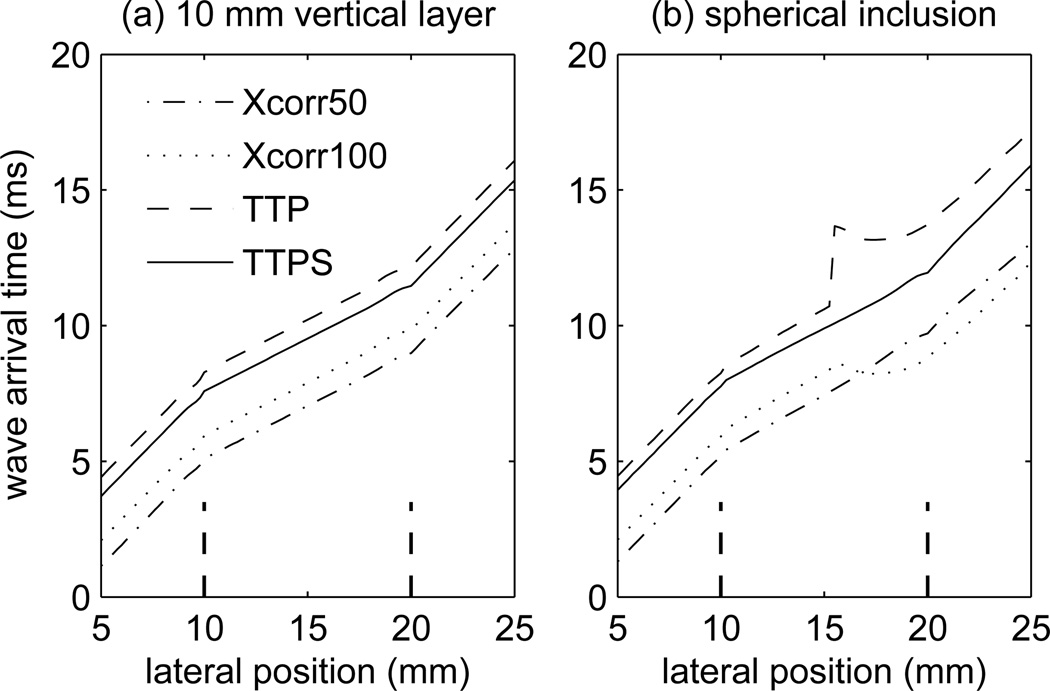
Figure 3 shows the wave arrival times calculated using the TTP, TTPS, Xcorr50, and Xcorr100 methods for the cases of wave propagation across the 10 mm thick layer and spherical lesion shown in Fig. 2. The TTP and TTPS results are plotted as absolute values determined, for example, from the peak positions indicated by the arrows in Fig. 2. The wave arrival times for the Xcorr50 and Xcorr100 methods are relative values, and the position of these data in Fig. 3 have been adjusted for clarity. For the case of the 10 mm layer, the wave arrival times determined by the four methods are similar, though small deviations from the exact arrival time lead to different results for the reconstructed shear wave speeds, see Sec. IV-B. For the case of the spherical lesion, different methods used to determine the wave arrival times give different behaviors. The TTPS and Xcorr50 methods give relatively smooth arrival times that increase monotonically with lateral position. However, the TTP and Xcorr100 methods show large deviations from the ideal behavior which arise due to the interference of reflected shear waves from the boundaries of the spherical lesion and lead to artifacts in the reconstructed shear wave speeds, see Sec. IV-C.
Fig. 3.
Arrival time vs. position for shear wave propagation across the (a) 10 mm vertical layer and (b) spherical inclusion determined using the Xcorr50, Xcorr100, TTP, and TTPS methods. The boundaries of the layer and spherical inclusion are indicated by the dashed lines at positions of 10 and 20 mm. Arrival times determined using the TTP and TTPS methods are absolute. Arrival times determined using the Xcorr50 and Xcorr100 methods are relative, and these curves have been shifted for clarity.
D. SWS Accuracy and Resolution
The accuracy of SWS reconstructions was evaluated by comparing the estimated SWS with the true speeds calculated using (2) and the material properties used in the FE models. Speeds were compared by calculating the RMS difference ΔRMS between the estimated speeds cest,i and true speeds ctrue,i at positions i along lateral profiles extending across the layer or along lateral profiles through the center of the spherical inclusion,
| (6) |
For clinical applications, it is useful to connect the error ΔRMS in SWS to the error σµ in shear modulus or error σE in Young’s modulus. Using (2) and standard propagation of error techniques gives
| (7) |
where σc = ΔRMS is the error in SWS.
The resolution of SWS estimations was evaluated by fitting the reconstructed SWS profiles across the layer or sphere using a function expressed as the product of two sigmoid functions to model the background-interior-background profile shape,
| (8) |
where x is the lateral position, cin and cout are the reconstructed speeds in the layer and background, x1 and x2 are the locations of the layer boundaries, and λ1 and λ2 represent the widths of the transition from the background into the layer, and from the layer into the background, respectively. Given a SWS profile, the six parameters cin, cout, x1, x2, λ1, and λ2 were estimated using standard non-linear least squares fitting procedures. Examples of these fits are shown in Figs. 4 and 5. In particular, estimates of λ1 and λ2 allow the SWS resolution R2080, defined as the distance required for a 20%–80% transition of the SWS, to be evaluated quantitatively,
| (9) |
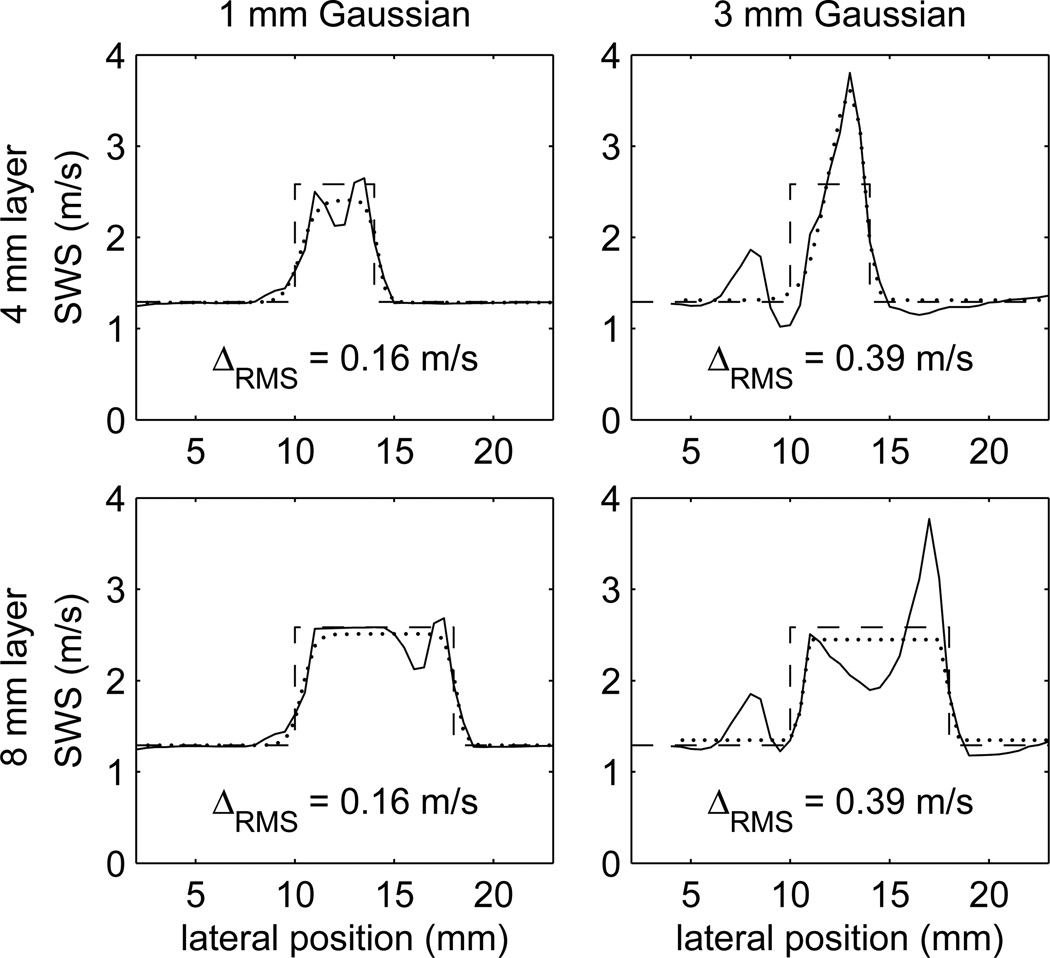
Fig. 4.
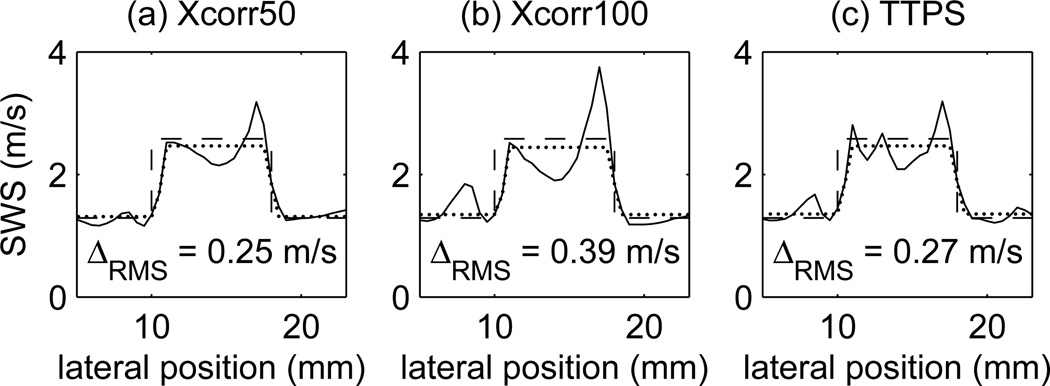
SWS reconstructions calculated using the TTP method to determine the wave arrival time from FE displacements following Gaussian excitations for shear wave propagation across a vertical layer. The layer thicknesses are 4 mm(top row) and 8 mm (bottom row), and the Gaussian excitation widths are 1 mm (left column) and 3 mm (right column). The RMS differences between the true profile (dashed line) and reconstructed profile (solid line) are indicated on each plot, and the dotted line shows the profile obtained by fitting the double sigmoid function (8) to the reconstructed profiles. The excitation was located at a lateral position of 0 mm.
Fig. 5.
Comparison of reconstructed SWS profiles across the 8 mm thick layer calculated from FE displacements following a 3 mm wide Gaussian excitation centered at a lateral position of 0 mm. The three methods used to estimate the wave arrival time are (a) Xcorr50, (b) Xcorr100, and (c) TTPS. For comparison, the reconstructed profile obtained using the TTP method is shown in Fig.4 (bottom,right). The reconstruction error ΔRMS between the true profiles (dashed lines) and reconstructed profiles (solid lines) is indicated on each plot. In addition, the profile obtained by fitting the double sigmoid function (8) to the reconstructed profiles is shown by the dotted lines.
E. SWS Image Constrast and CNR
For the case of the stiff, spherical inclusion, SWS images were also evaluated by measuring the contrast and contrast-to-noise ratio (CNR). The contrast was calculated using the relation
| (10) |
where the signals Sin and Sout are the mean pixel values from regions inside and outside the spherical inclusion, respectively. The inside region was chosen as an 8 mm diameter circular area centered on the 10 mm diameter inclusion, and the outside region consisted of two 8 mm × 3 mm rectangular areas located on either side of the lesion centered at the same axial depth as the lesion. These regions are indicated on the F/4, Xcorr50 image in Fig. 8. With E = 20 kPa (cT = 1.29 m/s) inside, and E = 5 kPa (cT = 2.58 m/s) outside, the inclusion, the true contrast given by (10) for the simulated data is 1. The CNR was calculated using the relation
| (11) |
where Sin and Sout are the same signals used for the contrast measurements, and σin and σout are the standard deviations of the pixel intensities used to calculate these signals.
Fig. 8.
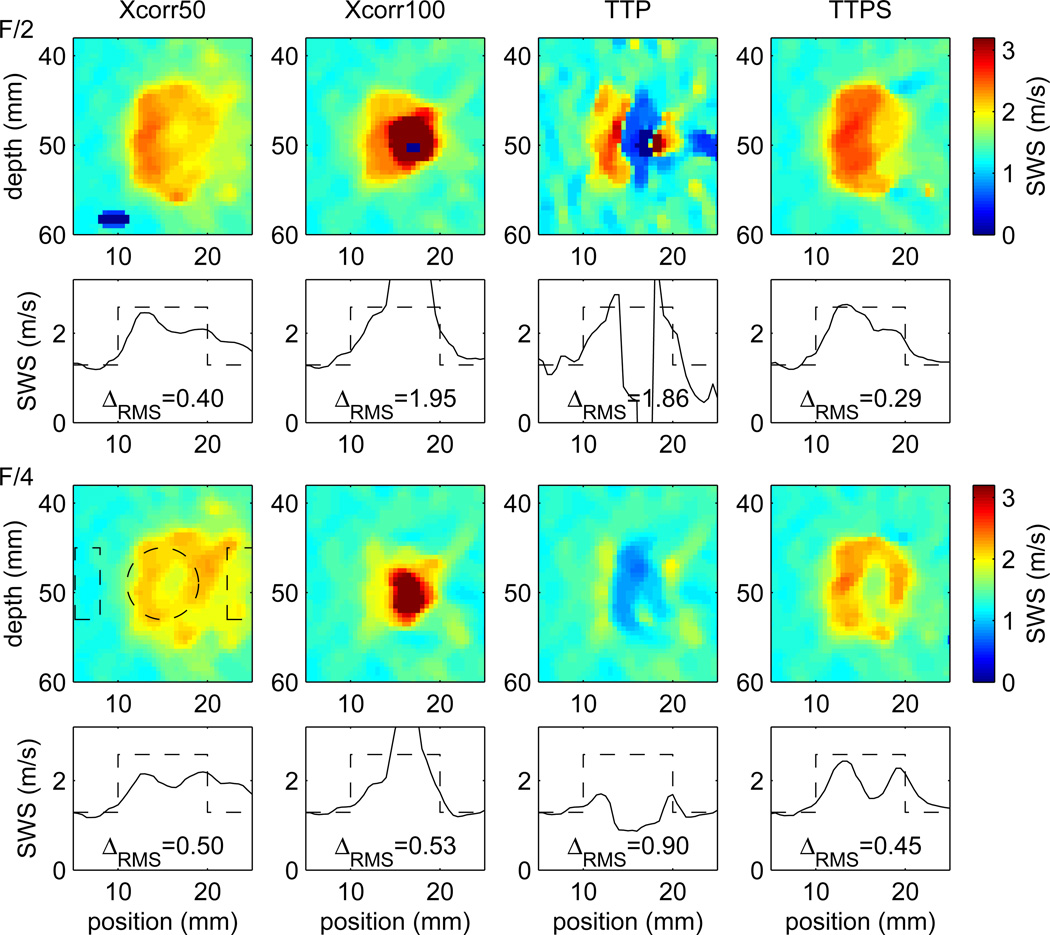
SWS images and lateral profiles at the focal depth of 49 mm for a tracked simulation of a 10 mm diameter, E = 20 kPa, spherical inclusion in a uniform background with E = 5 kPa. The pushing configurations used lateral F-numbers of F/2 (top two rows) and F/4 (bottom two rows) corresponding to beamwidths at the focal depth of 1.4 mm and 2.8 mm, respectively. The four columns show SWS reconstructions performed using the Xcorr50, Xcorr100, TTP, and TTPS methods to estimate the wave arrival time. Shear wave speeds were reconstructed using a 4 mm lateral kernel, and then smoothed using a 2 × 2 mm2 median filter. The reconstruction error ΔRMS is given (in units of m/s) for each case. For the eight images, contrast values calculated using (10) are (left to right) 0.46, 1.32, 0.34, 0.75 for the F/2 case, and 0.28, 0.98, 0.13, 0.49 for the F/4 case. Similarly, the CNR values calculated using (11) are 3.3, 1.2, 0.7, 6.4 for the F/2 case, and 1.9, 2.1, 0.8, 4.1 for the F/4 case. Regions used to calculate the contrast and CNR values are indicated by dashed lines on the F/4, Xcorr50 image.
IV. Results
A. FE Displacements
Figure 4 shows four SWS reconstructions calculated using the TTP method to determine the wave arrival time from FE displacements for shear wave propagation across 2 mm and 4 mm thick layers following 1 mm and 3 mm wide Gaussian excitations. The Young’s modulus of the layer and background were E = 20 kPa and E = 5 kPa, respectively. For each figure, the dashed line shows the true SWS profile calculated using (2), the solid line shows the SWS calculated using a 2 mm reconstruction kernel, and the dotted line shows the fit to the reconstructed SWS obtained using (8). The RMS difference between the reconstructed and true speeds calculated using (6) are indicated for each case.
Each of the plots shown in Fig. 4 exhibits two types of reconstruction artifacts. First, the size of the reconstruction kernel causes transitions between the background and layer to occur over a finite range near each boundary. Second, the reconstructed speeds show non-constant values in regions where the material properties predict constant speeds. These artifacts occur primarily near the boundaries of the layer and are significantly larger for the 3 mm Gaussian excitations compared to the 1 mm Gaussian excitations. The source of these artifacts can be seen in the displacement image in Fig. 2 (top,left) where reflections appear at the soft-to-stiff and stiff-to-soft layer boundaries. These reflections introduce changes in the wave shape and skew the TTP estimate of the wave arrival time. Changes in the SWS can also be seen by following the peak displacement as a function of lateral position in Fig. 2 and noting the slight deviations from an ideal linear trajectory near each boundary. We note that these artifacts are present in SWS reconstructions from FE displacements without any jitter introduced by ultrasonic tracking.
Because the artifacts identified in Fig. 4 depend on changes in shape of the shear wave induced by reflections near boundaries, it is interesting to consider the effect of different methods to estimate the shear wave arrival time. Figure 5 shows SWS estimates calculated using the Xcorr50, Xcorr100, and TTPS methods described in Sec. III-C to determine the shear wave arrival time for the case of the 3 mm Gaussian excitation and 8 mm layer, i.e., the same configuration for the TTP results in the bottom, right plot in Fig. 4. The RMS difference between the true (dashed line) and reconstructed (solid line) profile is indicated for each case. In addition, the dotted line shows the fit to the reconstructed SWS obtained using (8). We observe that different methods used to determine the wave arrival time give different reconstruction accuracies. The Xcorr100 and TTP methods give similar results with larger RMS differences since these methods rely more heavily on an accurate identification of the peak displacement, and therefore, are more susceptible to changes in the shape of the shear wave caused by reflections at the boundaries. On the other hand, the Xcorr50 and TTPS methods estimate the wave arrival time by relying more heavily on the position of the leading edge of the shear wave. Since the leading edge precedes the peak displacement, there is less time for and, thus, decreased likelihood that interference from a reflected wave will confound its appearance. In other words, the arrival of the leading edge of the wave is less likely to be distorted by interaction with reflected waves from the boundary between two media. Thus the arrival times estimated using the Xcorr50 and TTPS methods are less susceptible to effects introduced by reflections at the boundaries.
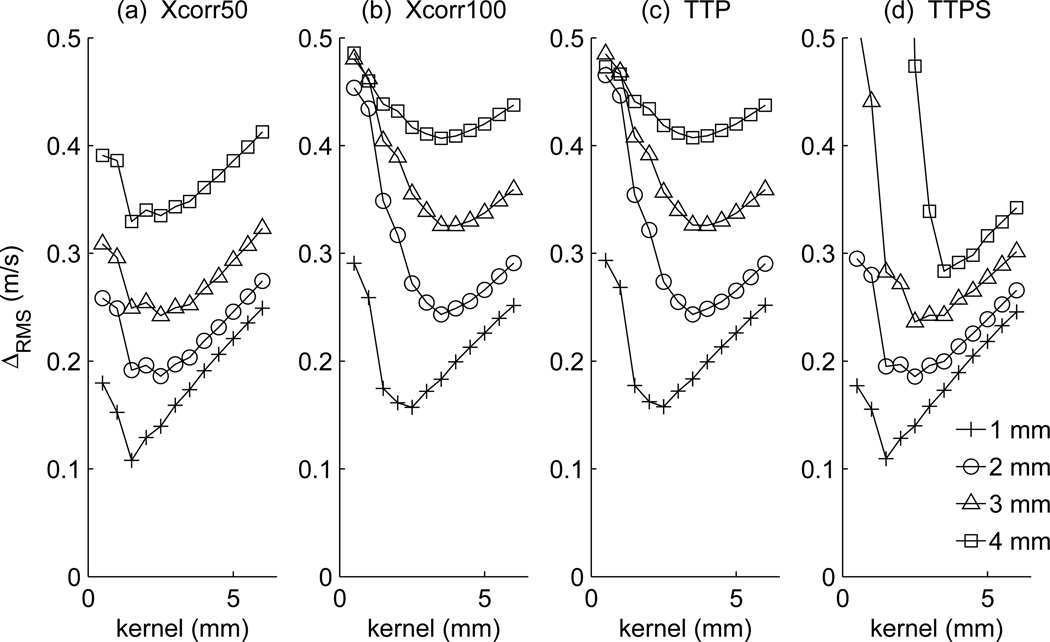
Figure 6 shows the effect of reconstruction kernel size on the reconstruction error ΔRMS for shear wave propagation across the 8 mm thick layer with the Xcorr50, Xcorr100, TTP, and TTPS arrival time estimation methods and 1, 2, 3, and 4 mm wide Gaussian excitations. For each method, wider Gaussian excitations give larger reconstruction errors, and thus, we conclude it is desirable to use a narrow shearwave excitation pulse. As the kernel size increases, each curve trends from a larger error, to a minimum value, and then increases to larger errors due to greater averaging across the boundary. Comparing different wave arrival time estimation methods, the reconstruction errors with the TTP and TTPS methods are larger than those with the Xcorr50 method at smaller kernels, but the TTPS method achieves the lowest error for larger Gaussian widths and larger kernel sizes.
Fig. 6.
SWS reconstruction error ΔRMS as a function of reconstruction kernel size for shear wave propagation across an 8 mm thick layer following 1, 2, 3, and 4 mm wide Gaussian excitations. Results are shown for the (a) Xcorr50, (b) Xcorr100, (c) TTP, and (d) TTPS reconstruction methods.
B. Tracked Layer Simulations
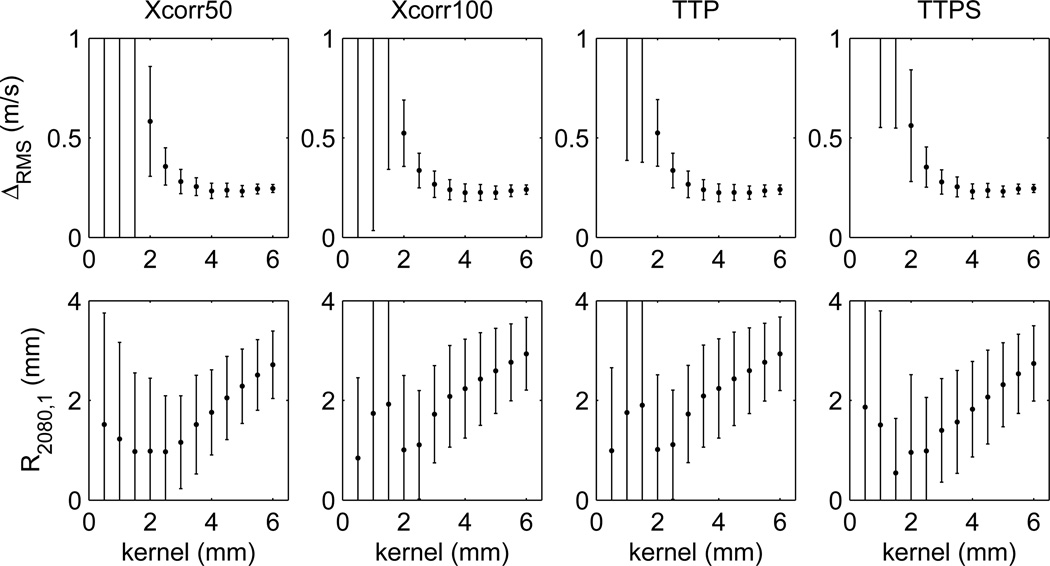
To investigate the impact of ultrasonic tracking, simulations of shear wave propagation across a stiff, vertical layer (E = 20 kPa) in a uniform background (E = 5 kPa) were performed using CH4-1 excitations with F/2 configuration (lateral beamwidth = 1.4 mm) and simulated ultrasonic tracking as described in Sec. III-B. SWS profiles (not shown) across the layer appear as noisy versions of the profiles shown in Figs. 4 and 5. Figure 7 (top row) shows the mean ± standard deviation from 10 scatterer distributions for the reconstruction error ΔRMS as a function of kernel size from SWS profiles calculated using the Xcorr50, Xcorr100, TTP, and TTPS methods to estimate the wave arrival time. We observe large variability of ΔRMS that decreases quickly with increasing kernel size. For kernels larger than roughly 2.5 mm, there is little difference in mean or standard deviation among results obtained using the Xcorr50, Xcorr100, TTP, and TTPS wave arrival time estimation methods.
Fig. 7.
SWS reconstruction error ΔRMS (top row) and resolution R2080,1 (bottom row) vs. reconstruction kernel size from simulations of CH4-1 generated shear waves, including simulated ultrasonic displacement tracking, for shear wave propagation across a 10 mm thick layer (E = 20 kPa) in a uniform background (E = 5 kPa). For this simulation, the lateral beamwidth of the CH4-1 excitation was 1.4 mm. Results are shown for the Xcorr50, Xcorr100, TTP, and TTPS methods used to estimate the wave arrival time. Plotted data are the mean ± standard deviation results calculated from 10 independent scattering realizations. Resolution results R2080,2 at the second boundary of the layer are similar to the R2080,1 results and are not shown.
Also shown in Fig. 7 are mean ± standard deviation results from 10 scatterer distributions for the values of the resolution R2080,1 calculated using (9) from fits of the double sigmoid function (8) to the SWS profiles across the 10 mm layer. Results for the resolution R2080,2 are similar and are not shown. For small kernels, there is large variability in the resolution. However, above a kernel size of roughly 2.5 mm the variability decreases, and there is an approximately linear increase with kernel size from roughly 1 mm with a 2.5 mm kernel to roughly 2.8 mm with a 6 mm kernel. As with the reconstruction accuracy, there is little difference in mean or standard deviation of the resolution among results obtained using the Xcorr50, Xcorr100, TTP, and TTPS methods.
C. Tracked Spherical Inclusion Simulations
Figure 8 shows SWS images calculated from CH4-1 excited and ultrasonically tracked displacement data from one scatterer distribution for the 10 mm diameter stiff spherical inclusion (E = 20 kPa) in a softer uniform background (E = 5 kPa). The excitation configurations used lateral F-numbers of F/2 (top two rows) and F/4 (bottom two rows) corresponding to lateral beamwidths at the focal depth of 1.4 mm and 2.8 mm, respectively. SWS reconstructions were performed using the Xcorr50, Xcorr100, TTP, and TTPS methods to estimate the shear wave arrival times. Shear wave speeds were reconstructed using a 4 mm kernel, and then smoothed using a 2 × 2 mm2 median filter. The plot under each image shows the reconstructed SWS (solid) and true SWS (dashed) profiles through the center of the sphere at the focal depth of 49 mm. The reconstruction error ΔRMS (in units of m/s) is indicated on each plot, and contrast and CNR values for each image are provided in the figure caption. Table II gives mean ± standard deviation results for the reconstruction error, contrast, and CNR calculated from SWS images reconstructed from 10 scatterer distributions.
TABLE II.
Mean ± Standard deviation results calculated from SWS images of the 10 mm diameter spherical inclusion reconstructed from 10 scatterer distributions. Images were reconstructed using the Xcorr50, Xcorr100, TTP, and TTPS methods to estimate the wave arrival time with F/2 and F/4 excitation configurations simulating a CH4-1 experimental design.
| Method | F/# | Contrast | CNR | ΔRMS(m/s) |
|---|---|---|---|---|
| Xcorr50 | F/2 | 0.44 ± 0.01 | 3.39 ± 0.39 | 0.40 ± 0.03 |
| F/4 | 0.28 ± 0.01 | 1.87 ± 0.21 | 0.49 ± 0.03 | |
| Xcorr100 | F/2 | 1.44 ± 0.67 | 1.24 ± 0.57 | 2.22 ± 1.00 |
| F/4 | 0.91 ± 0.13 | 2.19 ± 0.14 | 0.77 ± 0.21 | |
| TTP | F/2 | 0.27 ± 0.08 | 0.60 ± 0.12 | 1.13 ± 0.39 |
| F/4 | 0.15 ± 0.01 | 0.95 ± 0.13 | 0.89 ± 0.16 | |
| TTPS | F/2 | 0.73 ± 0.02 | 6.23 ± 0.71 | 0.35 ± 0.04 |
| F/4 | 0.48 ± 0.02 | 4.28 ± 0.80 | 0.44 ± 0.03 | |
The Xcorr100 and TTP results in Fig. 8 show large artifacts that can be understood from the displacement images shown in Fig. 2 (right). This image shows large displacements near the edge of the sphere at a lateral position of 20 mm which occur late in time, after the shear wave passes that location. These displacements are caused by reflected shear waves from boundaries of the sphere above and below the focal plane, and from elevation positions behind and in front of the lateral plane. Since the combined displacement from these reflections is greater than peak shear wave displacement, the displacement image in Fig. 2(b) and arrival time in Fig. 3(b) show a discontinuity in the trajectory of the peak displacement. This discontinuity is also indicated by the displaced peak location in the displacement profile at 16 mm lateral position in Fig. 2(d). Thus the TTP and Xcorr100 methods introduce large artifacts in reconstructed speeds that are reflected in the large reconstruction errors ΔRMS. Figure 3 also shows that the wave arrival times obtained using the Xcorr50 and TTPS methods are closer to the ideal trajectories. Thus, these methods produce smaller artifacts in the SWS reconstructions, as indicated by the smaller reconstruction errors ΔRMS.
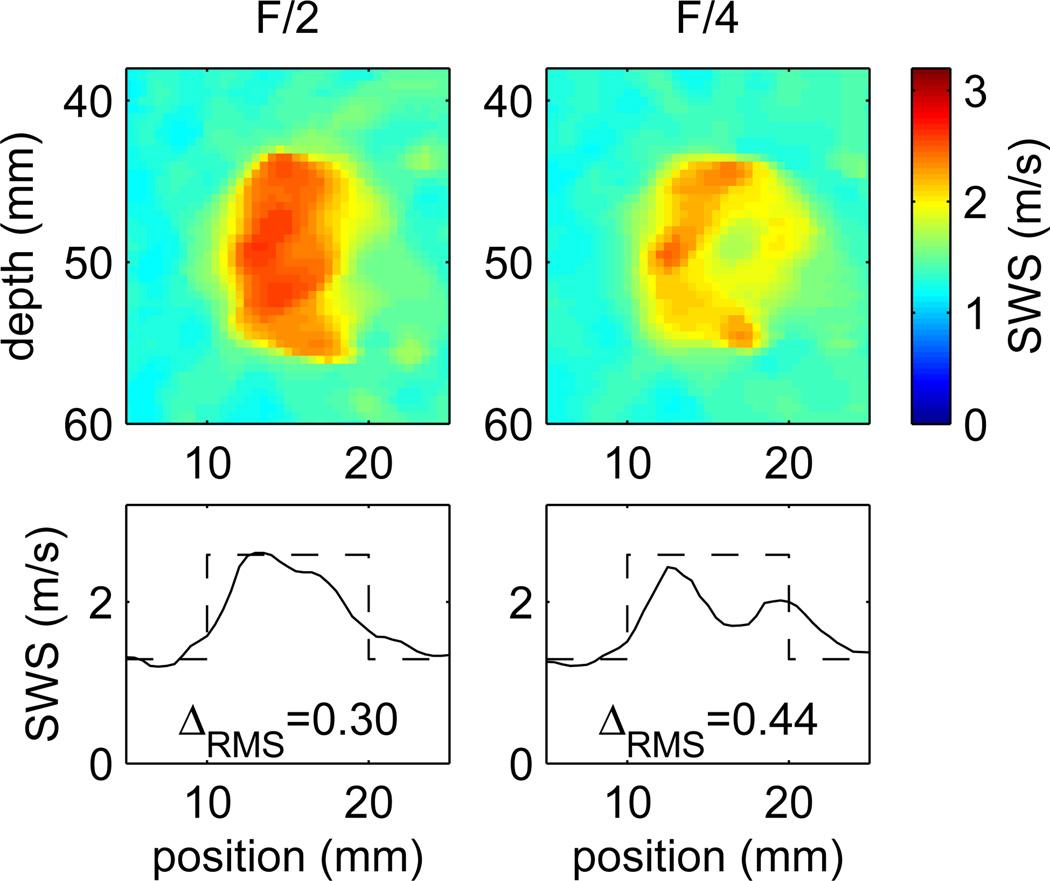
The Xcorr50 and TTPS results shown in Fig. 8 are similar, but also show some systematic differences. Both methods produce images with a fairly distinct region of increased SWS relative to the background. However, the images obtained using the TTPS method show more contrast on the right side of the lesion where the shear wave exits the lesion compared to images from the Xcorr50 method. Similarly, a comparison of reconstructed and true profiles show a more distinct fast-to-slow transition at the right edge of the lesion for the TTPS method compared to the Xcorr50 method. These observations agree with numerical values of contrast and CNR which are greater for TTPS images compared to Xcorr50 images. In addition, the results obtained using the F/4 excitation configuration underestimate the SWS and have lower values of contrast and CNR compared to the F/2 results. Numerical results from 10 scatterer distributions in Table II agree with these observations.
Because of the artifacts introduced with the TTP and Xcorr100 methods, the SWS profiles were not well modeled by the double sigmoid function (8), and it was not possible to obtain meaningful estimates of the resolution from profiles of the spherical lesion with these methods. Similarly, the double sigmoid function did not perform well in modeling the slow recovery of SWS on the right side of images reconstructed using the Xcorr50 method (Fig. 8, left column), and nonuniform structure across the lesion of the F/4, TTPS images (Fig. 8, lower right). Thus, we have not attempted a systematic comparison of the resolution calculated from images reconstructed using different methods to estimate the wave arrival time. For the case of the F/2, TTPS image (Fig. 8, upper right), the resolution values obtained using (8) and (9) are R2080,1 = 2.5 mm and R2080,2 = 5.1 mm. The corresponding mean ± standard deviation results obtained using 10 scatterer distributions are R2080,1 = 2.4 ± 0.7 mm and R2080,2 = 5.1 ± 1.7 mm. Varying the size of the reconstruction kernel gives results (not shown) very similar to those shown in Fig. 7 (bottom row) with the resolution showing large variability for small kernels, and then an approximately linear increase from roughly 1.0 mm with a kernel size of 2.5 mm to roughly 3.5 mm with a 6 mm kernel.
Finally, we consider the appearance of the images shown in Fig. 8 reconstructed using the Xcorr50 and TTPS methods used to determine the wave arrival time. These images exhibit systematic distortions compared to the circular appearance of the true lesion. For the images obtained using the F/2 excitation configuration, the reconstructed lesion appears narrower across the lateral dimension compared to the axial dimension. This distortion is also present in the images obtained using the F/4 excitation configuration, and in addition, these images show a region of decreased SWS in the interior of the lesion. Similar structures are seen in each of the images reconstructed from the 10 scatterer distributions. These effects are present even using the Xcorr50 and TTPS methods to determine the wave arrival time, though these methods are less sensitive to changes in wave shape caused by reflections at boundaries. Thus, we conclude that the excitation configuration and resulting shear wavelength can have a significant impact on the qualitative appearance and quantitative accuracy of reconstructed SWS images.
V. Discussion
The reconstruction of SWS images from TOF measurements depends on many factors related to shear wave excitation, determination of the wave arrival time, and SWS estimation method. In this study, we have investigated the influence of these factors on the resolution and accuracy of reconstructed SWS images using finite element modeling of mechanical displacements and simulated ultrasonic tracking.
The excitation beamwidth is one of the primary factors affecting image resolution and accuracy. As shown in Fig. 6 for shear wave propagation across a stiff layer, the reconstruction error increases with increasing Gaussian beamwidth for any given kernel size. This dependence on excitation beamwidth is also seen in Fig. 8 which shows reconstructions of SWS images for the spherical inclusion obtained using F/2 (beamwidth = 1.4 mm) and F/4 (beamwidth = 2.8 mm) excitations. In particular, the contrast and CNR values in Fig. 8 and Table II are greater for the F/2 case. Based on these observations, we conclude that it is desirable to use narrower excitation beamwidths for better image reconstruction.
The determination of the wave arrival time is another key factor that influences reconstruction accuracy and resolution. In this study we have investigated four methods to determine the arrival time: the TTP method that identifies the arrival time by the time of peak displacement [8], the TTPS method which identifies the arrival time using the peak slope (i.e. the peak in the velocity profile), and the Xcorr50 and Xcorr100 correlation based methods [16], [19].
The TTP and Xcorr100 methods depend critically on the identification of the peak displacement in displacement vs. time profiles. Because the peak displacement only occurs after a fraction of the wave passes the observation point, portions of the wave ahead of the peak can interact with boundaries, and reflections can interfere with the timing of the peak arrival. As shown in Fig. 2, these shape changes can be seen in the raw displacement data for wave propagation across both the stiff layer and spherical inclusion. For the case of the spherical inclusion, reflections from positions out of plane at the sphere boundaries converge to give large displacements late in time and introduce a discontinuity in the wave arrival time as shown in Fig. 3(b). These artifacts are particularly important when calculating the SWS using finite sized kernels. As shown in Fig. 4 (bottom, right) and Fig. 5, the TTP and Xcorr100 methods perform poorly due to the reflections from the stiff-to-soft transition at the back edge of the stiff layer. Similarly, the SWS images in Fig. 8 calculated using the TTP method show large artifacts at the right edge of the inclusion where reflections cause the discontinuity in the peak displacement position shown in Fig. 2.
The TTPS and Xcorr50 methods determine the wave arrival time by estimating the position of the leading edge of the wave. Since this edge precedes the peak displacement, the arrival time occurs before the time of peak displacement, and there is less opportunity for reflection from boundaries to sum constructively at the leading edge of the wave to skew the arrival times. Also, for the case of the spherical inclusion, Fig. 3 shows that the wave arrival time determined using the TTPS and Xcorr50 methods does not suffer from the large artifacts introduced by late peak displacement with the Xcorr100 and TTP methods. As shown in Fig. 4, the TTPS and Xcorr50 methods yield SWS estimates with lower reconstruction error for the stiff vertical layer. Similarly, the TTPS and Xcorr50 results shown in Fig. 8 for the spherical inclusion have lower reconstruction error and greater contrast and CNR compared to the TTP and Xcorr100 results. Based on these observations, we conclude that determination of the wave arrival time using methods that identify the leading edge of the wave give better SWS reconstructions compared to methods that rely on identification of the peak displacement. Furthermore, comparison of the TTPS and Xcorr50 results in Fig. 8 and Table II indicate lower reconstruction error and greater contrast and CNR for the TTPS case. Thus, of the four methods used to estimate the wave arrival time that were investigated in this study, we conclude that the best results are obtained using the TTPS method.
Shear wave reflections can be a source of artifact when generating images of tissue stiffness, especially when using TOF algorithms where assumptions in propagation direction are being made. Recently, Deffieux, et al. [23] have addressed this problem using a directional filter [24] to identify the backward moving shear waves as negative frequencies in Fourier space that can be eliminated in the frequency domain before their TOF algorithms are applied to the displacement data. In addition, this filter improves the signal-to-noise ratio of the acquired data by removing nearly half of the k-space domain with a corresponding reduction of white noise. However, the directional filter does not remove the reflected waves from the boundaries of the spherical lesion that lead to the discontinuity in peak displacements seen in Fig. 2. Figure 9 shows the reconstructed images obtained when the filter is included in the reconstruction algorithm for the case of the TTPS method and F/2 and F/4 excitation configurations from Fig. 8. Reconstruction errors are shown on the figures, and contrast and CNR values are given in the figure caption. We observe that the qualitative appearance of the images reconstructed using the directional filter are similar to the original images in Fig. 8, In addition, the reconstruction errors are reduced and the contrast and CNR values are improved compared to the original images in Fig. 8. Hence, we conclude that including the directional filter in the reconstruction algorithm is helpful, and recommend its use along with the TTPS method to estimate the wave arrival time.
Fig. 9.
SWS images and lateral profiles obtained by including the directional filter described by Deffieux, et al. [23] in the reconstruction procedure for the same distribution of scatters and TTPS method to estimate the wave arrival time as shown in Fig. 8. Results are shown using the F/2 (left) and F/4 (right) excitation configurations. The reconstruction error ΔRMS is given (in units of m/s) on the figure. Values of contrast and CNR, calculated using the same regions as shown in Fig. 8. are 0.78 and 7.2 for the F/2 case, and 0.50 and 4.6 for the F/4 case, respectively.
Compared to purely mechanical displacements in FE models, displacements estimated using ultrasonic tracking have increased noise which impact the selection of kernel size used in the TOF-SWS reconstructions. As shown in Fig. 7, variations in kernel size have the expected effects: small kernel sizes are associated with better spatial resolution at the expense of accuracy (large ΔRMS). Increasing the kernel size decreases the error at the expense of spatial resolution which increases roughly in proportion to increased kernel size. So in selecting an optimal kernel size, one must consider the size of the excitation beamwidth and the tradeoff between accuracy and spatial resolution of the specific clinical application. For example, based upon these findings, we have selected a kernel size of 4 mm for the specific experimental configuration simulated herein.
VI. Conclusion
The quality of shear wave speed (SWS) images reconstructed using time-of-flight (TOF) techniques following impulsive, radiation force excitation in materials depends on many factors related to shear wave excitation, determination of the wave arrival time, and parameters used to calculate the wave speed. In this study, we have used finite element models with simulated ultrasonic tracking to investigate the influence of these factors on the accuracy, resolution, contrast, and contrast-to-noise ratio (CNR) of SWS images. Methods used to determine the arrival time of the shear wave include cross correlation (Xcorr), time to peak displacement (TTP), and time to peak slope (TTPS). The TTP and Xcorr100 methods which rely on identification of the peak displacement are sensitive to changes in wave shape introduced by reflections at boundaries, whereas the Xcorr50 and TTPS method that identify the leading edge of the shear wave are less sensitive to these reflections. Furthermore, errors introduced by these reflections increase significantly with increasing shear wavelength. Increasing the reconstruction kernel size to reduce these errors leads to the expected loss of spatial resolution. We conclude that the optimal TOF based approach will include the use of a narrow excitation beam, the TTPS method to estimate wave arrival time, inclusion of a directional filter [23] in the reconstruction algorithm, and a regression kernel size that is selected based on the tradeoffs between accuracy and resolution for a specific clinical application that is typically between 2× and 6× the size of the wavelength.
Acknowledgments
The authors thank the reviewers for many helpful suggestions. We also thank Siemens Healthcare, Ultrasound Business Unit, Mountain View, CA, USA, for their system support, and thank Xuan Ding for programming support during the initial phases of this investigation.
This work was supported by NIH grants R01 EB-002132 and R01 CA-142824.
References
- 1.Sarvazyan A, Rudenko OV, Swanson SD, Fowlkes JB, Emelianov SY. Shear wave elasticity imaging: a new ultrasonic technology of medical diagnostics. Ultrasound Med. Biol. 1998;vol. 24(no. 9):1419–1435. doi: 10.1016/s0301-5629(98)00110-0. [DOI] [PubMed] [Google Scholar]
- 2.Chen S S, Fatemi M M, Greenleaf JF. Quantifying elasticity and viscosity from measurement of shear wave speed dispersion. J. Acoust. Soc. Am. 2004;vol. 115(no. 6):2781–2785. doi: 10.1121/1.1739480. [DOI] [PubMed] [Google Scholar]
- 3.Chen S, Urban MW, Pislaru C, Kinnick R, Zheng Y, Yao A, Greenleaf JF. Shearwave dispersion ultrasound vibrometry (SDUV) for measuring tissue elasticity and viscosity. IEEE Trans. Ultrason., Ferroelectr., Freq. Contr. 2009;vol. 56(no. 1):55–62. doi: 10.1109/TUFFC.2009.1005. [DOI] [PMC free article] [PubMed] [Google Scholar]
- 4.Bercoff J, Tanter M, Fink M. Supersonic shear imaging: a new technique for soft tissue elasticity mapping. IEEE Trans Ultrason Ferroelectr Freq Control. 2004;vol. 51(no. 4):396–409. doi: 10.1109/tuffc.2004.1295425. [DOI] [PubMed] [Google Scholar]
- 5.Tanter M, Bercoff J, Athanasiou A, Deffieux T, Gennisson JL, Montaldo G, Muller M, Tardivon A, Fink M. Quantitative assessment of breast lesion viscoelasticity: initial clinical results using supersonic shear imaging. Ultrasound Med. Biol. 2008;vol. 34(no. 9):1373–1386. doi: 10.1016/j.ultrasmedbio.2008.02.002. [DOI] [PubMed] [Google Scholar]
- 6.McAleavey SA, Menon M, Elegbe E. Shear modulus imaging with spatially-modulated ultrasound radiation force. Ultrason. Imaging. 2009;vol. 31(no. 4):217–234. doi: 10.1177/016173460903100401. [DOI] [PMC free article] [PubMed] [Google Scholar]
- 7.Nightingale K, McAleavey S, Trahey G. Shear-wave generation using acoustic radiation force: in vivo and ex vivo results. Ultrasound Med. Biol. 2003;vol. 29(no. 12):1715–1723. doi: 10.1016/j.ultrasmedbio.2003.08.008. [DOI] [PubMed] [Google Scholar]
- 8.Palmeri ML, Wang MH, Dahl JJ, Frinkley KD, Nightingale KR. Quantifying hepatic shear modulus in vivo using acoustic radiation force. Ultrasound Med. Biol. 2008;vol. 34(no. 4):546–558. doi: 10.1016/j.ultrasmedbio.2007.10.009. [DOI] [PMC free article] [PubMed] [Google Scholar]
- 9.Nyborg W. Acoustic Streaming. In: Mason W, editor. Physical Acoustics. New York: Academic Press; 1965. pp. 299–233. [Google Scholar]
- 10.Torr G. The acoustic radiation force. Am. J. Phys. 1984;vol. 52(no. 5):402–408. [Google Scholar]
- 11.Nightingale KR, Palmeri ML, Nightingale RW, Trahey GE. On the feasibility of remote palpation using acoustic radiation force. J. Acoust. Soc. Am. 2001;vol. 110(no. 1):625–634. doi: 10.1121/1.1378344. [DOI] [PubMed] [Google Scholar]
- 12.Palmeri ML, Sharma AC, Bouchard RR, Nightingale RW, Nightingale KR. A Finite-Element Method Model of Soft Tissue Response to Impulsive Acoustic Radiation Force. IEEE Trans Ultrason Ferroelectr Freq Control. 2005;vol. 52(no. 10):1699–1712. doi: 10.1109/tuffc.2005.1561624. [DOI] [PMC free article] [PubMed] [Google Scholar]
- 13.Oliphant TE, Manduca A, Ehman RL, Greenleaf JF. Complex-valued stiffness reconstruction for magnetic resonance elastography by algebraic inversion of the differential equation. Magn. Reson. Med. 2001;vol. 45(no. 2):299–310. doi: 10.1002/1522-2594(200102)45:2<299::aid-mrm1039>3.0.co;2-o. [DOI] [PubMed] [Google Scholar]
- 14.Sinkus R, Tanter M, Catheline S, Lorenzen J, Kuhl C, Sondermann E, Fink M. Imaging anisotropic and viscous properties of breast tissue by magnetic resonance-elastography. Magn. Reson. Med. 2005;vol. 53:372–387. doi: 10.1002/mrm.20355. [DOI] [PubMed] [Google Scholar]
- 15.Sinkus R, Tanter M, Xydeas T, Catheline S, Bercoff J, Fink M. Viscoelastic shear properties of in vivo breast lesions measured by MR elastography. Magn Reson Imaging. 2005;vol. 23:159–165. doi: 10.1016/j.mri.2004.11.060. [DOI] [PubMed] [Google Scholar]
- 16.McLaughlin J, Renzi D. Shear wave speed recovery in transient elastography and supersonic imaging using propagating fronts. Inverse Problems. 2006;vol. 22(no. 2):681–706. [Google Scholar]
- 17.Wang MH, Palmeri ML, Rotemberg VM, Rouze NC, Nightingale KR. Improving the Robustness of Time-of-Flight Based Shear Wave Speed Reconstruction Methods Using RANSAC in Human Liver in vivo. Ultrasound Med. Biol. 2010;vol. 36(no. 5):802–813. doi: 10.1016/j.ultrasmedbio.2010.02.007. [DOI] [PMC free article] [PubMed] [Google Scholar]
- 18.Rouze NC, Wang MH, Palmeri ML, Nightingale KR. Robust Estimation of Time-of-Flight Shear Wave Speed Using a Radon Sum Transformation. IEEE Trans Ultrason Ferroelectr Freq Control. 2010;vol. 57(no. 12):2662–2669. doi: 10.1109/TUFFC.2010.1740. [DOI] [PMC free article] [PubMed] [Google Scholar]
- 19.McLaughlin J, Renzi D. Using level set based inversion of arrival times to recover shear wave speed in transient elastography and supersonic imaging. Inverse Problems. 2006;vol. 22(no. 2):707–725. [Google Scholar]
- 20.Jensen JA, Svendsen NB. Calculation of Pressure Fields from Arbitrarily Shaped, Apodized, and Excited Ultrasound Transducers. IEEE Trans Ultrason Ferroelectr Freq Control. 1992;vol. 39(no. 2):262–267. doi: 10.1109/58.139123. [DOI] [PubMed] [Google Scholar]
- 21.Palmeri ML, McAleavey SA, Trahey GE, Nightingale KR. Ultrasonic Tracking of Acoustic Radiation Force-Induced Displacements in Homogeneous Media. IEEE Trans Ultrason Ferroelectr Freq Control. 2006;vol. 53(no. 7):1300–1313. doi: 10.1109/tuffc.2006.1665078. [DOI] [PMC free article] [PubMed] [Google Scholar]
- 22.Walker WF, Trahey GE. A Fundamental Limit on Delay Estimation Using Partially Correlated Speckle Signals. IEEE Trans Ultrason Ferroelectr Freq Control. 1995;vol. 42(no. 2):301–308. [Google Scholar]
- 23.Deffieux T, Gennisson JL, Bercoff J, Tanter M. On the effects of reflected waves in transient shear wave elastography. IEEE Trans. Ultrason. Ferroelectr. Freq. Control. 2011;vol. 58:2032–2035. doi: 10.1109/TUFFC.2011.2052. [DOI] [PubMed] [Google Scholar]
- 24.Manduca A, Lake DS, Kruse SA, Ehman RL. Spatio-temporal directional filtering for improved inversion of MR elastography images. Med. Image. Anal. 2003;vol. 7:465–473. doi: 10.1016/s1361-8415(03)00038-0. [DOI] [PubMed] [Google Scholar]


