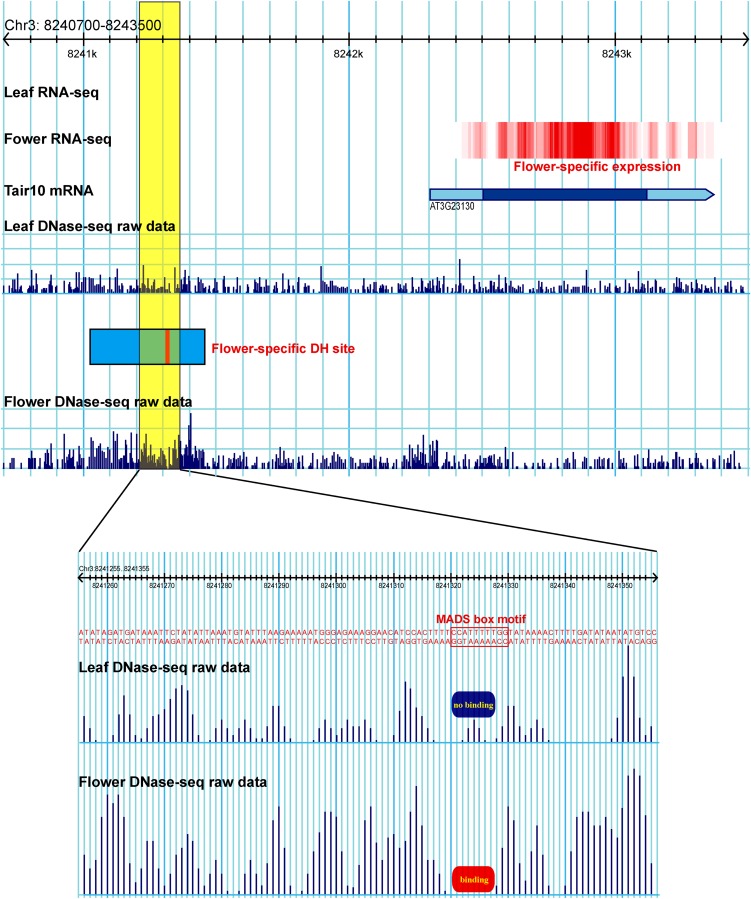
This article reports high-resolution mapping of the genomic locations that are hypersensitive to DNase I digestion (DH sites) in Arabidopsis thaliana. The DH site data sets in combination with known or putative protein binding motifs and gene expression data sets can be used to reveal protein binding footprints within a specific genomic region.
Abstract
Gene expression and regulation in eukaryotes is controlled by orchestrated binding of regulatory proteins, including both activators and repressors, to promoters and other cis-regulatory DNA elements. An increasing number of plant genomes have been sequenced; however, a similar effort to the ENCODE project, which aimed to identify all functional elements in the human genome, has yet to be initiated in plants. Here we report genome-wide high-resolution mapping of DNase I hypersensitive (DH) sites in the model plant Arabidopsis thaliana. We identified 38,290 and 41,193 DH sites in leaf and flower tissues, respectively. The DH sites were depleted of bulk nucleosomes and were tightly associated with RNA polymerase II binding sites. Approximately 90% of the binding sites of two well-characterized MADS domain transcription factors, APETALA1 and SEPALLATA3, were covered by the DH sites. We demonstrate that protein binding footprints within a specific genomic region can be revealed using the DH site data sets in combination with known or putative protein binding motifs and gene expression data sets. Thus, genome-wide DH site mapping will be an important tool for systematic identification of all cis-regulatory DNA elements in plants.
INTRODUCTION
Sequencing of the model plant Arabidopsis thaliana in 2000 represented one of the most significant milestones in plant biology research (Arabidopsis Genome Initiative, 2000). Since then, the plant science community has made a major effort to decipher the functions of the ∼25,000 genes encoded by the Arabidopsis genome (Ausubel, 2002). This goal, however, has proved to be more daunting than initially expected. The function of each gene is controlled by binding of regulatory proteins to promoters and other regulatory DNA elements. Thus, information on what proteins bind to cis-regulatory DNA elements and when and where these proteins bind is important to understand the regulation and thus function of each gene.
Chromatin immunoprecipitation (ChIP) using antibodies specific to regulatory proteins, such as transcription factors, in combination with sequencing (ChIP-seq) or microarrays (ChIP-chip) are powerful approaches to map protein binding sites in higher eukaryotes. However, the ChIP technique relies on the availability of a high-quality antibody or a transgenic line expressing an epitope-tagged target protein. In addition, the Arabidopsis genome contains more than 1000 transcription factors (Guo et al., 2005). ChIP-based methodology is further complicated by the fact that many plant transcription factors are multigene families. Thus, it will be a substantial undertaking to map all of the regulatory proteins using ChIP-seq and ChIP-chip approaches. Thus far, only a limited number of genome-wide transcription factor binding maps have been reported in plant species, all in Arabidopsis (Thibaud-Nissen et al., 2006; Lee et al., 2007; Kaufmann et al., 2009; Morohashi and Grotewold, 2009; Oh et al., 2009; Zheng et al., 2009; Kaufmann et al., 2010; Yant et al., 2010; Ouyang et al., 2011).
A common characteristic of all genomic regions associated with regulatory proteins is a pronounced sensitivity to DNase I digestion. Genome-wide mapping of DNase I hypersensitive (DH) sites has proved to be a powerful approach to identify cis-regulatory DNA elements in Saccharomyces cerevisiae (Hesselberth et al., 2009) and humans (Boyle et al., 2011; Song et al., 2011). We generated genome-wide high-resolution maps of DH sites from seedling and flower tissues of Arabidopsis. The Arabidopsis DH sites were significantly associated with various cis-regulatory DNA elements previously characterized in the Arabidopsis genome. We demonstrate that protein binding footprints resulting from transcription factor binding can be revealed by combining the DH site data sets with known protein binding sites or known cis-regulatory DNA elements. These results illustrate the value of DH, the signature of open chromatin, in mapping and characterizing regulatory DNA sequences in plants.
RESULTS
Genome-Wide Identification of DH Sites in Arabidopsis
We developed a total of five DNase I hypersensitive site sequencing (DNase-seq) libraries (see Methods) for genome-wide identification of genomic locations that are hypersensitive to DNase I digestion. These libraries were developed using leaf and flower tissues from the ecotype Columbia (Col-0) and a deficient in DNA methylation1 (ddm1) mutant of Col-0. These libraries were sequenced using the Illumina Genome Analyzer II. We obtained a total of 190 million sequence reads from these libraries (see Supplemental Table 1 online). Approximately 114 million reads had a single sequence match in the Arabidopsis genome (see Supplemental Table 1 online). DH sites were identified using the F-seq software (Boyle et al., 2008b) with a false discovery rate (FDR) <0.01 (see Methods).
To confirm the reproducibility of the DH sites, we measured the Pearson correlation coefficient of data sets between biological replicates from the same tissue or data sets between different technical replicates generated from sequencing of the same DNase-seq library two or three times (see Supplemental Table 1 online). DNase-seq read counts from nonoverlapping 100-bp regions across the entire Arabidopsis genome were plotted for each replicate. The Pearson correlation coefficient from these comparisons ranged from 0.92 to 0.99, indicating a high reproducibility of the data sets (see Supplemental Figure 1 online). The sequence reads from different biological or technical replicates were then combined for further analysis. We identified 38,290 DH sites in Col-0 leaf tissue, 41,193 in Col-0 flower tissue, 38,313 in ddm1 leaf tissue, and 38,153 in ddm1 flower tissue.
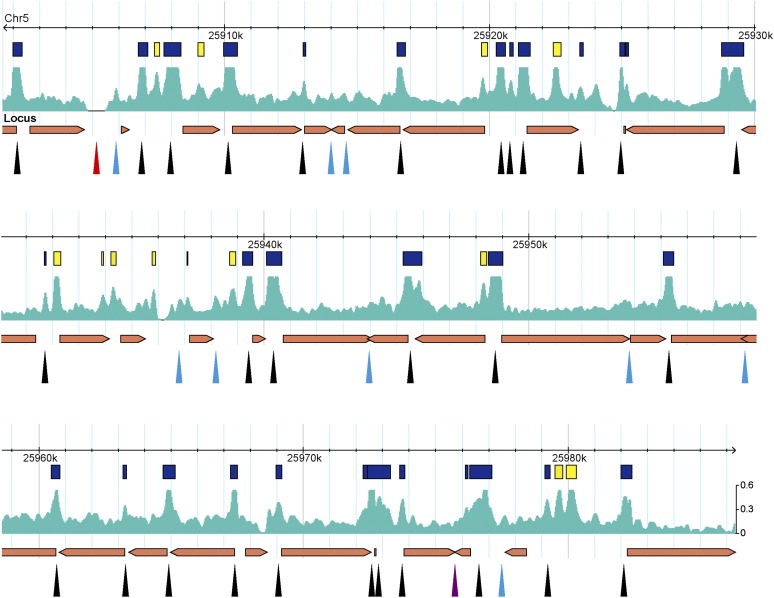
The DH sites within an 80-kb region on the long arm of chromosome 5 were previously identified based on the traditional technique using gel blot hybridization. A total of 40 DH sites were identified in this region that spans 34 genes (Kodama et al., 2007) (Figure 1). We found that 29 of these DH sites overlapped with DH sites identified in our data set derived from leaf tissue. Nine additional DH sites were close to the threshold to be DH sites in our data set. By contrast, our data set identified 13 additional DH sites within this region. Most of the 13 DH sites showed a high DNase I sensitivity value and thus were clearly missed by the traditional technique (Figure 1).
Figure 1.
DH Sites Identified within an 80-kb Region on the Long Arm of Chromosome 5.
Boxes (yellow and blue colors) represent DH sites identified by DNase-seq. Arrowheads point to the DH sites identified using the traditional gel blot hybridization technique (Kodama et al., 2007). Black arrowheads overlap with DH sites identified by DNase-seq. Blue arrowheads point to regions that are close to the threshold to be DH sites in the DNase-seq data set. A red arrowhead points to a region that was filtered out in the DNase-seq data set. Yellow boxes and a purple arrowhead point to the DH sites that do not overlap between DNase-seq and traditional DNase-seq.
Change of DNase I Sensitivity of the Pericentromeric Heterochromatin in ddm1 Mutant
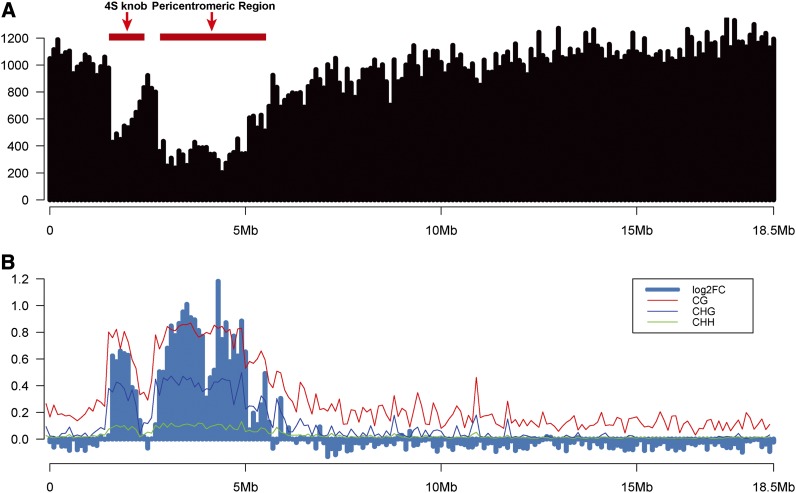
To display the distribution of DNase-seq reads along individual chromosomes, normalized reads were counted in 100-kb windows across the Arabidopsis genome. The DNase-seq read numbers were dramatically reduced in the pericentromeric regions of all five chromosomes (see Supplemental Figure 2 online). For example, the pericentromeric region and a heterochromatic knob on chromosome 4, which is located close to the centromere on the short arm (Fransz et al., 2000), displayed a significantly lower number of reads compared with the rest of the chromosome (Figure 2A).
Figure 2.
Distribution of DH Sites (Leaf Tissue) along Chromosome 4.
(A) The y axis shows normalized read counts in 100-kb windows. The short and long horizontal red bars mark the locations of a heterochromatin knob and the pericentromeric heterochromatin on chromosome 4.
(B) The y axis represents log2-fold change (log2FC) of normalized read counts between ddm1 leaf tissue and wild-type leaf tissue in 100-kb windows. Red, blue, and green lines indicate the levels of CG, CHG, and CHH methylation, respectively, in 100-kb windows (data from wild-type leaf tissue [Cokus et al., 2008]). The x axis shows the DNA sequence position on chromosome 4.
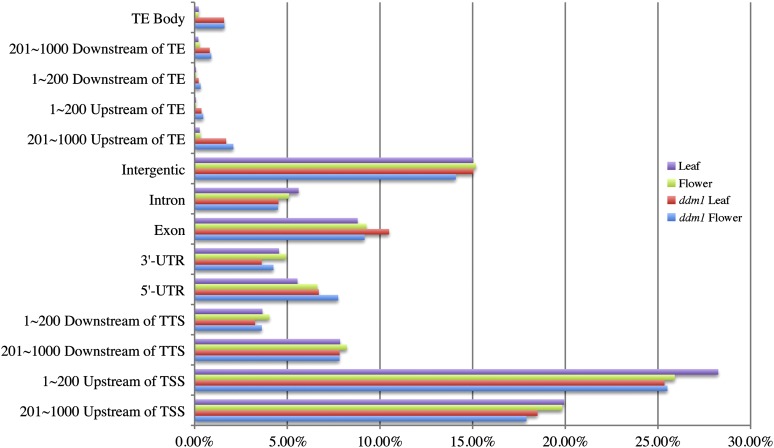
It has been well documented that the DNA sequences associated with the pericentromeric regions of all five Arabidopsis chromosomes are highly methylated (Zhang et al., 2006; Zilberman et al., 2007; Cokus et al., 2008). The methylation level of DNA sequences within the pericentromeric regions is significantly reduced in the ddm1 mutant (Lippman et al., 2004). Interestingly, the pericentromeric regions in ddm1 showed significantly higher normalized DNase-seq read counts than those from wild-type plants (Figure 2B; see Supplemental Figure 3 online). Thus, the overall DNase I sensitivity of the pericentromeric heterochromatin was significantly increased in the ddm1 mutant. By contrast, the overall DNase I sensitivity in the euchromatic regions of ddm1 was not increased compared with the wild type (Figure 2B; see Supplemental Figure 3 online). In addition, the percentage of DH sites associated with transposable elements in the ddm1 mutant (4.69% in leaf and 5.39% in flower) were significantly higher than those in the wild type (0.22% in leaf and 0.20% in flower) (Figure 3). These results are correlated with the activation of various types of transposable elements in the ddm1 mutant (Lippman et al., 2004; Tsukahara et al., 2009).
Figure 3.
Genomic Locations of DH Sites Relative to Genes and Transposable Elements.
The x axis shows the percentage of DH sites associated with each type of genomic location.
Genomic Locations and Tissue Specificity of DH Sites
We examined the locations of DH sites relative to the locations of genes. Approximately 45% of the DH sites in all tissue types were located within 1 kb upstream of a transcription start site (TSS), which represents a putative promoter region (Figure 3). More than one-half of these promoter-associated DH sites were located within 200 bp of a TSS. Approximately 15% of the DH sites were cataloged as falling into intergenic regions (no genes within ±1 kb flanking the DH sites) (Figure 3).
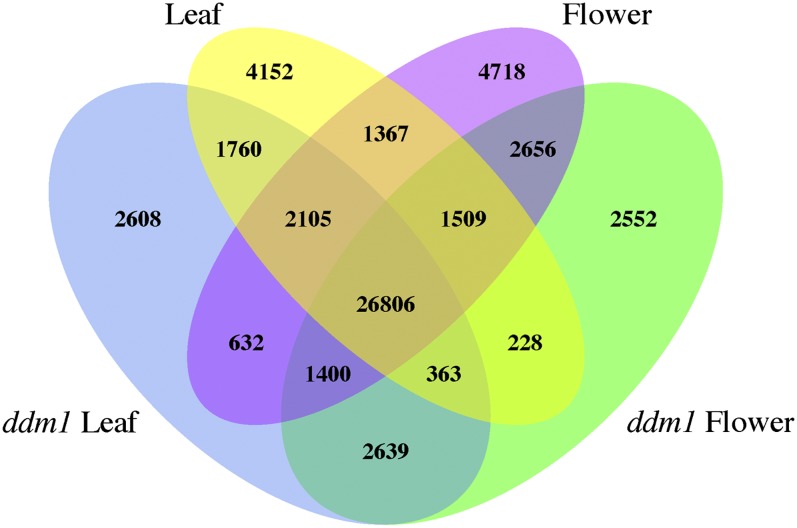
Pairwise comparisons of the DH sites derived from different tissue types revealed DH sites specific to each tissue (Figure 4). For example, 9926 DH sites were found in flower tissue but not in leaf tissue. Conversely, 8520 DH sites were found in leaf tissue but not in flower tissue (Figure 4). Similar DH site changes have recently been reported in different cell types in mammalian species (Song et al., 2011; Waki et al., 2011).
Figure 4.
Pairwise Comparisons of DH Sites Identified from Four Different Tissue Types.
The Venn diagram shows tissue-specific DH sites as well as overlaps of DH sites found in leaf and flower of ddm1 and the wild type.
We examined the genes associated with the flower-specific DH sites and found a strong enrichment of functions related to developmental regulation of flowers, embryos, seeds, and fruits (see Supplemental Figure 4 online). These results show that the tissue-specific DH sites are preferentially involved in developmental regulation of the corresponding tissue/organ. We also examined the genomic locations of the top 1000 tissue-specific DH sites (based on the intensity of DNase-seq signal) from leaf versus ddm1 leaf and flower versus ddm1 flower comparisons. The DH sites specific to ddm1 leaf/flower tissues were almost exclusively located in the pericentromeric regions, whereas the DH sites specific to the wild-type leaf/flower tissues were uniformly distributed throughout the euchromatic arms (see Supplemental Figure 5 online). These results again show that the ddm1 mutation mainly affects the structure of the pericentromeric heterochromatin and has significantly less effect on euchromatin.
DH Sites Were Depleted of Bulk Nucleosomes
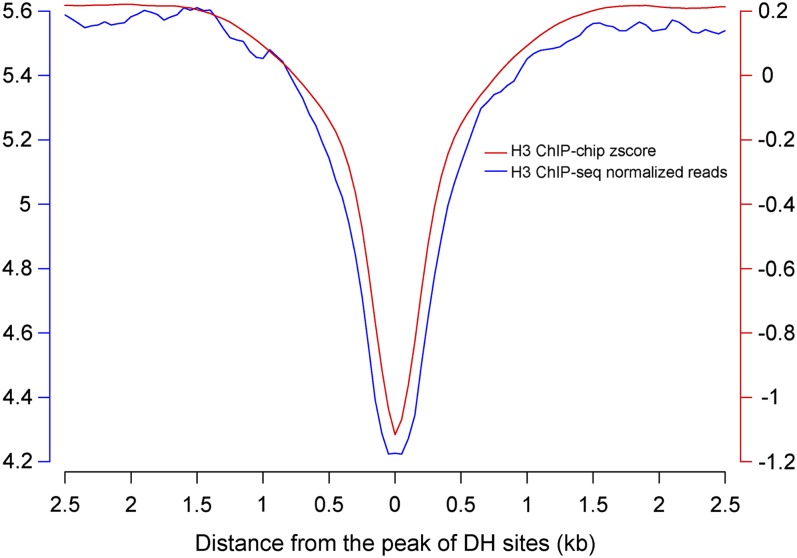
DH sites represent the most nucleosome-depleted/-dynamic regions, because of their association with regulatory proteins. We used the ChIP-seq and ChIP-chip data sets derived from antibodies against the C terminus of histone H3 (Ha et al., 2011; Roudier et al., 2011) to examine the level of nucleosome occupancy in regions associated with DH sites. We calculated the z scores of ChIP-chip and normalized reads of ChIP-seq within ±2500-bp regions surrounding the peak of DH sites. The analyses confirmed the depletion of nucleosomes within the DH sites (Figure 5).
Figure 5.
H3 Nucleosome Occupancy in DH Sites.
The x axis represents the distance from the peak of the DH sites. The y axes represent relative levels of nucleosome occupancy based on ChIP-chip z score or ChIP-seq normalized sequence reads.
DH Sites Were Tightly Associated with RNA Polymerase II Binding Sites
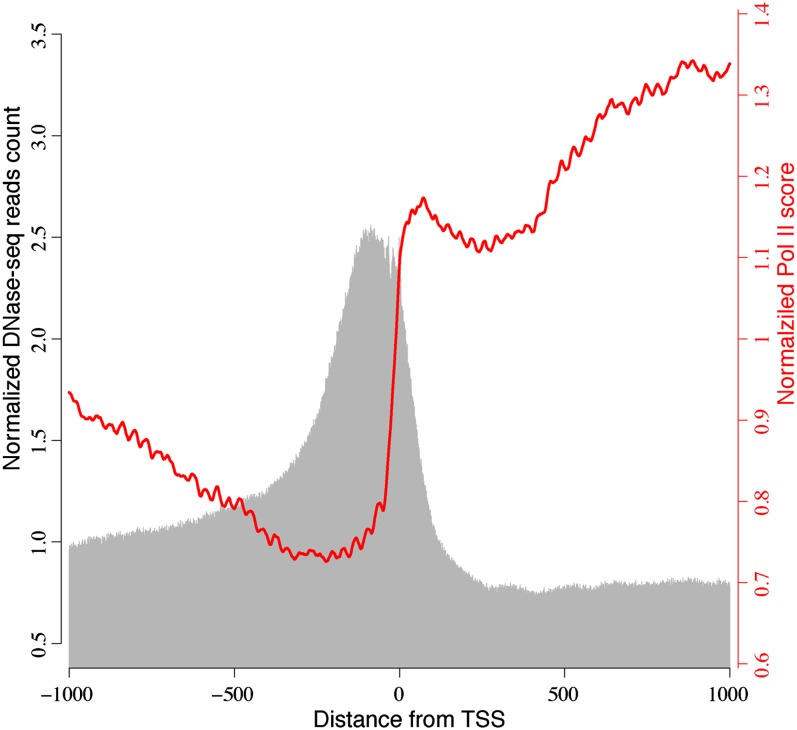
To investigate the correlation between DH sites and RNA polymerase II (Pol II) activity, we plotted the ChIP-chip Pol II binding data set (Chodavarapu et al., 2010) and DNase-seq read count within ±1 kb of TSS. The peaks of DH sites were mapped upstream of TSS. By contrast, Pol II occupancy was sharply enriched immediately after TSS (Figure 6). The partial overlapping between DH sites and Pol II binding sites in Figure 6 shows a tight association between these two types of genomic regions.
Figure 6.
Association between DH Sites and Pol II Binding Sites near TSS.
The x axis is distance (bp) from TSS. Gray bars represent normalized DNase-seq read count within ±1 kb regions of TSS. Red line represents normalized ChIP-chip Pol II score within ±1 kb regions of TSS.
[See online article for color version of this figure.]
The Binding Sites of MADS Domain Transcription Factors AP1 and SEP3 Were Highly Correlated with DH Sites
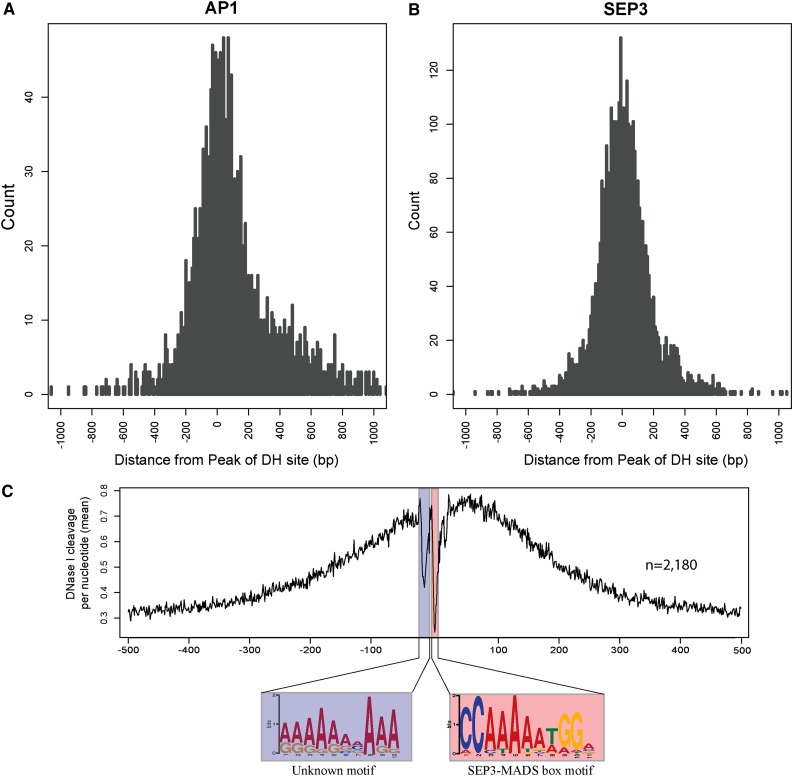
The MADS domain transcription factors APETALA1 (AP1) and SEPALLATA3 (SEP3) play key roles in regulating flower development in Arabidopsis (Mandel et al., 1992; Liljegren et al., 1999; Pelaz et al., 2000; Vandenbussche et al., 2003) and are among the best characterized transcription factors in plants. Recently, genome-wide AP1 and SEP3 binding sites were revealed by ChIP using AP1- and SEP3-specific antibodies followed by deep sequencing (Kaufmann et al., 2009; Kaufmann et al., 2010). This ChIP-seq approach identified a total of 1942 AP1 binding sites and 4281 SEP3 binding sites in inflorescence tissue (FDR < 0.001). Strikingly, DH sites derived from flower tissue were found to be associated with 1843 (94.9%) of the 1942 AP1 binding sites (Figure 7A). Similarly, 3841 (89.7%) of the 4281 SEP3 binding sites overlapped with DH sites identified in flower tissue (Figure 7B). In addition, the ChIP-seq signal peaks of most AP1 and SEP3 binding sites overlapped with the DNase-seq signal peaks of the corresponding DH sites (Figures 7A and 7B). These results show that AP1 and SEP3 binding sites are well covered by the DH sites. Similarly, the binding sites of several of the best characterized mammalian regulatory proteins overlapped well with DH sites (Boyle et al., 2011; John et al., 2011).
Figure 7.
Association of Transcription Factors AP1 and SEP3 Binding Sites with DH Sites (All Data from Flower Tissue).
(A) Distribution of distance between the peaks of AP1 binding sites and the peaks of DH sites. The y axis represents the DNase-seq read count in 10-bp windows.
(B) Distribution of distance between the peaks of SEP3 binding sites and the peaks of DH sites. The y axis represents the DNase-seq read count in 10-bp windows.
(C) SEP3 binding footprints revealed by DH sites that overlap with SEP3 binding sites. The x axis represents the distance from the SEP3 motif, and the y axis represents the DNase I cut per nucleotide (mean).
We analyzed the tissue specificity of the DH sites associated with the AP1 and SEP3 binding sites. A total of 398 AP1 binding sites and 497 SEP3 binding sites were associated with flower-specific DH sites. By contrast, only 113 AP1 and 129 SEP3 binding sites were associated with leaf-specific DH sites. We identified 265 genes associated with these 398 AP1 binding sites and 439 genes associated with the 497 SEP3 binding sites. We then compared the expression levels of these genes in flowers versus leaves using RNA sequencing (RNA-seq) data sets derived from the same tissues used for DNase-seq (see Methods). Interestingly, the expression level of these genes was significantly higher in flower tissue than in leaf tissue (Kolmogorov-Smirnov test, P = 0.0004085 for the AP1-regulated genes, P = 3.029×10⁻⁵ for the SEP3-regulated genes). Similarly, we identified 73 genes associated with the 113 AP1 binding sites and 93 genes associated with the 129 SEP3 binding sites. By contrast, the expression level of these genes was not significantly different in leaf tissue compared with flower tissue (Kolmogorov-Smirnov test, P = 0.8904 for the AP1-regulated genes, P = 0.8815 for the SEP3-regulated genes). These results demonstrate that tissue-specific DH sites are significantly associated with tissue-specific gene expression.
DH Sites Revealed Protein Binding Footprints Associated with SEP3 Binding Sites
When a regulatory protein binds a DNA sequence, the protein-bound sequence will be protected from nuclease cleavage relative to the flanking exposed sequences (Galas and Schmitz, 1978). This protection leaves a footprint of the protein binding region in sequencing data sets derived from partially DNase I-digested chromatin (Hesselberth et al., 2009; Boyle et al., 2011). To examine whether the SEP3 binding sites were associated with footprints in the DNase-seq data set, we identified 1638 SEP3 binding sites that contain a total of 2180 CC[A/T]6GG SEP3 binding motifs (Kaufmann et al., 2009). We aligned the 2180 sequences using the CC[A/T]6GG motif as the center and included ±500 bp of sequence flanking each motif. We counted the numbers of DNase I cut for each nucleotide using the DNase-seq data sets. The position of the CC[A/T]6GG motif overlapped with a major dip of the DNase-seq read count (Figure 7C), suggesting these bases were protected from the DNase I digestion. A similar result was obtained from analysis using AP1 binding sequences (data not shown). Interestingly, the aligned sequences contained another dip that was 12 bp away from the center dip (Figure 7C), suggesting that this flanking region is possibly protected by another regulatory protein(s). Sequence analysis within this dipped region revealed several unknown motifs, including an [A/G][A/G][A/G]A[A/G][A/G][A/C/G]A[A/G]A motif (Figure 7C), which was found in 122 of the 2180 sequences. This motif resembles the (GA)n binding site recognized by GAGA-motif binding proteins, which are known to affect a range of developmental processes in Arabidopsis (Monfared et al., 2011). These results suggest that the expression of some of the SEP3-regulated genes is possibly regulated or coregulated by other transcription factors. A similar analysis in human DH data sets revealed a protein binding footprint that is 10 bp upstream of the footprint associated with the insulator protein CTCF (Boyle et al., 2011). Similarly, ∼10 to 20% of these upstream footprints contained a defined motif bound by the zinc finger protein ZBTB3 (Boyle et al., 2011).
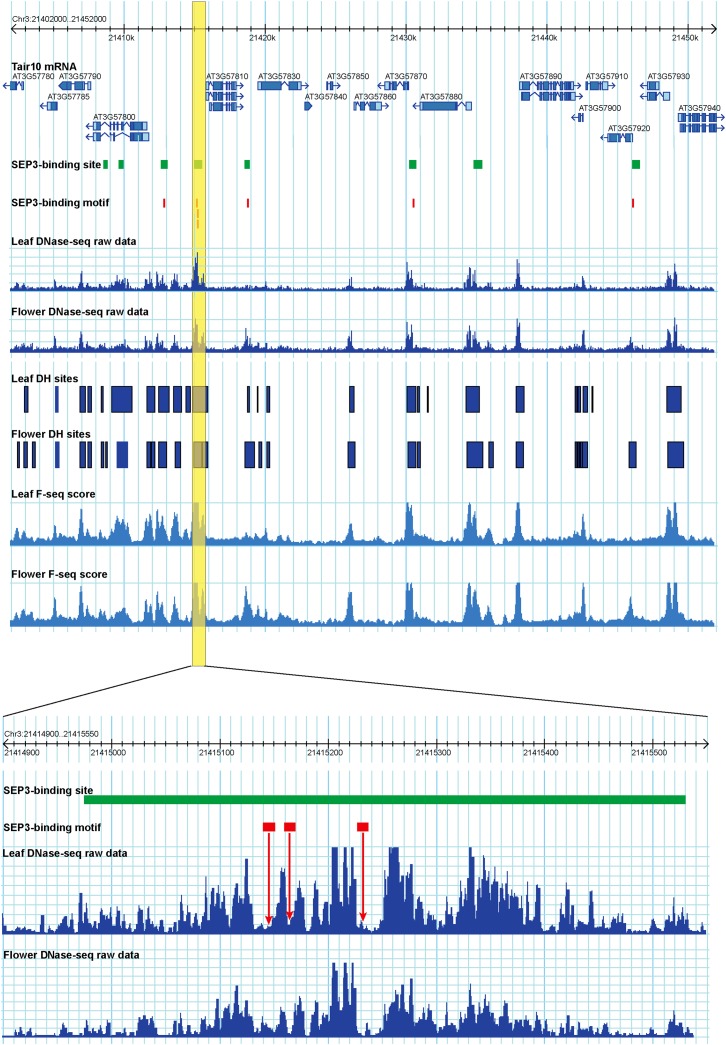
We then examined potential footprints associated with individual SEP3 binding site. For each SEP3 binding site, we counted the numbers of DNase I cut for each nucleotide of the CC[A/T]6GG motif and the ±100 bp region surrounding the motif. We then used CENTIPEDE (Pique-Regi et al., 2011) to determine whether a footprint was associated with each of the 2180 CC[A/T]6GG motifs. We identified footprints (CENTIPEDE score >0.95) from 650 of the 2180 regions (Figure 8). Additional DNase-seq read dips often presented in individual regions (Figure 8), suggesting binding of additional regulatory proteins to the same region. This agrees with a recent report that the regulation of Arabidopsis genes is often controlled by cis-regulatory modules that contain multiple transcription factor binding sites (Ding et al., 2012).
Figure 8.
Footprints Associated with SEP3 Binding Sites.
A 50-kb region on chromosome 3 contains eight SEP3 binding sites (green boxes) that are all associated with a DH site in one or both tissues. A total of seven CC[A/T]6GG motifs (red bars) are found in five SEP3 binding sites. A region containing three CC[A/T]6GG motifs (yellow box) is enlarged. A DNase I cleavage footprint was associated with each of the three motifs (red arrows). TE, transposable elements; TTS, transcription terminal site; UTR, untranslated region.
Footprint Mapping Based on DNA Motifs and DH Site Data Sets
We next tested whether the same approach can be used to examine the protein binding footprint of a genomic region that is putatively bound to transcription factors. The Arabidopsis gene SUPERMAN (SUP) plays a key role in proper spatial development of reproductive floral tissues (Sakai et al., 1995). The expression and regulation of this gene has been extensively studied. The promoter of the SUP gene contains a MADS box motif and is potentially targeted by several MADS domain transcription factors, including AP1, AP3, PISTILLATA, and AGAMOUS (Riechmann et al., 1996). The expression of the SUP gene (AT3G23130) was detected in our RNA-seq data set derived from the flower tissue (fragments per kilobase of exon per million fragments mapped [FPKM] = 8.17) but not in the RNA-seq data set from the leaf tissue (FPKM = 0). In parallel, a DH site was detected in the flower DNase-seq data set, but not in the leaf data set (Figure 9). This flower-specific DH site covers the promoter of the SUP gene, including a MADS box motif (Figure 9). This MADS box motif is expected to be bound by the MADS domain transcription factors during flower development and thus is protected from DNase I digestion. We found that the bases around the MADS box motif were completely devoid of DNase I cleavage in flower tissue, leaving a clear footprint (Figure 9). By contrast, DNase I cleavage was detected within this motif in the DH site data set derived from leaf tissue (Figure 9).
Figure 9.
Footprint Associated with the MADS Box Motif in the Promoter of the SUP Gene.
A DH site (blue box) was detected in the flower tissue. A MADS box motif (red bar) is located within the DH site. A portion of the DH site (yellow box) is enlarged. Seven bases of the MADS box motif were devoid of DNase I cuts in flower tissue, leaving a protein binding footprint in this region. By contrast, DNase I cuts were associated with the same bases in the leaf tissue.
A large number of cis-acting DNA elements, which are potentially associated with various transcription factors, have been identified in the Arabidopsis genome (Yilmaz et al., 2011). However, the function of most of these cis-acting elements has not been experimentally confirmed. We next tested whether the DH data sets can be used to examine whether these putative cis elements are associated with protein binding footprints. We downloaded all 99 annotated motifs (http://Arabidopsis.med.ohio-state.edu/AtcisDB/bindingsites.html) and remapped them to the Arabidopsis reference genome. We selected 63 motifs that had a minimum of 100 perfect matches in the genome for further analysis. We identified all DH sites containing a specific motif and aligned the sequences of the DH sites using the motif as the center and including ±500 bp around the motif. A clear dip(s) in the profile of DNase I cut per nucleotide was observed at the center of the sequence alignments in 26 of the 63 motifs analyzed (see Supplemental Table 2 online), supporting the idea that these motifs are likely true protein binding DNA elements.
If a genomic region containing one of these 26 motifs is covered by a DH site, then the DNase-seq data can potentially be used to test whether a footprint is associated with this region. For example, the Myb-related transcription factor CCA1 binds the AA(A/C)AATCT motif (Wang et al., 1997). A total of 11,141 regions with this CCA1 binding motif were found in the Arabidopsis genome. The AA(A/C)AATCT motifs in many of these genomic regions likely represent random sequences. Only 2194 motifs were covered by leaf DH sites, and 2237 motifs were covered by flower DH sites. Footprints were associated with 680 motifs within leaf DH sites and 653 motifs within flower DH sites (see Supplemental Table 2 online).
DISCUSSION
Genome-wide maps of DH sites have been developed in several species, including S. cerevisiae (Hesselberth et al., 2009), Drosophila melanogaster (Li et al., 2011), humans (Boyle et al., 2008a), and rice (Oryza sativa) (Zhang et al., 2012). Approximately 39 and 42% of the DH sites are located in the intergenic regions in human and rice genomes, respectively. By contrast, only ∼15% of the DH sites are located in intergenic regions in Arabidopsis. Most noticeably, ∼13% of the human DH sites are located within 2 kb upstream of genes (Boyle et al., 2008a); 27% of rice DH sites are within 1 kb upstream of rice genes (Zhang et al., 2012). However, in Arabidopsis, almost 45% of the DH sites are located within 1 kb upstream of the genes. The significantly higher percentage of DH sites in promoter regions and lower percentage of DH sites in intergenic regions in Arabidopsis is correlated with a much more compacted genome, including high gene density and low percentage of intergenic sequences, of Arabidopsis compared with rice and humans.
We demonstrate that the potential protein binding footprint of a specific genomic region can be assessed using DH site data combined with information of known or putative DNA motifs and gene expression data sets (Figure 9). However, footprints were only revealed from DH sites containing 26 of the 63 motifs analyzed. In addition, only a fraction of the DH sites containing these 26 motifs showed a region protected against DNase I cleavage (see Supplemental Table 2 online). This can be explained at least partially by several factors. First, some of the reported cis-regulatory elements were identified based largely on computational prediction, and the motifs are not yet precisely defined. Second, the sensitivity and resolution of footprint detection will rely on the depth of the DNase-seq data set and the level of background noise in the experiment. A simulation analysis showed that our DH site data sets from both leaf and flower tissues have not been saturated yet. In comparison, protein binding footprints were revealed at a much higher resolution using an ultradeep DH site data set in S. cerevisiae (Hesselberth et al., 2009). As sequencing costs continue to decrease, we expect to significantly increase the depth of the Arabidopsis DH data sets. Finally and probably most important, a transcription factor may bind to a cis-regulatory element only within a specific type of cell and/or at a specific developmental stage. Both seedling and flower tissues are composed of various types of cells at different developmental stages. DH sites that are highly specific to a unique cell type or a specific developmental stage will not be identified if the corresponding cells account for only a small proportion of the cells in the tissue used for DH experiments.
Several recent articles showed dynamic DH site changes in different tissues or cell types. Song et al. (2011) analyzed the DH sites in seven cell lines representing diverse human cell types. The number of DH sites ranged from 100,000 to 125,000 for each cell line. Only 30 to 40% of the DH sites were shared between any two cell types (Song et al., 2011). In rice, 58% more DH sites were identified in callus than in seedling (Zhang et al., 2012). Thus, development of open chromatin maps associated with different tissues/organs at different developmental stages will be essential for comprehensive understanding of regulation of gene expression in Arabidopsis. Such efforts could be accomplished by combining DH site mapping with applications of cell type–specific sorting (Birnbaum et al., 2003) or microdissection (Nakazono et al., 2003; Jiao et al., 2009).
It has been well documented that the dynamics of active and silent chromatin in plants can be induced by abiotic stresses (Chinnusamy and Zhu, 2009; Tittel-Elmer et al., 2010). DH site data sets generated from plants under normal growing conditions may be less informative for mapping footprints resulting from binding of regulatory proteins induced by stress conditions. To assess this possibility, we analyzed the footprints associated with genomic regions containing abscisic acid–responsive elements, which are cis-regulatory elements responsible for drought-/cold-induced and abscisic acid–dependent gene expression (Shinozaki and Yamaguchi-Shinozaki, 2000). The Arabidopsis genome includes 1809 regions containing the abscisic acid–responsive element binding motif (C/T)ACGTGGC (Choi et al., 2000). We found that 667 and 684 of these regions overlapped with leaf and flower DH sites, respectively. Mapping of the DNase I cut at each nucleotide of DNA sequences associated with these DH sites did not reveal a protection of the (C/T)ACGTGGC sequence from DNase I digestion in our current DH data sets (see Supplemental Figure 6 online). Thus, DH data sets derived from specific tissue, development stage, and stressed conditions will be the keys for detecting footprints derived from specific regulatory proteins.
Most of the research on identification and characterization of cis-regulatory DNA elements has been conducted in Arabidopsis. Transfer of this cis element information from Arabidopsis to other plant species will be a challenge, because of the diversity and complexity in DNA recognition by transcription factors (Badis et al., 2009) and the rapid divergence of transcription factor–DNA interactions (Wilson and Odom, 2009; Moyroud et al., 2011). Thus, computational prediction of cis-regulatory elements using information from Arabidopsis and/or other model eukaryotes will need to be confirmed using experimental approaches. DH site maps, which can be readily generated from any plant species with a sequenced genome, provide a foundation for fast and genome-wide conformational analysis of putative cis-regulatory elements.
METHODS
Plant Materials
Seeds of Arabidopsis thaliana Col-0 and a homozygous ddm1-2 mutant in Col-0 background were germinated in one-half–strength Murashige and Skoog medium. The seedlings of wild type (Col-0) and ddm1-2 were either grown in the same medium under 16-h light/8-h dark cycles at 23°C for collecting young leaf tissues or were transferred into potting soil and grown under the same light-dark conditions until flowering. Two-week old leaf tissues and closed flower buds from both wild-type and ddm1-2 plants were collected and were immediately frozen in liquid nitrogen. All collected samples were ground into fine powder for DNase-seq and RNA-seq experiments.
DNase-Seq and RNA-Seq
DNase-seq experiments, including nuclei isolation, DNase I digestion, and DNase-seq library construction, were performed as previously described (Zhang et al., 2012). DNase-seq libraries were developed from two biological replicates for leaf and flower tissues of both wild-type and ddm1-2 mutant and were sequenced using Illumina Genome Analyzer II. The experimental procedures for RNA-seq, including RNA extraction, cDNA synthesis, and preparation of barcoded RNA-seq libraries, were the same as published protocols (Zhang et al., 2012). RNA-seq libraries were developed from three biological replicates from both leaf and flower tissues of Col-0. We generated 58 million and 43 million RNA-seq reads from flower and leaf tissues, respectively. We mapped 90.3% of the leaf RNA-seq reads and 89.6% of the flower reads to the TAIR10 reference genome using TopHat (Trapnell et al., 2009). We used Cufflink to measure the expression level (FPKM) of Arabidopsis annotated genes (Trapnell et al., 2010).
Data Analysis
DNase-seq reads were aligned to Arabidopsis genome (TAIR10) with no mismatches allowed using Bowtie (Langmead et al., 2009). Only sequence reads mapped to a unique position were used for further analysis. We used F-seq (Boyle et al., 2008b) to identify DH sites with a 300-bp bandwidth. To estimate the FDR, we generated 10 random data sets that contain the same read number as the DNase-seq data set. FDR was calculated as the ratio of number of DH sites identified based on random data sets with F-seq to the number of DH sites from the DNase-seq data. A threshold was set in F-seq to control the FDR < 0.01. To reveal the distribution of DNase-seq reads in the Arabidopsis genome, we calculated the coverage of unique reads (mapped to a unique position of the Arabidopsis genome) in each 100-kb nonoverlapping window from the entire chromosomes. This coverage was used to adjust the read count of each 100-kb nonoverlapping window from the five chromosomes. To measure the fold change of DH region on each chromosome, the normalized reads were counted in each 100-kb window and were used to calculate the log2 ratio of corresponding window between ddm1 and the wild type.
We used MEME-chip (Machanick and Bailey, 2011) and MEME (Bailey and Elkan, 1994) to identity specific DNA motifs. Previously characterized DNA motifs were downloaded from AtcisDB (Yilmaz et al., 2011), and their locations in the genome were remapped to TAIR10. To identify potential footprints resulting from protein binding, we used the motif as the center to align sequences of DH sites containing a specific motif. We then counted the numbers of DNase I cut at each nucleotide of the motif and ±100 bp around the motif based on the numbers of DNase-seq reads. We used CENTIPEDE to measure the footprinting score (Pique-Regi et al., 2011) to determine whether a footprint can be called within a specific locus.
All Arabidopsis genome sequence and annotation data came from http://www.Arabidopsis.org (TAIR10) (Swarbreck et al., 2008). The DNA methylation data sets used were downloaded from http://epigenomics.mcdb.ucla.edu/DNAmeth/ and http://www.ncbi.nlm.nih.gov/geo (GSE10877) (Cokus et al., 2008; Lister et al., 2008). We used BS Seeker (Chen et al., 2010) to remap the bisulfite sequences to TAIR10. All gene ontology data was downloaded from http://www.geneontology.org/. Data processing and statistical analysis were done using Perl and R.
Accession Numbers
The DH site and RNA-seq data sets have been submitted to the National Center for Biotechnology Information databases under ID number GSE34318. The data can also be viewed by a Generic Genome Browser (https://mywebspace.wisc.edu/groups/jiang/Web/Jiming_Jiang_Lab/Resource.html).
Supplemental Data
The following materials are available in the online version of this article.
Supplemental Figure 1. DNase-Seq Data Correlation among Different Biological Replicates and Different Technical Replicates.
Supplemental Figure 2. DNase I Sensitivity along All Five Arabidopsis Chromosomes.
Supplemental Figure 3. Distribution of DH Sites along Arabidopsis Chromosomes.
Supplemental Figure 4. Network of Biological Processes of Gene Ontology Categories for Genes Associated with Flower-Specific DH Sites.
Supplemental Figure 5. Distribution of the Top 1000 Tissue-Specific DH Sites from Leaf versus ddm1 Leaf and Flower versus ddm1 Flower Comparisons.
Supplemental Figure 6. Mean Nucleotide-Level Accessibility within DNA Sequences Associated with DH Sites That Contain the Abscisic Acid–Responsive Element Binding Motif (C/T)ACGTGGC.
Supplemental Table 1. Summary of the Sequence Data from the Five DNase-Seq Libraries.
Supplemental Table 2. Footprints within the DH Sites Containing Known cis-Regulatory DNA Elements.
Supplementary Material
Acknowledgments
We thank Olivier Mathieu, Clermont Université, France, for providing the homozygous seeds of ddm1-2 mutant. We thank Robin Buell, Michigan State University, for helping with the RNA-seq experiments and Cory Hirsch, Michigan State University, for valuable comments on the article. This research was partially supported by grant DBI-0923640 from the National Science Foundation.
AUTHOR CONTRIBUTIONS
J.J. and W.Z. designed the research. W.Z. performed DNase-seq experiments, and T.Z. and Y.W performed bioinformatics analysis. W.Z., T.Z., and Y.W contributed equally to data analysis and interpretation. J.J. wrote the article.
Glossary
- DH
DNase I hypersensitive
- ChIP
chromatin immunoprecipitation
- Col-0
ecotype Columbia
- FDR
false discovery rate
- TSS
transcription start site
- Pol II
polymerase II
- FPKM
fragments per kilobase of exon per million fragments mapped
- ChIP-seq
chromatin immunoprecipitation combined with sequencing
- ChIP-chip
chromatin immunoprecipitation combined with microarrays
- DNase-seq
DNase I hypersensitive site sequencing
- RNA-seq
RNA sequencing
References
- Arabidopsis Genome Initiative (2000). Analysis of the genome sequence of the flowering plant Arabidopsis thaliana. Nature 408: 796–815 [DOI] [PubMed] [Google Scholar]
- Ausubel F.M. (2002). Summaries of National Science Foundation-sponsored Arabidopsis 2010 projects and National Science Foundation-sponsored plant genome projects that are generating Arabidopsis resources for the community. Plant Physiol. 129: 394–437 [Google Scholar]
- Badis G., et al. (2009). Diversity and complexity in DNA recognition by transcription factors. Science 324: 1720–1723 [DOI] [PMC free article] [PubMed] [Google Scholar]
- Bailey T.L., Elkan C. (1994). Fitting a mixture model by expectation maximization to discover motifs in biopolymers. Proc. Int. Conf. Intell. Syst. Mol. Biol. 2: 28–36 [PubMed] [Google Scholar]
- Birnbaum K., Shasha D.E., Wang J.Y., Jung J.W., Lambert G.M., Galbraith D.W., Benfey P.N. (2003). A gene expression map of the Arabidopsis root. Science 302: 1956–1960 [DOI] [PubMed] [Google Scholar]
- Boyle A.P., Davis S., Shulha H.P., Meltzer P., Margulies E.H., Weng Z., Furey T.S., Crawford G.E. (2008a). High-resolution mapping and characterization of open chromatin across the genome. Cell 132: 311–322 [DOI] [PMC free article] [PubMed] [Google Scholar]
- Boyle A.P., Guinney J., Crawford G.E., Furey T.S. (2008b). F-Seq: A feature density estimator for high-throughput sequence tags. Bioinformatics 24: 2537–2538 [DOI] [PMC free article] [PubMed] [Google Scholar]
- Boyle A.P., Song L.Y., Lee B.-K., London D., Keefe D., Birney E., Iyer V.R., Crawford G.E., Furey T.S. (2011). High-resolution genome-wide in vivo footprinting of diverse transcription factors in human cells. Genome Res. 21: 456–464 [DOI] [PMC free article] [PubMed] [Google Scholar]
- Chen P.Y., Cokus S.J., Pellegrini M. (2010). BS Seeker: Precise mapping for bisulfite sequencing. BMC Bioinformatics 11: 203. [DOI] [PMC free article] [PubMed] [Google Scholar]
- Chinnusamy V., Zhu J.K. (2009). Epigenetic regulation of stress responses in plants. Curr. Opin. Plant Biol. 12: 133–139 [DOI] [PMC free article] [PubMed] [Google Scholar]
- Chodavarapu R.K., et al. (2010). Relationship between nucleosome positioning and DNA methylation. Nature 466: 388–392 [DOI] [PMC free article] [PubMed] [Google Scholar]
- Choi H.I., Hong J.H., Ha J.O., Kang J.Y., Kim S.Y. (2000). ABFs, a family of ABA-responsive element binding factors. J. Biol. Chem. 275: 1723–1730 [DOI] [PubMed] [Google Scholar]
- Cokus S.J., Feng S.H., Zhang X.Y., Chen Z.G., Merriman B., Haudenschild C.D., Pradhan S., Nelson S.F., Pellegrini M., Jacobsen S.E. (2008). Shotgun bisulphite sequencing of the Arabidopsis genome reveals DNA methylation patterning. Nature 452: 215–219 [DOI] [PMC free article] [PubMed] [Google Scholar]
- Ding J., Hu H.Y., Li X.M. (2012). Thousands of cis-regulatory sequence combinations are shared by Arabidopsis and poplar. Plant Physiol. 158: 145–155 [DOI] [PMC free article] [PubMed] [Google Scholar]
- Fransz P.F., Armstrong S., de Jong J.H., Parnell L.D., van Drunen C., Dean C., Zabel P., Bisseling T., Jones G.H. (2000). Integrated cytogenetic map of chromosome arm 4S of A. thaliana: Structural organization of heterochromatic knob and centromere region. Cell 100: 367–376 [DOI] [PubMed] [Google Scholar]
- Galas D.J., Schmitz A. (1978). DNAse footprinting: A simple method for the detection of protein-DNA binding specificity. Nucleic Acids Res. 5: 3157–3170 [DOI] [PMC free article] [PubMed] [Google Scholar]
- Guo A.Y., He K., Liu D., Bai S.N., Gu X.C., Wei L.P., Luo J.C. (2005). DATF: A database of Arabidopsis transcription factors. Bioinformatics 21: 2568–2569 [DOI] [PubMed] [Google Scholar]
- Ha M., Ng D.W.K., Li W.H., Chen Z.J. (2011). Coordinated histone modifications are associated with gene expression variation within and between species. Genome Res. 21: 590–598 [DOI] [PMC free article] [PubMed] [Google Scholar]
- Hesselberth J.R., Chen X.Y., Zhang Z.H., Sabo P.J., Sandstrom R., Reynolds A.P., Thurman R.E., Neph S., Kuehn M.S., Noble W.S., Fields S., Stamatoyannopoulos J.A. (2009). Global mapping of protein-DNA interactions in vivo by digital genomic footprinting. Nat. Methods 6: 283–289 [DOI] [PMC free article] [PubMed] [Google Scholar]
- Jiao Y.L., et al. (2009). A transcriptome atlas of rice cell types uncovers cellular, functional and developmental hierarchies. Nat. Genet. 41: 258–263 [DOI] [PubMed] [Google Scholar]
- John S., Sabo P.J., Thurman R.E., Sung M.-H., Biddie S.C., Johnson T.A., Hager G.L., Stamatoyannopoulos J.A. (2011). Chromatin accessibility pre-determines glucocorticoid receptor binding patterns. Nat. Genet. 43: 264–268 [DOI] [PMC free article] [PubMed] [Google Scholar]
- Kaufmann K., Muiño J.M., Jauregui R., Airoldi C.A., Smaczniak C., Krajewski P., Angenent G.C. (2009). Target genes of the MADS transcription factor SEPALLATA3: Integration of developmental and hormonal pathways in the Arabidopsis flower. PLoS Biol. 7: e1000090. [DOI] [PMC free article] [PubMed] [Google Scholar]
- Kaufmann K., Wellmer F., Muiño J.M., Ferrier T., Wuest S.E., Kumar V., Serrano-Mislata A., Madueño F., Krajewski P., Meyerowitz E.M., Angenent G.C., Riechmann J.L. (2010). Orchestration of floral initiation by APETALA1. Science 328: 85–89 [DOI] [PubMed] [Google Scholar]
- Kodama Y., Nagaya S., Shinmyo A., Kato K. (2007). Mapping and characterization of DNase I hypersensitive sites in Arabidopsis chromatin. Plant Cell Physiol. 48: 459–470 [DOI] [PubMed] [Google Scholar]
- Langmead B., Trapnell C., Pop M., Salzberg S.L. (2009). Ultrafast and memory-efficient alignment of short DNA sequences to the human genome. Genome Biol. 10: R25. [DOI] [PMC free article] [PubMed] [Google Scholar]
- Lee J., He K., Stolc V., Lee H., Figueroa P., Gao Y., Tongprasit W., Zhao H.Y., Lee I., Deng X.W. (2007). Analysis of transcription factor HY5 genomic binding sites revealed its hierarchical role in light regulation of development. Plant Cell 19: 731–749 [DOI] [PMC free article] [PubMed] [Google Scholar]
- Li X.Y., Thomas S., Sabo P.J., Eisen M.B., Stamatoyannopoulos J.A., Biggin M.D. (2011). The role of chromatin accessibility in directing the widespread, overlapping patterns of Drosophila transcription factor binding. Genome Biol. 12: R34. [DOI] [PMC free article] [PubMed] [Google Scholar]
- Liljegren S.J., Gustafson-Brown C., Pinyopich A., Ditta G.S., Yanofsky M.F. (1999). Interactions among APETALA1, LEAFY, and TERMINAL FLOWER1 specify meristem fate. Plant Cell 11: 1007–1018 [DOI] [PMC free article] [PubMed] [Google Scholar]
- Lippman Z., et al. (2004). Role of transposable elements in heterochromatin and epigenetic control. Nature 430: 471–476 [DOI] [PubMed] [Google Scholar]
- Lister R., O’Malley R.C., Tonti-Filippini J., Gregory B.D., Berry C.C., Millar A.H., Ecker J.R. (2008). Highly integrated single-base resolution maps of the epigenome in Arabidopsis. Cell 133: 523–536 [DOI] [PMC free article] [PubMed] [Google Scholar]
- Machanick P., Bailey T.L. (2011). MEME-ChIP: Motif analysis of large DNA datasets. Bioinformatics 27: 1696–1697 [DOI] [PMC free article] [PubMed] [Google Scholar]
- Mandel M.A., Gustafson-Brown C., Savidge B., Yanofsky M.F. (1992). Molecular characterization of the Arabidopsis floral homeotic gene APETALA1. Nature 360: 273–277 [DOI] [PubMed] [Google Scholar]
- Monfared M.M., Simon M.K., Meister R.J., Roig-Villanova I., Kooiker M., Colombo L., Fletcher J.C., Gasser C.S. (2011). Overlapping and antagonistic activities of BASIC PENTACYSTEINE genes affect a range of developmental processes in Arabidopsis. Plant J. 66: 1020–1031 [DOI] [PubMed] [Google Scholar]
- Morohashi K., Grotewold E. (2009). A systems approach reveals regulatory circuitry for Arabidopsis trichome initiation by the GL3 and GL1 selectors. PLoS Genet. 5: e1000396. [DOI] [PMC free article] [PubMed] [Google Scholar]
- Moyroud E., Minguet E.G., Ott F., Yant L., Posé D., Monniaux M., Blanchet S., Bastien O., Thévenon E., Weigel D., Schmid M., Parcy F. (2011). Prediction of regulatory interactions from genome sequences using a biophysical model for the Arabidopsis LEAFY transcription factor. Plant Cell 23: 1293–1306 [DOI] [PMC free article] [PubMed] [Google Scholar]
- Nakazono M., Qiu F., Borsuk L.A., Schnable P.S. (2003). Laser-capture microdissection, a tool for the global analysis of gene expression in specific plant cell types: Identification of genes expressed differentially in epidermal cells or vascular tissues of maize. Plant Cell 15: 583–596 [DOI] [PMC free article] [PubMed] [Google Scholar]
- Oh E., Kang H., Yamaguchi S., Park J., Lee D., Kamiya Y., Choi G. (2009). Genome-wide analysis of genes targeted by PHYTOCHROME INTERACTING FACTOR 3-LIKE5 during seed germination in Arabidopsis. Plant Cell 21: 403–419 [DOI] [PMC free article] [PubMed] [Google Scholar]
- Ouyang X.H., et al. (2011). Genome-wide binding site analysis of FAR-RED ELONGATED HYPOCOTYL3 reveals its novel function in Arabidopsis development. Plant Cell 23: 2514–2535 [DOI] [PMC free article] [PubMed] [Google Scholar]
- Pelaz S., Ditta G.S., Baumann E., Wisman E., Yanofsky M.F. (2000). B and C floral organ identity functions require SEPALLATA MADS-box genes. Nature 405: 200–203 [DOI] [PubMed] [Google Scholar]
- Pique-Regi R., Degner J.F., Pai A.A., Gaffney D.J., Gilad Y., Pritchard J.K. (2011). Accurate inference of transcription factor binding from DNA sequence and chromatin accessibility data. Genome Res. 21: 447–455 [DOI] [PMC free article] [PubMed] [Google Scholar]
- Riechmann J.L., Krizek B.A., Meyerowitz E.M. (1996). Dimerization specificity of Arabidopsis MADS domain homeotic proteins APETALA1, APETALA3, PISTILLATA, and AGAMOUS. Proc. Natl. Acad. Sci. USA 93: 4793–4798 [DOI] [PMC free article] [PubMed] [Google Scholar]
- Roudier F., et al. (2011). Integrative epigenomic mapping defines four main chromatin states in Arabidopsis. EMBO J. 30: 1928–1938 [DOI] [PMC free article] [PubMed] [Google Scholar]
- Sakai H., Medrano L.J., Meyerowitz E.M. (1995). Role of SUPERMAN in maintaining Arabidopsis floral whorl boundaries. Nature 378: 199–203 [DOI] [PubMed] [Google Scholar]
- Shinozaki K., Yamaguchi-Shinozaki K. (2000). Molecular responses to dehydration and low temperature: Differences and cross-talk between two stress signaling pathways. Curr. Opin. Plant Biol. 3: 217–223 [PubMed] [Google Scholar]
- Song L.Y., et al. (2011). Open chromatin defined by DNaseI and FAIRE identifies regulatory elements that shape cell-type identity. Genome Res. 21: 1757–1767 [DOI] [PMC free article] [PubMed] [Google Scholar]
- Swarbreck D., et al. (2008). The Arabidopsis Information Resource (TAIR): Gene structure and function annotation. Nucleic Acids Res. 36: D1009–D1014 [DOI] [PMC free article] [PubMed] [Google Scholar]
- Thibaud-Nissen F., Wu H., Richmond T., Redman J.C., Johnson C., Green R., Arias J., Town C.D. (2006). Development of Arabidopsis whole-genome microarrays and their application to the discovery of binding sites for the TGA2 transcription factor in salicylic acid-treated plants. Plant J. 47: 152–162 [DOI] [PubMed] [Google Scholar]
- Tittel-Elmer M., Bucher E., Broger L., Mathieu O., Paszkowski J., Vaillant I. (2010). Stress-induced activation of heterochromatic transcription. PLoS Genet. 6: e1001175. [DOI] [PMC free article] [PubMed] [Google Scholar]
- Trapnell C., Pachter L., Salzberg S.L. (2009). TopHat: Discovering splice junctions with RNA-seq. Bioinformatics 25: 1105–1111 [DOI] [PMC free article] [PubMed] [Google Scholar]
- Trapnell C., Williams B.A., Pertea G., Mortazavi A., Kwan G., van Baren M.J., Salzberg S.L., Wold B.J., Pachter L. (2010). Transcript assembly and quantification by RNA-seq reveals unannotated transcripts and isoform switching during cell differentiation. Nat. Biotechnol. 28: 511–515 [DOI] [PMC free article] [PubMed] [Google Scholar]
- Tsukahara S., Kobayashi A., Kawabe A., Mathieu O., Miura A., Kakutani T. (2009). Bursts of retrotransposition reproduced in Arabidopsis. Nature 461: 423–426 [DOI] [PubMed] [Google Scholar]
- Vandenbussche M., Zethof J., Souer E., Koes R., Tornielli G.B., Pezzotti M., Ferrario S., Angenent G.C., Gerats T. (2003). Toward the analysis of the petunia MADS box gene family by reverse and forward transposon insertion mutagenesis approaches: B, C, and D floral organ identity functions require SEPALLATA-like MADS box genes in petunia. Plant Cell 15: 2680–2693 [DOI] [PMC free article] [PubMed] [Google Scholar]
- Waki H., et al. (2011). Global mapping of cell type-specific open chromatin by FAIRE-seq reveals the regulatory role of the NFI family in adipocyte differentiation. PLoS Genet. 7: e1002311. [DOI] [PMC free article] [PubMed] [Google Scholar]
- Wang Z.Y., Kenigsbuch D., Sun L., Harel E., Ong M.S., Tobin E.M. (1997). A Myb-related transcription factor is involved in the phytochrome regulation of an Arabidopsis Lhcb gene. Plant Cell 9: 491–507 [DOI] [PMC free article] [PubMed] [Google Scholar]
- Wilson M.D., Odom D.T. (2009). Evolution of transcriptional control in mammals. Curr. Opin. Genet. Dev. 19: 579–585 [DOI] [PubMed] [Google Scholar]
- Yant L., Mathieu J., Dinh T.T., Ott F., Lanz C., Wollmann H., Chen X.M., Schmid M. (2010). Orchestration of the floral transition and floral development in Arabidopsis by the bifunctional transcription factor APETALA2. Plant Cell 22: 2156–2170 [DOI] [PMC free article] [PubMed] [Google Scholar]
- Yilmaz A., Mejia-Guerra M.K., Kurz K., Liang X.Y., Welch L., Grotewold E. (2011). AGRIS: The Arabidopsis gene regulatory information server, an update. Nucleic Acids Res. 39: D1118–D1122 [DOI] [PMC free article] [PubMed] [Google Scholar]
- Zhang W.L., Wu Y.F., Schnable J.C., Zeng Z.X., Freeling M., Crawford G.E., Jiang J.M. (2012). High-resolution mapping of open chromatin in the rice genome. Genome Res. 22: 151–162 [DOI] [PMC free article] [PubMed] [Google Scholar]
- Zhang X.Y., Yazaki J., Sundaresan A., Cokus S., Chan S.W.L., Chen H.M., Henderson I.R., Shinn P., Pellegrini M., Jacobsen S.E., Ecker J.R. (2006). Genome-wide high-resolution mapping and functional analysis of DNA methylation in Arabidopsis. Cell 126: 1189–1201 [DOI] [PubMed] [Google Scholar]
- Zheng Y.M., Ren N., Wang H., Stromberg A.J., Perry S.E. (2009). Global identification of targets of the Arabidopsis MADS domain protein AGAMOUS-Like15. Plant Cell 21: 2563–2577 [DOI] [PMC free article] [PubMed] [Google Scholar]
- Zilberman D., Gehring M., Tran R.K., Ballinger T., Henikoff S. (2007). Genome-wide analysis of Arabidopsis thaliana DNA methylation uncovers an interdependence between methylation and transcription. Nat. Genet. 39: 61–69 [DOI] [PubMed] [Google Scholar]
Associated Data
This section collects any data citations, data availability statements, or supplementary materials included in this article.


