Abstract
The aerosol bolus technique can be used to estimate the degree of convective mixing in the lung; however, contributions of different lung compartments to measured dispersion cannot be differentiated unambiguously. To estimate dispersion in the distal lung, we studied the effect of gravity and airway asymmetry on the dispersion of 1 μm-diameter particle boluses in three-dimensional computational models of the lung periphery, ranging from a single alveolar sac to four-generation (g4) structures of bifurcating airways that deformed homogeneously during breathing. Boluses were introduced at the beginning of a 2-s inhalation, immediately followed by a 3-s exhalation. Dispersion was estimated by the half-width of the exhaled bolus. Dispersion was significantly affected by the spatial orientation of the models in normal gravity and was less in zero gravity than in normal gravity. Dispersion was strongly correlated with model volume in both normal and zero gravity. Predicted pulmonary dispersion based on a symmetric g4 acinar model was 391 ml and 238 ml under normal and zero gravity, respectively. These results accounted for a significant amount of dispersion measured experimentally. In zero gravity, predicted dispersion in a highly asymmetric model accounted for ∼20% of that obtained in a symmetric model with comparable volume and number of alveolated branches, whereas normal gravity dispersions were comparable in both models. These results suggest that gravitational sedimentation and not geometrical asymmetry is the dominant factor in aerosol dispersion in the lung periphery.
Keywords: pulmonary fluid dynamics, particle transport, computational modeling
the aerosol bolus technique has been used for decades to estimate the degree of convective mixing in the lung (14, 20, 22, 32, 33). Tests consist of inhaling an aerosol bolus at a constant flow rate and analyzing the concentration of particles at the mouth during the following exhalation as a function of expired volume. The extent of dispersion undergone by the particles during their transport in the lung can then be inferred from both the change in shape and the increase in the width of the bolus between inspiration and expiration. It has been shown that aerosol bolus dispersion is a sensitive measure of changes in lung morphology and function (1, 32, 33) and can detect structural changes in both proximal and peripheral lung regions (32, 33). Studies in altered gravity have also shown that aerosol bolus dispersion increases with increasing gravity level (5, 7, 9, 10).
Aerosol bolus dispersion results from local mixing processes occurring throughout the lungs. To interpret changes in aerosol dispersion from alteration in ventilation or alterations in lung geometries or with disease progression, it is necessary to understand the contributions of various compartments of the lung (e.g., upper airway, conducting airways, and acinar airways) to overall dispersion. Since direct in vivo experimental measurements are either unrealistic or subject to substantial uncertainty, experiments have been performed in physical models of bronchial airways (20, 21, 24, 28–30). Computational models have also provided insight in aerosol dispersion mechanisms. Data on aerosol dispersion in upper airway and in acinar airways are rare, with the exception of Jayaraju et al. (15), who measured and simulated the dispersion of inhaled aerosol boluses in a model of a rigid upper airway, and Darquenne and Prisk (8), who simulated aerosol bolus dispersion in rigid two-dimensional (2D) models of acinar airways. In summary, current knowledge on aerosol dispersion in the respiratory tract is mostly restricted to the whole lung level, and very limited data are available on dispersion in upper airway, tracheobronchial airways, and acinar airways. The simulated dispersion data based on 2D rigid models (8) include some of the few direct indications of how the contribution of acinar dispersion to total dispersion can be estimated. However, aerosol dispersion predicted from these previous 2D models only accounted for <50% of experimental measurements (9, 10). Such underestimation was attributed to the fact that these models did not incorporate the rhythmical expansion and contraction of the alveolar spaces that accompany each breath.
Recently, we have developed 3D alveolated airway models of the two most distal generations of human lung to predict aerosol deposition during tidal breathing where model volume varied as a sinusoidal function of time, and the shape of the model remained self-similar during breathing (16). These 3D computational models that incorporate wall motion during breathing are amongst the most comprehensive models of the acinar region available to date. The purpose of the current study was to obtain a more realistic estimation of the contribution of the distal lung compartment to overall dispersion in the lung by simulating aerosol bolus dispersion in five acinar airway models created using our previously developed method. As in our previous study, the model shape remains self-similar during breathing but model volume varied as a linear function of time so that breathing flow rate remained constant. Aerosol dispersion induced by these acinar models and the correlations between dispersion and volume in both zero and normal gravity were obtained. The influence of acinar airway asymmetry on aerosol bolus dispersion was also estimated.
METHODS
Creation of acinar models.
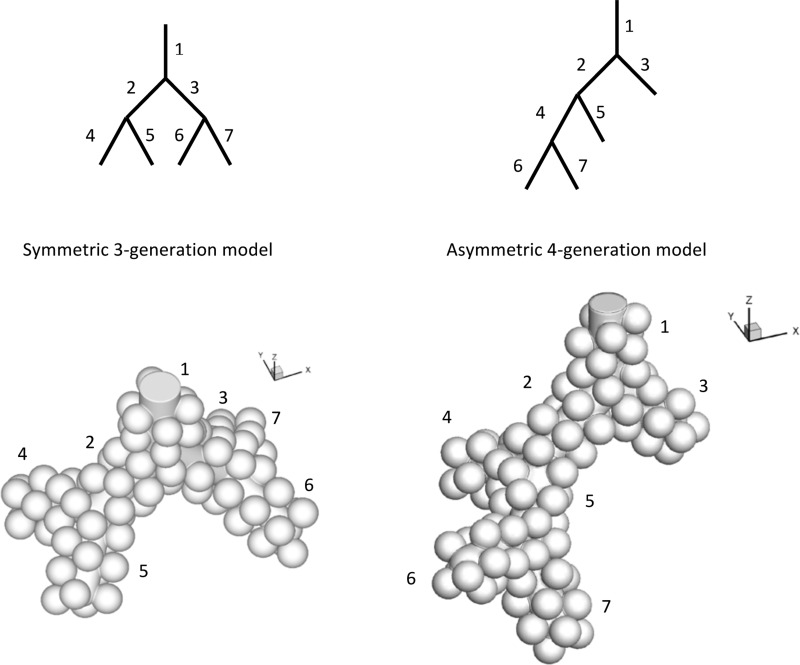
In a previous study (16), we designed a method to create 3D alveolated airways with multiple bifurcations. Briefly, alveoli had a shape similar to a three-fourth spheroid and were created by union of spheres and models of inner lumen (cylinder or truncated cone) representing the alveolar duct lumen. The overall alveoli-to-duct volume ratio was close to that estimated based on morphometry (11). With the use of this method, symmetric bifurcating models of distal acinar airways were created and ranged from a single alveolar sac one-generation model (g1) to the last four generations of acinar airways (g2–g4). To estimate the influence of asymmetry on dispersion, a four-generation asymmetric (g4-asym) acinar model was also developed by rearranging the branches of the symmetric g3 model (Fig. 1). The g4-asym had the same number of branches (seven in total) and approximately the same volume as the g3 model (asymmetric-to-symmetric model volume ratio is 0.96). There was only one opening at the proximal side of all models. These models are referred to as g1 (alveolar sac), g2, g3, g4, and g4-asym, respectively.
Fig. 1.
Comparison of a symmetric 3-generation model (g3; left) and an asymmetric 4-generation model (g4-asym; right). Both models have comparable lumen size and identical alveolar size. The top schematic was drawn 2 dimensionally (2D) and showed the relative positions of different branches (identified by numbers). The bottom panels showed the 3D shaded view (not to scale) of the models. The angles between successive bifurcation planes and the bifurcation angles are both 90°.
The volume of the models was representative of a total lung volume of 3 liter, i.e., representative of functional residual capacity (FRC), and the model parameters were similar to those used in our previous study (16). The angles between successive bifurcation planes and the bifurcation angles were all 90°, and the diameter of the spheres used to create the alveoli was 200 μm for all models. The alveolar sac model (g1) and the g2 bifurcation model were the same as used in the previous study. The dimensions of the alveolar sac model were: lumen diameter = 206 μm, outer profile diameter = 538 μm, and total length = 832 μm. For the bifurcation model, outer profile diameter = 575 μm, length = 600 μm, and lumen diameter varies linearly from 206 μm at the bifurcation to 266 μm at the proximal opening end. The g3 and g4 models were created by union of lower-order models. For example, union of one duct model and two bifurcation models resulted in a g3 model, and union of one duct and two g3 models resulted in a g4 model. Branches in the g3 and g4 models, other than those mentioned above (in alveolar sac and terminal bifurcation), have the same dimension: outer profile diameter = 575 μm, length = 600 μm, and lumen diameter = 266 μm. For the g4-asym model, all inner lumen diameters (including the alveolar sac and ducts) = 236 μm (average of 206 μm for alveolar sac and 266 μm for alveolar duct), and all outer profile diameters = 538 μm. The four alveolar sacs (branches 3, 5, 6, and 7 in Fig. 1) have total outer profile length = 832 μm, and the three alveolar ducts (branches 1, 2, and 4 in Fig. 1) have length = 600 μm. The characteristics of each acinar model are summarized in Table 1.
Table 1.
Characteristics and computed dispersion in 5 acinar models
| Model | g1 | g2 | g3 | g4 | g4-asym |
|---|---|---|---|---|---|
| Number of alveoli | 17 | 43 | 97 | 208 | 93 |
| Entrance lumen diameter (mm) | 0.206 | 0.266 | 0.266 | 0.266 | 0.236 |
| Reynolds number at entrance | 0.006 | 0.012 | 0.027 | 0.057 | 0.029 |
| Volume at FRC (mm3) | 0.089 | 0.234 | 0.537 | 1.147 | 0.518 |
| Dispersion in normal gravity (mm3) | 0.0042 | 0.0279 | 0.0837 | 0.1576 | 0.0853 |
| Dispersion in 0 gravity (mm3) | 0.0029 | 0.0047 | 0.0196 | 0.0964 | 0.0042 |
gn, symmetric model with n generation (n = 1, 2, 3, 4); g4-asym, asymmetric 4-generation model; FRC, functional residual capacity.
Simulation of bolus dispersion in normal and zero gravity.
The acinar models were assumed to deform homogeneously (i.e., geometrically similar) with breathing, creating airflow through the model inlet. An aerosol bolus released at the model inlet will follow the air flow and disperse as it goes in and out of the model. As commonly used in aerosol bolus experiments (2, 9, 10, 14), a constant flow rate was assumed so that the model volume varied as a linear function of time. A 3-s exhalation immediately followed a 2-s inhalation with no pause in between. The duration of expiration was longer than that of inspiration to allow most of the airborne particles to exit the models. Starting from FRC, the maximum volume at the end of inhalation was 133% of that at FRC. This corresponds to a mouth flow rate of 500 ml/s and a 2-s inspiration at a FRC of 3 liters. Inert, spherical 1 μm particles (density = 1,000 kg/m3) were released (with zero velocity) at the model inlet at each time step (Δt = 0.01 s) between 0.1 and 0.15 s in the inspiration phase. Thus the initial aerosol bolus injected at the model inlet has a width of 0.05 s on the concentration vs. time curve. The total number of tracked particles varied from 2,976 to 11,292 in the models. Sensitivity studies showed that the results did not change significantly when more particles were used in the simulations. The total number of tracked particles for the g3 model (11,292) was comparable with that for the g4-asym model (10,260). Simulations were performed in the five acinar models in both zero and normal gravity.
The shape and position of the bolus in exhaled air are affected by the orientation of the structure with respect to the gravity vector (8). Acinar structures could have random orientations in 3D space. Therefore, to estimate the average dispersion in normal gravity for a given model, a weighted-average concentration curve at the model outlet as a function of time was needed. The same averaging method as in our previous study (16) was used, with the difference that the concentration of the aerosol particle in the exhaled bolus (not aerosol deposition) was the averaging quantity in the current study. This method considers the orientation of the normal vector at the model outlet in 3D space compared with the gravity direction. In the current study, the outlet normal vector of all models was always in the positive z (pz)-axis direction in 3D space, and the most proximal bifurcation was always set in the x–z axis plane. A total of six orientations of the gravity vector [pz, negative z (nz), positive y (py), negative y, positive x (px), and negative x] provided a minimum set of orientations for estimating the average dispersion or deposition for a model randomly orientated in 3D space. For the g4-asym model, all six model orientations were considered. Due to symmetry, only four independent orientations (pz, nz, py, and px) need to be considered for all symmetric bifurcation models (g2, g3, and g4; see Fig. 1). Let Cpx refers to concentration (as a function of time) at the model outlet when the gravity vector is in the px direction and similarly for other directions (pz, nz, and py). The average concentration (Cavg) was then computed as
| (1) |
For an alveolar sac (g1), only three independent orientations (pz, nz, and py) need to be considered. The average concentration was computed as
| (2) |
Computational fluid dynamics simulation parameters and grid sensitivity study.
Commercial computational fluid dynamics software (Fluent, version 6.3.26; Ansys, Canonsburg, PA) was used to simulate air flow and aerosol particle transport. The discrete-phase model capability of the software was used to adopt a Lagrangian particle-tracking algorithm. The moving grid feature in the software was used to deform the grid during breathing. The solution details, including equations solved, can be found in previous publications (16–18). The discretization algorithms were second order in accuracy, and the Pressure Implicit with Splitting of Operators algorithm was used for pressure-velocity coupling. The maximum residuals for continuity and momentum equations were set to be 10−5, and the maximum number of iterations at each time step was set to 100. A constant time step of 0.01 s was used. As reported previously (16), using smaller time-step sizes did not result in significant differences in computed aerosol dispersion or deposition. The homogeneous wall motion during breathing was incorporated as a user-defined function in the software.
Hybrid volume meshes that are composed primarily of tetrahedral mesh elements were created in Gambit (version 2.4.6; Ansys). For each model, at least two to three successively larger (approximately double in size) grid sizes (measured by the total number of volume cells) were considered for the case when gravity was in the pz axis direction, and computed dispersions were compared. The computed half-width (described below) differed by no more than 2%, 6%, 10%, 8%, and 9% for g1, g2, g3, g4, and g4-asym models, respectively. The final grid sizes used were approximately 277 K, 320 K, 423 K, 703 K, and 479 K (K = 1,000) cells for the above models, respectively.
Measure of dispersion.
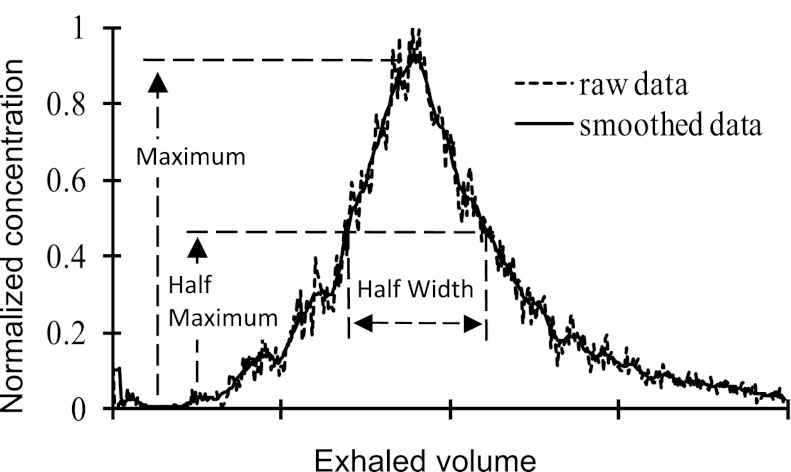
The aerosol dispersion was quantified by using changes in half-width (H) on the particle concentration vs. respired volume curve measured at the model outlet. The original concentration vs. respired volume curve was smoothed by using a generalized moving average filter (Savitzky-Golay filter with a span of 11 and order one) in Matlab (version 6.5; MathWorks, Natick, MA). Based on the smoothed data, the maximum and half-maximum points were found, from which the half-width (width at half-maximum concentration) was obtained (Fig. 2). Dispersion H in the model was defined as
| (3) |
where Hin and Hex are the one-half width of the inspired and expired bolus, respectively. Since the injected aerosol bolus had a width of 0.05 s, and volume increased by 33% in 2 s, Hin can be computed as
| (4) |
where Vmodel is the volume of the acinar model at FRC.
Fig. 2.
Typical particle concentration profile at a model outlet during exhalation. The definition of half-width is also shown.
RESULTS
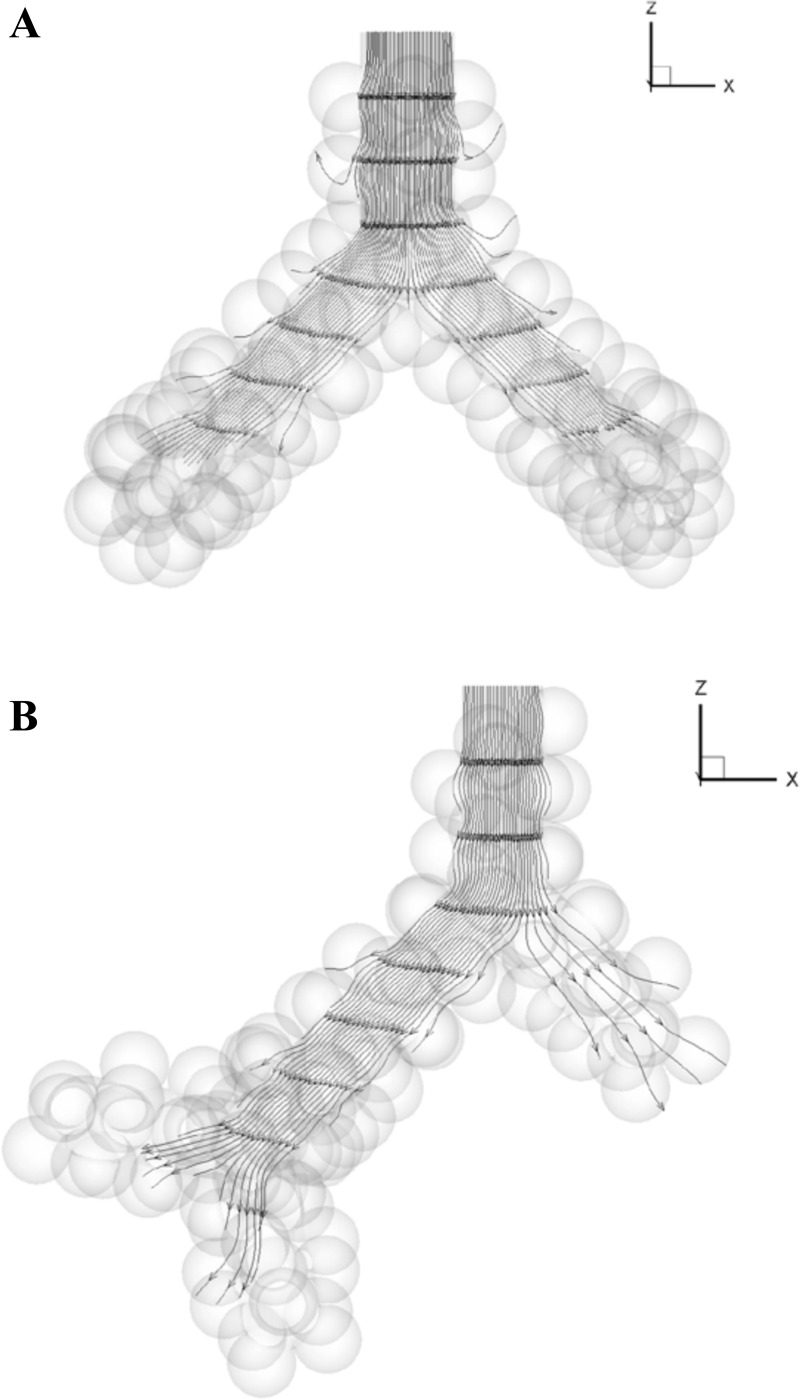
The Reynolds numbers at the entrance of the acinar models (Table 1) were much less than one, showing that quasistatic flow is the dominant feature in these models. Streamlines at selected time points (middle of inhalation, end of inhalation, immediate start of exhalation, and middle of exhalation) showed no flow recirculation for both symmetric and asymmetric models (see Fig. 3). No separation of streamline at the alveolar edge was observed.
Fig. 3.
Streamlines at the end of inhalation in the (A) g3 and (B) g4-asym model in zero gravity. All streamlines pass through a straight line in plane Y = 0 at the entrance of the models. The model sizes are not to scale.
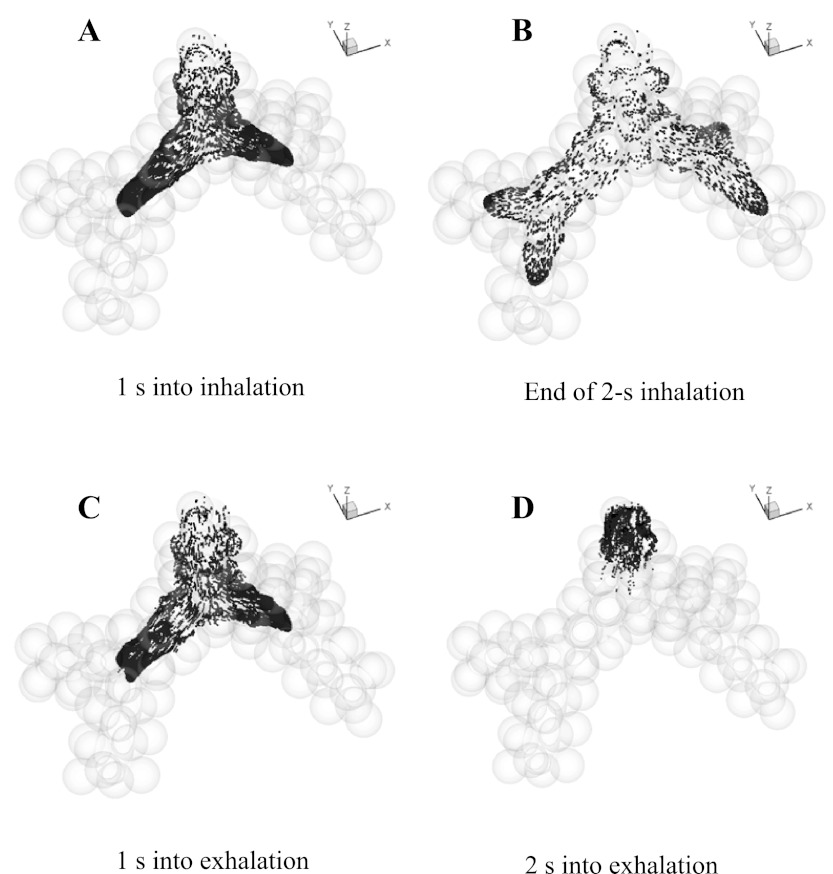
Under normal gravity, depending on the model used and its spatial orientation, ∼46–53% of particles escaped the model at the end of exhalation, ∼39–49% of particles deposited on the walls, and ∼5–8% of particles remained in suspension in the model. As expected based on flow distribution, in both normal and zero gravity, particles were approximately symmetrically distributed after each bifurcation of the symmetric models (e.g., Fig. 4), and asymmetrically distributed after the two asymmetric bifurcations in the g4-asym model (e.g., Fig. 5).
Fig. 4.
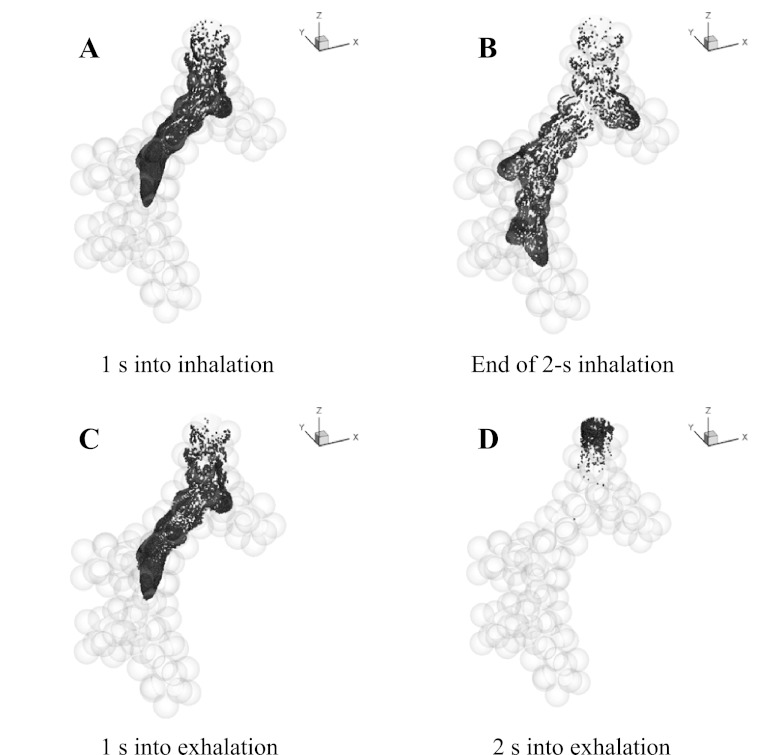
Location of the aerosol bolus during inhalation and exhalation in the g3 in 0 gravity. The model ends with a generation of alveolar sacs and includes a total of 97 alveoli.
Fig. 5.
Location of the aerosol bolus during inhalation and exhalation in the g4-asym model in zero gravity. The model ends with a generation of alveolar sacs and includes a total of 93 alveoli.
Particle distribution in zero gravity.
The particle distribution during inhalation and exhalation for the g3 model (Fig. 4) and the g4-asym model (Fig. 5) was compared for simulations performed in zero gravity. In the g3 model, at mid-inspiration, particles reached the junction of the second bifurcation (Fig. 4A). By the end of inhalation, particles had traveled deeper in the peripheral direction and into the alveolar cavities, with the distal front of the aerosol bolus reaching well within the alveolar sacs (Fig. 4B). One second into exhalation, the bolus retraced back to about the same axial position as that at mid-inspiration (Fig. 4A), although the cross-sectional concentration profile was more complex, and some particles reached deeper in alveolar cavities (Fig. 4C). After 2-s exhalation, some particles still remained in the model close to the entrance and occupied an axial length of approximatey one to two alveoli wide (Fig. 4D). These remaining particles were located on the periphery of the inlet section during inhalation and traveled slower than those in the center of the lumen. This clearly showed the existence of dispersion, since by this time, the bolus would have been out of the model if all particle paths were perfectly reversible. After 3-s exhalation, no more than 0.2% of particles remained in suspension in the model, whereas others either deposited or escaped. During both inhalation and exhalation, particle distributions were approximately symmetric after each bifurcation as expected.
For the g4-asym model in zero gravity, the most significant feature of the particle distribution was asymmetry after each bifurcation. At mid-inspiration, the bolus front passed two bifurcations, and at each bifurcation, particle penetration into the alveolar sacs was not significant (Fig. 5A). At the end of inhalation, particles penetrated to approximately two-thirds of the proximal alveolar sac (branch 3 in Fig. 1) and to one-half of the other alveolar sacs (branches 5–7 in Fig. 1). One second into exhalation, the particle front retraced back to about the same positions as that at mid-inspiration (Fig. 5, C vs. A). After 2 s of exhalation, some particles still remained in the model close to the entrance (Fig. 5D), similar to transport in the symmetric model. At the end of exhalation, no more than 0.6% of particles remained in suspension in the model, whereas all others either deposited in the model or escaped.
Dispersion in normal gravity and effect of asymmetry.
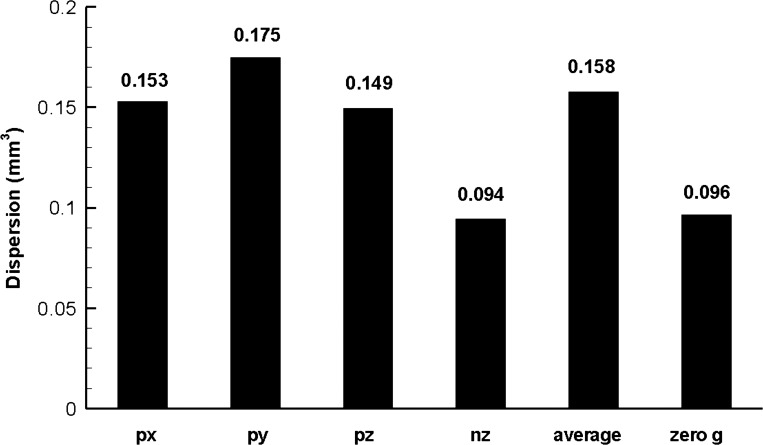
Dispersion in the acinar models was significantly dependent on gravity. For the g4 model, the dispersion was as low as 0.094 mm3 for gravity direction in the nz axis direction or as high as 0.175 mm3 for gravity direction in the py axis direction (Fig. 6). Dispersion in zero gravity was close to the minimal dispersion in normal gravity and ∼61% of the average value.
Fig. 6.
Dispersion in the symmetric 4-generation model (g4) under normal and zero gravity conditions. px, py, pz, nz = gravity in positive x-, y-, z-, and negative z-axis direction, respectively; average = dispersion computed by using weighted-average concentration vs. volume curve; zero g = zero gravity (see text for details).
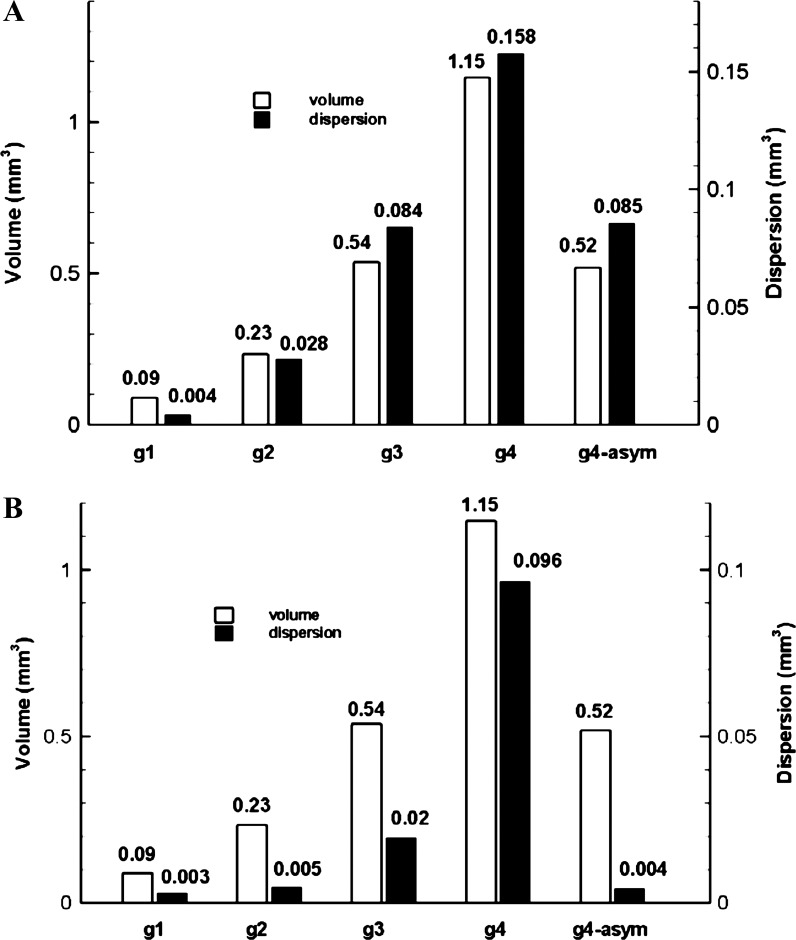
Average dispersion in the acinar models in normal gravity is shown in Fig. 7A. From the alveolar sac (g1) to the g4 model, the average dispersion increased significantly. The ratios of dispersion among models were g2/g1 = 6.7, g3/g2 = 3.0, and g4/g3 = 1.9, and the ratios of model volumes were g2/g1 = 2.6, g3/g2 = 2.3, and g4/g3 = 2.1. The increase in dispersion was more than twice the increase in volume between the alveolar sac and the g2 model, whereas from g2 to g4, the increase in dispersion was becoming more comparable with the increase in volume. The Pearson's correlation coefficient between dispersion and model volume for these symmetric models is 0.99 under normal gravity, suggesting a very strong correlation between model volume and particle dispersion. Averaged dispersion in the g4-asym model was comparable with that in the g3 model (with similar volume).
Fig. 7.
Comparison of model volume and average dispersion in normal gravity (A) and zero gravity (B) for symmetric and asymmetric models. g1 and g2 = symmetric 1- and 2-generation model.
Dispersion in zero gravity and effect of asymmetry.
Under zero gravity, dispersion was smaller than under normal gravity, especially for models g2 and g3. The ratios to average dispersion under normal gravity were 0.69, 0.17, 0.23, and 0.61 for models g1, g2, g3, and g4, respectively. For these symmetric models, dispersion in zero gravity correlated strongly with model volume (Pearson's correlation coefficient is 0.97), as in normal gravity. Dispersion in the g4-asym model (0.004 mm3) was only ∼20% of that in the g3 model (0.02 mm3), despite a comparable model volume and identical number of alveolated branches between the two models (Table 1 and Fig. 7B).
For the g4-asym model, massless particles were also tracked, in addition to 1 μm aerosol particles. For the massless particles, no dispersion could be detected after the breathing maneuver (2-s inhalation, 3-s exhalation).
Estimation of dispersion in the pulmonary region of the lung.
Due to the strong correlation between particle dispersion and model volume in both normal and zero gravity (Fig. 7), dispersion in the whole pulmonary region of the lung was estimated based on the models developed in this study. The deformation history of the acinar model walls (33% increase in volume in 2 s) corresponds to a mouth flow rate of 500 ml/s and a volume penetration of 1,000 ml in 2 s for a total initial lung volume of 3,000 ml. If the observed correlation between dispersion and volume holds true throughout the whole pulmonary region, then the following simple proportional relation exists
| (5) |
Assuming a conducting airway volume of 150 ml, then volume in the pulmonary region = 3,000 − 150 = 2,850 ml. For the symmetric model g4, model volume = 1.15 mm3, and dispersion = 0.158 mm3 and 0.096 mm3 in normal and zero gravity, respectively. The estimated total pulmonary dispersion = 391 ml and 238 ml under normal and zero gravity, respectively. For the asymmetric model g4-asym, model volume = 0.52 mm3, and dispersion = 0.0853 mm3 and 0.004 mm3 under normal and zero gravity, respectively. Estimated total pulmonary dispersion = 468 ml and 22 ml under normal and zero gravity, respectively. Based on the symmetric g3 model, the estimated total pulmonary dispersion = 444 ml and 104 ml under normal and zero gravity, respectively.
DISCUSSION
The aerosol bolus technique has been shown to be a valuable tool for detecting lung diseases (1, 32, 33) and for estimating airway morphometry (1). However, data obtained in human subjects are often global measures over the whole lung, and contributions from different compartments cannot be identified easily. This lack of specificity or inability to distinguish changes in different compartments or regions of the lung is probably one of the main reasons why this technique has not been widely used clinically. Even for the normal lung, such analysis is still incomplete. Our current study aims at filling this gap and investigating factors affecting aerosol dispersion in the pulmonary (acinar) compartment during steady breathing in the normal lung. Based on advanced computational tools and anatomically based deformable acinar airway models, we have obtained estimations of pulmonary dispersion that may be compared with indirect estimations from experiments.
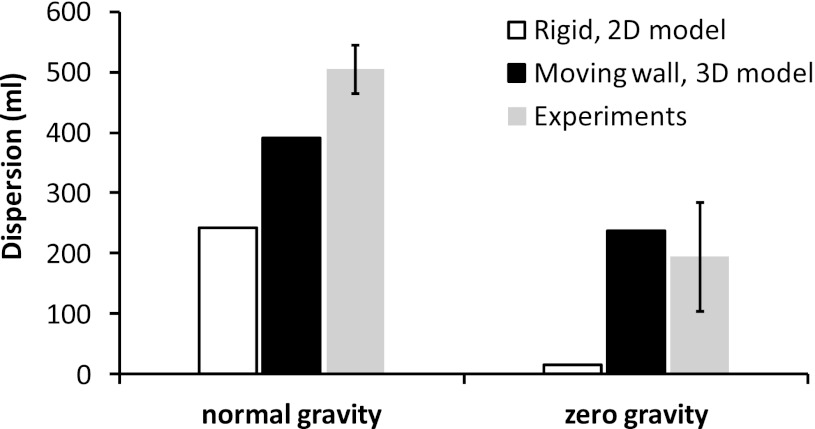
We compared dispersion predicted in our models with experimental data obtained by Darquenne et al. (9, 10) in healthy human subjects under normal and zero gravity conditions. The authors measured a linear increase in dispersion with penetration volume at each gravity level. In particular, the dispersion of a 1-μm aerosol bolus in the acinar space between penetration volumes of 500 ml and 1,500 ml (i.e., when aerosols traverse an acinar volume of 1,000 ml) averaged 505 ± 40 ml in normal gravity and 195 ± 90 ml in zero gravity (9, 10). The ratio of numerical-to-experimental values of dispersion is therefore 391/505 = 0.77 and 238/195 = 1.22 in normal and zero gravity, respectively, based on the symmetric g4 model. The ratios are 468/505 = 0.93 and 22/195 = 0.11 in normal and zero gravity, respectively, for the g4-asym model and 0.88 and 0.53, respectively, for the g3 model. The numerical predictions account for most of the measured dispersion in normal gravity, whereas agreement between predictions and measured dispersion varied widely in zero gravity.
Predictions from the current simulations were also compared with data measured on healthy human subjects by Heyder et al. (14) and Brand et al. (2) in normal gravity. In the study of Heyder et al. (14), dispersion increased by ∼250 ml between penetration volumes of 200 ml and 800 ml, i.e., when aerosols traverse an acinar volume of 600 ml. According to our current estimation based on the symmetric model g4 and the experimentally observed linear increase in dispersion with increasing penetration of the aerosol in the acinar region, the corresponding dispersion for an aerosol-traversing volume of 600 ml would be 391 × 0.6 = 234 ml, and the ratio of numerical-to-experimental values of dispersion would be 0.94 (=234/250). In the study of Brand et al. (2), dispersion increased from 235 ml to 529 ml between penetration volumes of 200 ml and 800 ml. By similar calculation, the ratio of numerical-to-experimental values of dispersion is 0.80 (=234/294).
These comparisons suggest that predicted dispersion based on data from the symmetric acinar models accounts for 77–94% of averaged values from experiments in human subjects in normal gravity. In contrast, predicted dispersion in previous 2D rigid wall models (8) accounted for <50% of measured dispersion (Fig. 8). This highlighted the importance of incorporating wall motion and realistic 3D acinar models in simulating aerosol dispersion in distal airways. Indeed, the comparisons strongly suggest that in normal gravity, a significant amount of the acinar dispersion in a homogeneously ventilated lung can be reproduced by a multigenerational deforming lung model. The differences between our current simulations and experimental data are likely due to factors not considered in our current model, such as asynchronous ventilation and cardiogenic mixing.
Fig. 8.
Comparison of estimated pulmonary dispersion within penetration volume 0.5–1.5 liters based on experiments (9, 10), rigid 2D model (8), and current moving wall 3D g4 model. The error bars for the experimental data stand for 1 SD from the mean.
The estimation of total pulmonary dispersion was based on the correlation between dispersion and model volume under both normal and zero gravity conditions. This correlation shows that as more volume is available for mixing, the degree of mixing is larger, as is the irreversible processes that lead to dispersion. In the sense that dispersion increases with available volume for mixing, our results are consistent with the experimentally observed increase in dispersion with increasing penetration volume (3, 9, 10, 20, 23).
Aerosol dispersion in the lung is due to irreversible mechanisms in flow and particle motion during breathing, as shown previously (4, 13, 16, 25–27) and in the current study. The dependence of aerosol dispersion on gravity is known and has been observed in previous studies (5, 8–10). In the current simulation, nearly one-half of the injected particles was trapped on the model wall, which changed the concentration profile at the model outlet and contributed to dispersion. Gravity also affected the trajectory of an aerosol particle, contributing to irreversible particle motion and dispersion.
The comparable dispersion predicted in normal gravity in both the g3 model and the g4-asym model (Fig. 7A) strongly suggests that gravity but not geometrical asymmetry is the main factor causing dispersion in the lung periphery. In contrast, in zero gravity, geometrical asymmetry significantly affects dispersion, which in the g4-asym model, was only a fraction of that in the symmetric g3 model, although both models had comparable volume and number of alveoli (Table 1). Since there was no detectable intrinsic-flow irreversibility, as shown by tracking massless particles and by examining streamlines (Fig. 3), and since intrinsic particle Brownian motion was ignored, dispersion in zero gravity can only be attributed to inherent particle inertia. This suggests that particle inertia is still effective even in the most distal part of the lung. This may explain the difference in dispersion between symmetric and asymmetric models in zero gravity. Indeed, asymmetric models usually involve less change in particle motion direction than symmetric models; thus the effect of particle inertia is also less than in symmetric models.
The above observation is consistent with previous experimental measurements on human and dog lungs (20, 23) and a theoretical modeling study (19). Rosenthal et al. (20) indeed showed that for similar penetration volumes, dispersion of 0.8 μm aerosol was less in the monopodial dog lung than in the more symmetric human lung. As dispersion is a measure of degree of convective mixing, the higher dispersion in symmetric models indicates a higher degree of convective mixing compared with asymmetric models. Rosenthal (19) modeled the effect of nonuniform ventilation on dispersion of aerosol bolus using a two-compartment model of the lung and showed that dispersion decreased with the ratio of volume distribution in the two compartments and that dispersion was greatest when the two compartments had equal volume. Our current study suggests, however, that these differences are much less evident in normal gravity than in zero gravity, at least for 1 μm-diameter particles.
The greater increase in dispersion—compared with volume from the alveolar sac (g1) to the g2 model rather than between bifurcating structure (g2 vs. g3, g3 vs. g4)—showed the importance of bifurcating structure on aerosol dispersion. When particles from two daughter branches come close at the bifurcation, minor differences in particle concentration vs. time will induce mixing of particles, increasing dispersion. This suggested that a realistic representation of the anatomic features of acinar airways, notably the bifurcating feature, is necessary for an accurate simulation of aerosol transport in the distal lung, consistent with a previous simulation study in a rigid 3D model of acinar airways (12).
We have chosen a special case of asymmetry, in which three consecutive acinar bifurcations each contain an alveolar sac. Since the actual lung geometry is neither symmetric nor has a degree of asymmetry as extreme as our g4-asym model, a model with some minor degrees of asymmetry is likely to provide a more accurate estimation of dispersion in zero gravity. As mentioned in methods, the g4-asym acinar model was developed by rearranging the branches of the symmetric g3 model so that a volume- and branch number-matched pair could be used to compare symmetric and asymmetric models. It should also be noted that since particle Brownian motion was ignored, we were unable to accurately quantify the effect of Brownian motion compared with the effect of inertia on dispersion.
In contrast to our earlier study (16), where brief flow recirculation and irreversibility were predicted at the end of inhalation and exhalation, we did not find any detectable flow irreversibility in our current study. Both studies involved a self-similar deformable wall. However, in our earlier study, the volume of the models varied in a sinusoidal fashion (i.e., flow rate varied with time), whereas in the current study, the volume of the models varied as a linear function of time (i.e., flow rate was constant throughout a breathing cycle). This suggests that time-dependent flow might be a key factor contributing to flow irreversibility in the lung. In the experimental study of Tsuda et al. (27), significant flow irreversibility and fluid mixing were observed in rhythmically ventilated rat lungs, where the cyclic feature of the flow might have contributed to the observed flow irreversibility.
As for most modeling studies, direct experimental validation of numerical predictions is hard to obtain. It should, however, be noted that the current simulations used the same simulation techniques and parameters as in our previous studies (17, 18, 31), where a good match with experimental results was obtained. Thus the results are not likely to be affected majorly by numerical or modeling errors, and although this cannot substitute for direct experimental validation, it is reasonable to assume that reliable and accurate results have been obtained in this study.
In conclusion, our results show that gravity but not airway asymmetry is the dominant mechanism of dispersion in the lung periphery and that particle inertia also contributes to dispersion in distal units, especially in zero gravity. Our current computational modeling studies using anatomically based acinar models resulted in estimated pulmonary dispersion that accounts for a significant part of experimental measures of dispersion. These results suggest that the combination of complex acinar geometry with homogeneous acinar wall deformation can potentially explain most of the dispersion in pulmonary airways without requiring any significant heterogeneity in the lung.
GRANTS
This research was supported by a grant from the National Institute of Environmental Health Sciences (RO1 ES011177) and was supported in part by the National Science Foundation through TeraGrid resources provided by San Diego Supercomputer Center.
DISCLOSURE
No conflicts of interest, financial or otherwise, are declared by the authors.
AUTHOR CONTRIBUTIONS
Author contributions: C.D. conception and design of research; B.M. performed experiments; B.M. analyzed data; B.M. and C.D. interpreted results of experiments; B.M. prepared figures; B.M. drafted manuscript; B.M. and C.D. edited and revised manuscript; B.M. and C.D. approved final version of manuscript.
REFERENCES
- 1. Blanchard JD. Aerosol bolus dispersion and aerosol-derived airway morphometry: assessment of lung pathology and response to therapy, part 1. J Aerosol Med 9: 183–205, 1996 [DOI] [PubMed] [Google Scholar]
- 2. Brand P, Rieger C, Schulz H, Beinert T, Heyder J. Aerosol bolus dispersion in healthy subjects. Eur Respir J 10: 460–467, 1997 [DOI] [PubMed] [Google Scholar]
- 3. Brown JS, Gerrity TR, Bennett WD, Kim CS, House DE. Dispersion of aerosol boluses in the human lung: dependence on lung volume, bolus volume, and gender. J Appl Physiol 79: 1787–1795, 1995 [DOI] [PubMed] [Google Scholar]
- 4. Butler JP, Tsuda A. Effect of convective stretching and folding on aerosol mixing deep in the lung, assessed by approximate entropy. J Appl Physiol 83: 800–809, 1997 [DOI] [PubMed] [Google Scholar]
- 5. Darquenne C, Paiva M, Prisk GK. Effect of gravity on aerosol dispersion and deposition in the human lung after periods of breath holding. J Appl Physiol 89: 1787–1792, 2000 [DOI] [PubMed] [Google Scholar]
- 6. Darquenne C, Paiva M, West JB, Prisk GK. Effect of microgravity and hypergravity on deposition of 0.5- to 3-micron-diameter aerosol in the human lung. J Appl Physiol 83: 2029–2036, 1997 [DOI] [PubMed] [Google Scholar]
- 7. Darquenne C, Prisk GK. Deposition of inhaled particles in the human lung is more peripheral in lunar than in normal gravity. Eur J Appl Physiol 103: 687–695, 2008 [DOI] [PubMed] [Google Scholar]
- 8. Darquenne C, Prisk GK. Effect of gravitational sedimentation on simulated aerosol dispersion in the human acinus. J Aerosol Sci 34: 405–418, 2003 [DOI] [PubMed] [Google Scholar]
- 9. Darquenne C, West JB, Prisk GK. Deposition and dispersion of 1-micrometer aerosol boluses in the human lung: effect of micro- and hypergravity. J Appl Physiol 85: 1252–1259, 1998 [DOI] [PubMed] [Google Scholar]
- 10. Darquenne C, West JB, Prisk GK. Dispersion of 0.5- to 2-micron aerosol in microG and hypergravity as a probe of convective inhomogeneity in the lung. J Appl Physiol 86: 1402–1409, 1999 [DOI] [PubMed] [Google Scholar]
- 11. Haefeli-Bleuer B, Weibel ER. Morphometry of the human pulmonary acinus. Anat Rec 220: 401–414, 1988 [DOI] [PubMed] [Google Scholar]
- 12. Harrington L, Prisk GK, Darquenne C. Importance of the bifurcation zone and branch orientation in simulated aerosol deposition in the alveolar zone of the human lung. J Aerosol Sci 37: 37–62, 2006 [Google Scholar]
- 13. Henry FS, Butler JP, Tsuda A. Kinematically irreversible acinar flow: a departure from classical dispersive aerosol transport theories. J Appl Physiol 92: 835–845, 2002 [DOI] [PubMed] [Google Scholar]
- 14. Heyder J, Blanchard JD, Feldman HA, Brain JD. Convective mixing in human respiratory tract: estimates with aerosol boli. J Appl Physiol 64: 1273–1278, 1988 [DOI] [PubMed] [Google Scholar]
- 15. Jayaraju ST, Paiva M, Brouns M, Lacor C, Verbanck S. Contribution of upper airway geometry to convective mixing. J Appl Physiol 105: 1733–1740, 2008 [DOI] [PubMed] [Google Scholar]
- 16. Ma B, Darquenne C. Aerosol deposition characteristics in distal acinar airways under cyclic breathing conditions. J Appl Physiol 110: 1271–1282, 2011 [DOI] [PMC free article] [PubMed] [Google Scholar]
- 17. Ma B, Lutchen KR. CFD simulation of aerosol deposition in an anatomically based human large-medium airway model. Ann Biomed Eng 37: 271–285, 2009 [DOI] [PubMed] [Google Scholar]
- 18. Ma B, Ruwet V, Corieri P, Theunissen R, Riethmuller M, Darquenne C. CFD simulation and experimental validation of fluid flow and particle transport in a model of alveolated airways. J Aerosol Sci 40: 403–141, 2009 [DOI] [PMC free article] [PubMed] [Google Scholar]
- 19. Rosenthal FS. The effect of nonuniform ventilation on the dispersion of inspired aerosol boluses—a modeling study. J Aerosol Med 6: 177–197, 1993 [Google Scholar]
- 20. Rosenthal FS, Blanchard JD, Anderson PJ. Aerosol bolus dispersion and convective mixing in human and dog lungs and physical models. J Appl Physiol 73: 862–873, 1992 [DOI] [PubMed] [Google Scholar]
- 21. Scherer PW, Shendalman LH, Greene NM, Bouhuys A. Measurement of axial diffusivities in a model of the bronchial airways. J Appl Physiol 38: 719–723, 1975 [DOI] [PubMed] [Google Scholar]
- 22. Schulz A, Tuch T, Brand P, Schulz H, Erdl R, von Mutius E, Reinhardt D, Heyder J. Aerosol bolus dispersion in the respiratory tract of children. Exp Lung Res 20: 119–130, 1994 [DOI] [PubMed] [Google Scholar]
- 23. Schulz H, Heilmann P, Hillebrecht A, Gebhart J, Meyer M, Piiper J, Heyder J. Convective and diffusive gas transport in canine intrapulmonary airways. J Appl Physiol 72: 1557–1562, 1992 [DOI] [PubMed] [Google Scholar]
- 24. Tsuda A, Federspiel WJ, Grant PA, Fredberg JJ. Axial-dispersion of inert species in alveolated channels. Chem Eng Sci 46: 1419–1426, 1991 [Google Scholar]
- 25. Tsuda A, Henry FS, Butler JP. Chaotic mixing of alveolated duct flow in rhythmically expanding pulmonary acinus. J Appl Physiol 79: 1055–1063, 1995 [DOI] [PubMed] [Google Scholar]
- 26. Tsuda A, Henry FS, Butler JP. Gas and aerosol mixing in the acinus. Respir Physiol Neurobiol 163: 139–149, 2008 [DOI] [PMC free article] [PubMed] [Google Scholar]
- 27. Tsuda A, Rogers RA, Hydon PE, Butler JP. Chaotic mixing deep in the lung. Proc Natl Acad Sci USA 99: 10173–10178, 2002 [DOI] [PMC free article] [PubMed] [Google Scholar]
- 28. Ultman JS, Blatman HS. Longitudinal mixing in pulmonary airways. Analysis of inert gas dispersion in symmetric tube network models. Respir Physiol 30: 349–367, 1977 [DOI] [PubMed] [Google Scholar]
- 29. van der Kooij AM, Luijendijk SC. Longitudinal dispersion in model of central airways during high-frequency ventilation. Respir Physiol 84: 13–29, 1991 [DOI] [PubMed] [Google Scholar]
- 30. van der Kooij AM, Luijendijk SC. Longitudinal dispersion of gases measured in a model of the bronchial airways. J Appl Physiol 59: 1343–1349, 1985 [DOI] [PubMed] [Google Scholar]
- 31. van Ertbruggen C, Corieri P, Theunissen R, Riethmuller ML, Darquenne C. Validation of CFD predictions of flow in a 3D alveolated bend with experimental data. J Biomech 41: 399–405, 2008 [DOI] [PMC free article] [PubMed] [Google Scholar]
- 32. Verbanck S, Schuermans D, Paiva M, Vincken W. Saline aerosol bolus dispersion. II. The effect of conductive airway alteration. J Appl Physiol 90: 1763–1769, 2001 [DOI] [PubMed] [Google Scholar]
- 33. Verbanck S, Schuermans D, Vincken W, Paiva M. Saline aerosol bolus dispersion. I. The effect of acinar airway alteration. J Appl Physiol 90: 1754–1762, 2001 [DOI] [PubMed] [Google Scholar]


