

Abstract
Few investigators have studied cognition over time in adults with heart failure (HF). A battery of neuropsychological tests was administered to 279 adults with chronic systolic or diastolic HF at baseline, three and six months. Growth mixture modeling (GMM) was used to model the measure anticipated to be most sensitive, the digit symbol substitution task (DSST). We describe how and why the DSST patterns change over time. Other measures of cognition were examined to identify consistency with the DSST patterns. The sample was predominantly male (63.2%), Caucasian (62.7%), mean age 62 years. The best fit GMM revealed two trajectories of DSST scores: Average processing speed group (40.5%) and Below Average processing speed (59.9%). Neither group changed significantly over the six month study. Other measures of cognition were consistent with the DSST patterns. Factors significantly associated with increased odds of being in the Below Average processing speed group included older age, male gender, Non-Caucasian race, less education, higher ejection fraction, high comorbid burden, excessive daytime sleepiness, and higher BMI. As some of the factors related to cognitive impairment are modifiable, research is needed to identify interventions to preserve and improve cognition in these patients.
1. Introduction
The prevalence of cognitive impairment in adults with chronic heart failure (HF) is recognized as a factor contributing to complexity in caring for these patients [1]. A review of studies from 2002 to 2007 estimated that approximately 25–50% of HF patients have impaired cognition [2]. Few investigators have studied if and how cognition changes over time in this population, however. Thus, the purposes of this study were to identify patterns of cognition and how those patterns change over a six-month period in adults with chronic HF and to identify contributors to the patterns identified.
Only six studies were located in which investigators measured cognitive function of HF patients over intervals of 18 weeks [3] to 10 years [4]. Two of the six studies enrolled hospitalized HF patients [5, 6]. Three of the six assessed cognitive functioning using screening instruments such as the Mini-Mental Status Examination (MMSE) or the Hodkinson Abbreviated Mental Test (AMT) rather than standardized neuropsychological measures [5–7]. Only one of these three screening studies found a change in functioning over time [5]. That study was a retrospective analysis of data from 1,220 elderly hospitalized HF patients from 81 clinical sites in Italy collected during the 1990s. Cognitive functioning was screened with the AMT before hospital discharge when an ACE inhibitor was initiated for some patients. After 12 months, ACE inhibitor prescription was associated with significantly improved cognitive functioning (odds ratio, 1.57; 95% confidence interval, 1.18–2.08), after adjusting for baseline cognitive functioning and potential confounding variables including systolic blood pressure. Cognitive functioning did not improve among patients without HF.
Three of the six longitudinal studies used neuropsychological measures of cognition. One of these studies demonstrated that global cognitive functioning on the Dementia Rating Scale (DRS) improved significantly, but very modestly, over a 12-month period in patients with HF compared to those with cardiovascular disease but not HF [8]. Specifically, patients with HF improved in attention, initiation/perseveration, and conceptualization over time. The only predictor of improved global cognitive function in the HF patients over time was higher diastolic blood pressure at baseline (r = 0.38; P = .02). Perhaps the most important finding from that study was to show that cognitive functioning in HF is most likely to either increase slightly or remain stable over a 12-month interval.
The second study using neuropsychological tests measured cognitive functioning in response to an exercise training program [3]. Twenty HF patients (NYHA class III) who completed an 18-week exercise training program were compared to five HF patients who were unable to participate in training. Six measures of cognitive functioning were administered at baseline and at completion of the program. Patients who exercised had significantly improved scores in attention and psychomotor speed.
In the final study, data from 702 octogenarians from the Swedish Twin Registry were analyzed using latent growth curve modeling to assess performance over time in persons with HF compared to those without HF [4]. Cognitive testing was done five times between 1991 and 2002 using a battery of neuropsychological measures of processing speed, visuospatial ability, and short-term, episodic, and semantic memory. Measures of episodic memory declined more over time in the 13% of the sample with HF compared to those without HF. There were no significant differences between the groups in the other cognitive domains.
Together these studies suggest that episodic memory declines over time but attention, initiation/perseveration, conceptualization, and psychomotor speed may improve over time in some HF patients. Factors associated with improved cognition included receipt of an ACE inhibitor and exercise training. The effect of blood pressure on cognitive change is unclear. Because data that address change in cognition is so sparse and inconsistent, we analyzed data obtained from a sample of adults with chronic HF in whom a battery of neuropsychological measures was administered at baseline, three and six months. This analysis began with cognitive processing speed as measured by the Digit Symbol Substitution Test (DSST) [9]. Previous research has shown that DSST is among the most sensitive cognitive measures to a variety of cognitive disturbances and declines rapidly with advancing age [10]. Lower DSST scores were shown to be associated with increased five-year mortality in the Cardiovascular Health Study [11] and reduced information processing speed using a similar measure (Symbol Digit Modalities) is associated with cerebrovascular pathology and cardiovascular risk [12, 13].
We used the DSST as an initial measure that we believed would be highly sensitive to any cognitive impairment if it was present. But, we were also interested in describing the differing neurocognitive patterns associated with the latent groups established by DSST performance. It was possible, though not highly likely, that our well-functioning group on the DSST would show a more impaired profile in another neurocognitive domain or that we would show different patterns of cognitive test performance in other measures. Thus, DSST, with measures at three time points, was selected as the primary study endpoint to assess longitudinal change. But change in the other measures is described as well.
2. Methods
The methods used in this study have been described previously but, in brief, we conducted a prospective cohort study with a consecutive sample of 280 adults with chronic HF [14]. Subjects were enrolled from three outpatient settings in the northeastern U.S. Only adults with chronic Stage C HF (currently or previously symptomatic) of either systolic or diastolic type were enrolled. All willing participants were screened to assure adequacy of visual acuity, hearing, and English fluency. We excluded individuals with severe cognitive impairment as measured by the Telephone Interview of Cognitive Status (TICS) [15]; nine individuals with a TICS score below 24 were ineligible for enrollment. Thereafter, we divided the sample into those with and without mild cognitive impairment. The primary analysis focused on the effect of excessive daytime sleepiness on self-care, so individuals living in a long-term care setting, working nights or rotating shifts, or noted to have severe renal failure requiring dialysis, major depressive illness, an imminently terminal illness, plans to move out of the area, or a history of serious drug or alcohol abuse within the past year were excluded. Most of the data were collected in person during home visits. Clinical information was abstracted from the medical record. Data were collected between 2007 and 2010.
2.1. Measurement
A neuropsychological test battery measuring the cognitive domains of processing speed, simple and complex attention, working memory, verbal memory, and crystallized cognitive ability was administered to all participants at enrollment, three and six months. This six-month interval was chosen to facilitate comparison with our prior research and with the realization that a significant proportion of the HF population dies in the first year after diagnosis [16]. The battery included the Digit Symbol Substitution Test [9] (DSST), which measures processing and psychomotor speed, the Psychomotor Vigilance Task (simple attention) [17], the Trail Making Test B (complex attention) [18], the Probed Recall Memory Task (working memory) [10], and the Letter Number Sequencing test (short-term memory) [9].
As noted above, the DSST was the focus of this analysis. To complete the DSST, subjects were provided a series of nonsequential numbers with blank boxes below. A key at the top shows each unique number paired with a different symbol. Working in order, participants transcribe the appropriate symbol for each number in the blank boxes. Speed is enhanced if the subject recalls the symbol that goes with each letter rather than needing to look at the key. The number correctly completed in 120 seconds is measured. Higher scores on the DSST indicate better cognitive processing speed. Age-specific norms are available but in this study the raw score was used in analysis because the analytic technique requires continuous scores. Instead of using age-specific norms, we included age as a covariate in the analysis of determinants of cognitive processing speed.
Sociodemographic characteristics of age and gender were measured by self-report. Household income was self-reported in terms of adequacy; participants were asked to consider how well their household lives on its income (comfortable, have more than enough to make ends meet; have enough to make ends meet; do not have enough to make ends meet). Premorbid (i.e., crystallized) intelligence was measured with the American National Adult Reading Test (ANART) as a proxy for formal intelligence testing [19]. On the ANART, subjects read a list of 50 phonetically irregular words aloud. To estimate intelligence, we calculated the number of errors made on the ANART and applied the formulas [19].
To determine exercise frequency at enrollment, participants were asked how much exercise they had obtained in the past week (none or fewer than 30 minutes, <1 hour (minimal), or 1–3 hours (adequate)). We asked about only the past week to avoid issues with recall. Body mass index was calculated from height and weight in pounds at the time of enrollment using the standard formula.
Blood pressure was measured during the enrollment home visit and used to compute mean arterial pressure. NYHA functional class was rated by a single cardiologist using information from a structured interview [20]; higher classes indicate worse functional status. Last known left ventricular ejection fraction was abstracted from the medical record. ACE inhibitor and beta blocker usage was assessed (yes or no) from the list of medications obtained from patients at the baseline visit. The 19-item Charlson Comorbidity Index was used in analysis [21]. Responses are weighted and summed. The total or categories (low, moderate, or high) can be used in analysis, but we used the categories because in the original validity testing the instrument authors demonstrated that comorbidity categories predicted mortality, complications, health care resource use, length of hospital stay, discharge disposition, and cost [22].
Daytime sleepiness was measured with the Epworth Sleepiness Scale (ESS); values greater ≥ 11 indicate excessive daytime sleepiness [23]. Respondents rate the likelihood of falling asleep in eight soporific situations using a 4-point Likert scale ranging from never dozing (0) to high chance of dozing (3). The ESS correlates significantly with the frequency of apneas and is a validated research tool in the assessment of excessive daytime sleepiness [24]. Test-retest reliability (r = 0.82) and internal consistency (α = 0.88) have been established in addition to its single factor structure [25].
Medication adherence was assessed with the Basel Assessment of Adherence Scale (BAASIS), a structured interview assessing general medication adherence over the past month [26]. The BAASIS is a 4-item tool assessing compliance with taking and timing dimensions of medication regimens as well as the occurrence of drug holidays over the past four weeks. A positive answer on any of the questions classifies a patient as nonadherent with the medication regimen, a strict definition of nonadherence that increases the sensitivity of measurement. The BAASIS has established reliability and validity [26].
2.2. Analysis
Standard descriptive statistics of frequency, central tendency, and dispersion were used to describe the sample. Comparisons of characteristics between observed trajectories were made using Student's t-tests, without assuming equal variance, or χ 2 analysis where appropriate. StataMP v11 (College Station, Texas) was used for all descriptive and comparative statistics. There is a growing body of literature on effectively capturing heterogeneous trajectories of change over time [27–29]. Finite mixture models of longitudinal data, such as growth mixture modeling (GMM), are used to identify common and distinct trajectories of change [30]. GMM was used in this study to permit intra- and inter-individual variability [31].
Mplus 6.1 software [32] was used to generate GMM, using the expectation maximization (EM) algorithm and full information maximum likelihood (FIML) for missing data, assuming that data were missing at random (MAR) [33]. A maximum of three latent class trajectories was posited, based on theoretical expectations and the limited sample size. Our approach to model specification in GMM was based on procedures explicated by Ram and colleagues [34]. Model fit was assessed with Akaike information criterion (AIC); the model with the lowest value was favored. Given the potential sensitivity of the AIC to sample size and model complexity, entropy also was used to gauge the accuracy of classification. Entropy ranges from 0 to 1 with values closer to 1 indicating better trajectory separation based on posterior probabilities (average probability of belonging in “most likely” trajectory near 1.0) [35, 36]. Model selection was also assessed using the Lo-Mendell-Rubin adjusted likelihood ratio test [LRT] with a significant result indicating the k (as opposed to the k − 1) class solution is preferred [37]. Finally, the proportion of the sample in each trajectory (not less than 5%) and parametric bootstrap LRT were used to compare alternative models [38]. Univariate (unadjusted) and multivariate (adjusted) logistic regression modeling was then used to quantify the relationship between baseline demographic and clinical characteristics and the likelihood of membership in the trajectory with the lowest scores.
3. Results
One subject was missing data on the key variables, leaving a sample of 279 available for this analysis. The sample was predominantly male (63.2%) and Caucasian (62.7%) (Table 1). The mean age of the participants was 62 years. Family income was sufficient in a large proportion (48.8%), and the average education was approximately 14 years. Overall ANART error scores suggest average general intelligence (estimated full scale IQ (FSIQ) T Score = 47, 39-40th percentile). Most participants were functionally compromised (76.3% NYHA class III or IV). A slight majority (53.1%) had low-comorbid burden based on Charlson Comorbidity Index categories. Many were sedentary (20.4%) or exercised less than 1 hour weekly (36.9%). The average BMI was in the overweight (25–29) range. Approximately 24% of the sample had significant excessive daytime sleepiness.
Table 1.
Clinical and demographic characteristics of the two groups. Mean ± standard deviation or n (%) is reported.
| Total sample | Average processing speed (n = 114) | Below a ve ra ge processing speed (n = 165) | P value | |
|---|---|---|---|---|
| Age (years) | 62.1 ± 12.4 | 56.1 ± 12.1 | 66.3 ± 11.9 | <.001 |
| Male | 179 (64.2) | 62 (54.4) | 117 (70.9) | .005 |
| Race/ethnicity | ||||
| White | 175 (62.7) | 86 (75.4) | 89 (53.9) | <.001 |
| Non white | 104 (37.3) | 28 (24.6) | 76 (46.1) | |
| Income | .021 | |||
| More than enough | 98 (35.1) | 43 (37.7) | 55 (33.3) | |
| Sufficient | 136 (48.8) | 61 (53.5) | 75 (45.5) | |
| Less than enough | 45 (16.1) | 10 (8.8) | 35 (21.2) | |
| Years of education | 13.9 ± 2.9 | 14.9 ± 3.1 | 13.2 ± 2.5 | <.001 |
| Body mass index (BMI) | 31.0 ± 7.9 | 29.4 ± 7.5 | 32.0 ± 8.1 | .006 |
| Exercise | .002 | |||
| None | 57 (20.4) | 19 (16.7) | 38 (23.0) | |
| Minimal | 103 (36.9) | 32 (28.1) | 71 (43.0) | |
| Adequate | 119 (42.7) | 63 (55.3) | 56 (34.0) | |
| Charlson comorbidity severity | <.001 | |||
| Low | 148 (53.1) | 79 (69.3) | 69 (41.8) | |
| Moderate | 101 (36.2) | 32 (28.1) | 69 (41.8) | |
| High | 30 (10.7) | 3 (2.6) | 27 (16.4) | |
| NYHA functional class | ||||
| Classes I and II | 66 (23.7) | 33 (28.9) | 33 (20.0) | .188 |
| Class III | 163 (58.4) | 63 (55.3) | 100 (60.6) | |
| Class IV | 50 (17.9) | 18 (15.8) | 32 (19.4) | |
| Ejection fraction | 35.5 ± 17.0 | 34.5 ± 16.0 | 36.2 ± 17.6 | .404 |
| ACE inhibitor | 161 (57.7) | 75 (65.8) | 86 (52.1) | .023 |
| Beta blocker | 258 (92.5) | 107 (93.9) | 151 (91.5) | .466 |
| Mean arterial pressure | 84.7 ± 12.0 | 82.6 ± 11.4 | 86.1 ± 12.2 | .016 |
| Epworth sleepiness scale score ≥ 11 | 66 (23.7) | 23 (20.2) | 43 (26.1) | .256 |
| Basel medication adherence scale | 0.96 ± 0.94 | 1.10 ± 0.95 | 0.90 ± 0.94 | .193 |
| ANART correct responses | 56.8 ± 1.4 | 57.3 ± 1.3 | 56.4 ± 1.3 | <.001 |
| Digit symbol substitution task total score | 53.4 ± 17.5 | 69.4 ± 11.0 | 42.3 ± 11.5 | <.001 |
ACE: angiotensin converting enzyme; ANART: American National Adult Reading Test; NYHA: New York Heart Association.
Over the course of the study, average DSST scores improved minimally from 53.4 ± 17.5 at baseline to 55.8 ± 17.6 at three months and 58.1 ± 17.9 at six months, and DSST scores were highly correlated over time (r > .83, P < .001). The most informative and best fit GMM revealed two trajectories of change in DSST scores (Figure 1). Model AIC was 6112.5, entropy was 0.808, and the Lo-Mendell-Rubin adjusted LRT (326.9, P < .001) and parametric bootstrap LRT (346.2, P < .001) indicated dominant fit with two trajectories over considering a single pattern of change in DSST scores. The smaller trajectory (40.5% of the sample, average posterior probability = 94.6%) identified participants who had higher DSST scores throughout the study, referred to as the average processing speed group. The ANART estimated FSIQ for this group was in the average range (T = 49, 44-45th percentile). The larger trajectory (59.9% of the sample, average posterior probability = 94.1%) identified participants who had lower DSST scores throughout the study, referred to as the below average processing speed group. This group was also in the average range of general intelligence on the ANART (T = 46, 34-35th percentile).
Figure 1.
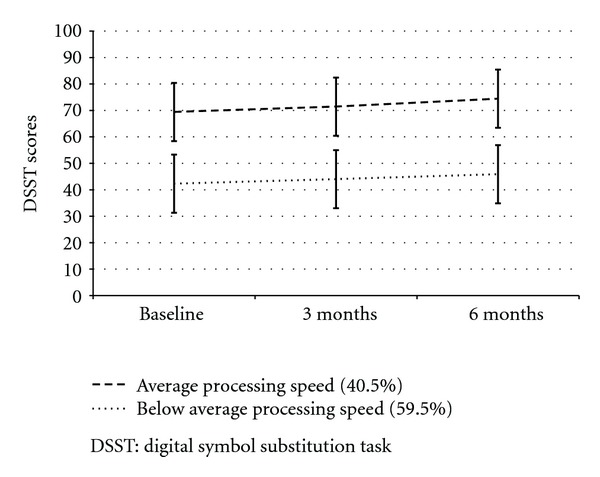
Two trajectories of change over time in DSST scores.
There were several unadjusted differences between the two observed trajectories (Table 1). For example, patients in the average processing speed group were younger, had more years of education, a lower mean arterial pressure, lower BMI, and a slightly better, albeit not clinically meaningfully different, ANART score compared with patients in the below average processing speed group. A greater proportion of patients in the average processing speed group were female, Caucasian, had sufficient or greater income, had adequate exercise, had a low level of comorbidity, and took an ACE inhibitor compared with patients in the below average processing speed group.
In addition to the DSST, all other measures of cognition were different between the two groups at baseline. Each measure demonstrated a very minor improvement in each group over time. Differences in each measure of cognition remained significant between the two groups at three and six months (Table 2).
Table 2.
Change in indices of cognition by group. Mean ± standard deviation is reported.
| Measure of cognition | Enrollment | 3 months | 6 months | F-test† |
|---|---|---|---|---|
| Digit symbol substitution task total score | ||||
| Adequate processing speed | 69.4 ± 11.1 | 71.5 ± 11.7 | 74.5 ± 10.7 | F = 421.7‡ |
| Below average processing speed | 42.3 ± 11.5 | 44.0 ± 11.0 | 45.9 ± 11.1 | |
| Psychomotor vigilance task lapses | ||||
| Adequate processing speed | 3.8 ± 2.6 | 3.4 ± 2.8 | 3.5 ± 2.5 | F = 23.9‡ |
| Below average processing speed | 5.8 ± 3.8 | 5.4 ± 3.4 | 5.1 ± 3.4 | |
| Trail making Test B time | ||||
| Adequate processing speed | 77.1 ± 32.8 | 74.6 ± 32.8 | 67.4 ± 31.2 | F = 88.8‡ |
| Below average processing speed | 134.6 ± 61.7 | 128.7 ± 57.3 | 127.4 ± 57.5 | |
| Probed recall memory task (out of 4) | ||||
| Adequate processing speed | 2.6 ± 1.2 | 2.7 ± 1.2 | 2.9 ± 1.2 | F = 45.5‡ |
| Below average processing speed | 1.6 ± 1.2 | 1.9 ± 1.3 | 2.0 ± 1.3 | |
| Letter number sequencing test | ||||
| Adequate processing speed | 10.4 ± 3.2 | 10.5 ± 3.4 | 10.8 ± 3.7 | F = 51.0‡ |
| Below average processing speed | 7.5 ± 3.2 | 7.7 ± 3.1 | 7.7 ± 3.2 | |
| Number of cognitive tests with impairment | ||||
| Adequate processing speed | 1.3 ± 0.7 | 1.4 ± 0.8 | 1.3 ± 0.8 | F = 29.8‡ |
| Below average processing speed | 2.0 ± 1.1 | 1.9 ± 1.1 | 1.7 ± 1.0 |
†Test of between-subjects effects; ‡ P value < .0001.
There were several factors that increased the likelihood that patients would fit the below average processing speed group individually and in the multivariate model (Table 3); multivariate model χ 2 = 139.9, P < .001; McFadden's pseudo R 2 = 37.3%; Hosmer-Lemeshow LRT = 255.5, p.533; correct classification rate = 79.1%; area under the curve = .876. Factors significantly associated with increased odds of being classified in the below average processing speed group in the multivariate model included additional years of age, male gender, non-Caucasian race, fewer years of education, higher ejection fraction, high comorbid burden, excessive daytime sleepiness, and higher values of BMI. Factors not related to the below Average group were income, exercise, blood pressure, ACE inhibitors, beta blockers, NYHA functional class, premorbid intelligence, and medication adherence.
Table 3.
Factors predicting below average processing speed: unadjusted and adjusted odds.
| Unadjusted odds ratio (95% CI) | P value | Adjusted odds ratio (95% CI) | P value | |
|---|---|---|---|---|
| Age | 1.08 (1.06–1.11) | <.001 | 1.12 (1.08–1.16) | <.001 |
| Female | 0.48 (0.30–0.81) | .005 | 0.42 (0.21–0.85) | .016 |
| Non-Caucasian | 2.62 (1.55–4.43) | <.001 | 2.82 (1.21–6.55) | .016 |
| ANART-FSIQ | 0.61 (0.50–0.74) | <.001 | 0.75 (0.54–1.03) | .078 |
| Ejection fraction | 1.01 (0.99–1.02) | .410 | 1.02 (1.00–1.05) | .033 |
| Income | 1.43 (1.01–2.04) | .046 | 1.41 (0.83–2.41) | .208 |
| Charlson moderate∗ | 2.47 (1.45–4.19) | .001 | 1.81 (0.90–3.64) | .096 |
| Charlson high∗ | 10.30 (2.99–35.45) | <.001 | 9.65 (1.77–52.54) | .009 |
| ACE inhibitor | 0.57 (0.35–0.93) | .024 | 0.67 (0.23–1.34) | .259 |
| Beta blocker | 0.71 (0.28–1.81) | .467 | 1.55 (0.38–6.41) | .543 |
| Years of education | 0.80 (0.73–0.88) | <.001 | 0.85 (0.74–0.98) | .024 |
| Mean arterial pressure | 0.99 (0.99–1.00) | .296 | 0.99 (0.99–1.01) | .179 |
| NYHA | 1.38 (0.99–1.92) | .056 | 0.85 (0.52–1.38) | .506 |
| Excessive daytime sleepiness | 1.39 (0.79–2.48) | .257 | 2.42 (1.05–5.53) | .037 |
| BMI | 1.05 (1.01–1.08) | .007 | 1.06 (1.01–1.11) | .009 |
| Basel adherence score | 0.84 (0.65–1.09) | .192 | 1.06 (0.61–1.22) | .402 |
| Exercise minimal† | 1.11 (0.56–2.21) | .768 | 0.92 (0.35–2.44) | .865 |
| Exercise adequate† | 0.44 (0.23–0.86) | .016 | 0.61 (0.24–1.58) | .313 |
∗Relative to low Charlson comorbid category.
†Relative to no exercise.
Key: ANART: American National Adult Reading Test; ACE Inhibitor: angiotensin converting enzyme inhibitor; NYHA: New York Heart Association.
4. Discussion
Two distinct patterns of cognitive performance were identified in this sample of functionally limited but relatively young HF patients. The below average processing speed group scored consistently and significantly lower than the average processing speed group on every measure of cognition, in spite of evidence of average premorbid intellect in both groups. The major finding of this study was that there was little change in cognition over the six months of the study in either of these groups. The minimal improvement seen probably reflects the learning that typically occurs when people take these tests multiple times. Many of the predictors of those in the below average processing speed group were not modifiable (higher age, male gender, non-Caucasian race, fewer years of education, and high comorbid burden). However, excessive daytime sleepiness and BMI predicted group membership and these factors are potentially modifiable, as discussed below.
Other investigators have found some improvement in cognition over time, although we did not. The study by Zuccalá and colleagues described in the introduction enrolled hospitalized HF patients, treated them with ACE inhibitors, and documented an improvement in overall cognitive functioning after 12-months [5]. Our results could differ from theirs because we enrolled out-patients, most were already on an ACE inhibitor, and we followed them for only 6 months. The other studies that demonstrated improvement in cognition tested an exercise intervention [3] or followed patients for a longer period of time [8]. At this point it does not appear that cognition can be greatly improved but further research is needed to clarify this issue.
Building on the results of previous investigators we tested the influence of ACE inhibitors, exercise, and blood pressure on cognitive change over time and although these three factors were significantly different between the groups in unadjusted analyses, none of these factors were useful in predicting below average processing speed. Our results probably differ from those of prior investigators because of the analytic technique used. That is, had we simply compared the two groups our results would have supported those of prior investigators. However, because we used a regression analysis to identify the best predictors of below average processing speed, some of the predictors were supplanted by other better predictors.
The results of this study provide some support for the conceptual model published by Bennett and colleagues [39]. They proposed that age, gender, comorbidity, hypertension, depression, medications, education, and circulatory insufficiency (i.e., ejection fraction, duration of HF, NYHA functional status, and oxygen saturation) contribute to cognitive deficits in adults with chronic HF. Our results corroborate their model with age, gender, comorbidity, education, and ejection fraction identified as significantly associated with increased odds of being classified in the below average processing speed group. Noting that a high Charlson Comorbidity score at enrollment predicted below average processing speed suggests that processing speed is influenced by illness burden, which supports prior results [11, 40]. These results differs from those of Pressler et al. [41] who found that comorbidity was not associated with cognitive changes, which may reflect the manner in which the Charlson Comorbidity Index score was used in their analysis (continuous score versus our use of categories) and the longitudinal nature of our analyses.
We found that fewer years of education predicted below average processing speed. These results support those of Stern et al. who reported incident dementia data from a follow-up study of 593 community-based, nondemented individuals aged 60 years or older and identified low education as a risk factor for dementia [42]. Stern discusses these findings in terms of cognitive reserve or individual differences in the cognitive processes or neural networks underlying task performance that allow some people to cope better than others with damage to the brain [43].
Excessive daytime sleepiness and BMI may be targets of intervention to improve cognition. Excessive daytime sleepiness may be a reflection of poor sleep quality and/or sleep-disordered breathing, which are known to accentuate the often subtle cognitive problems existing in persons with HF [44, 45]. Sleep quality can be improved with pharmaceutical agents, exercise [46], and cognitive behavior therapy for insomnia [47]. Sleep-disordered breathing is treatable with continuous positive airway pressure, which has the added benefit of improving ejection fraction [48]. Body mass index has not been studied as a predictor of cognition previously in adults with HF, but higher BMI has been found to be negatively associated with cognition in other groups [49, 50].
A surprising finding of our study was that higher ejection fraction was associated with below average processing speed, a finding that contradicts those of others who have shown that lower ejection fraction is associated with impaired cognition [51–53]. It may be that an unaccounted for interaction between ejection fraction and another factor such as a medication could have influenced the direction of effect in this study. It should be noted, however, that in some studies no relationship was identified between ejection fraction and cognition [54, 55]. Further research is needed to clarify the relationship between ejection fraction and cognition.
Limitations of this analysis include the relatively young age of the sample, considering that HF is most prevalent in the eighth decade [16], adequate income, and an average education of 14 years—all characteristics that suggest that results from this sample may not be generalizable to the general HF population. It is important to note that the parent study used a cohort design in which individuals with mild cognitive decline were preferentially sampled, which may explain the two trajectories identified here. Also, as these were out-patients, there was no guarantee that the body weight reflected adipose or body mass rather than fluid accumulation. Strengths of this study include the longitudinal data, a relatively large sample size, and the sophisticated analytic technique.
Future research is needed describing how cognition changes or fails to change over time and what modifiable factors are associated with an improvement. Clearly impaired cognition is an issue in these patients, but we remain uncertain what causes it, whether it is temporary or permanent, and how to intervene. Further research examining the relationship between obesity and cognition is needed in HF patients. Higher inflammatory markers are known to increase brain and heart injury; cognition research including biomarkers would further our understanding of how body weight affects cognition.
In summary, close to half of our sample demonstrated average processing speed but most of the sample demonstrated below average processing speed and no improvement in cognition was seen over the six months of this study. Efforts are needed to identify interventions that can effectively prevent and perhaps reverse cognitive decline after HF is diagnosed. Right now, exercise is the most promising approach, as it has been demonstrated to induce an increase in neural precursor cell activity and improve cognition directly [56]. Exercise also could influence the two modifiable predictors identified in this study: BMI and excessive daytime sleepiness. Research testing interventions aimed at improving cognition are urgently needed.
Acknowledgments
This work was funded by a Grant from the National Heart, Lung & Blood Institute (RO1 HL084394-01A1) and by the Philadelphia Veterans Affairs Medical Center, VISN 4 Mental Illness Research, Education, and Clinical Center (MIREC).
References
- 1.De Geest S, Steeman E, Leventhal ME, et al. Complexity in caring for an ageing heart failure population: concomitant chronic conditions and age related impairments. European Journal of Cardiovascular Nursing. 2004;3(4):263–270. doi: 10.1016/j.ejcnurse.2004.08.004. [DOI] [PubMed] [Google Scholar]
- 2.Pressler SJ. Cognitive functioning and chronic heart failure: a review of the literature (2002-July 2007) Journal of Cardiovascular Nursing. 2008;23(3):239–249. doi: 10.1097/01.JCN.0000305096.09710.ec. [DOI] [PubMed] [Google Scholar]
- 3.Tanne D, Freimark D, Poreh A, et al. Cognitive functions in severe congestive heart failure before and after an exercise training program. International Journal of Cardiology. 2005;103(2):145–149. doi: 10.1016/j.ijcard.2004.08.044. [DOI] [PubMed] [Google Scholar]
- 4.Hjelm C, Dahl A, Brostrom A, Martensson J, Johansson B, Stromberg A. The influence of heart failure on longitudinal changes in cognition among individuals 80 years of age and older. Journal of Clinical Nursing. 2012;(7-8):994–1003. doi: 10.1111/j.1365-2702.2011.03817.x. [DOI] [PubMed] [Google Scholar]
- 5.Zuccalà G, Marzetti E, Cesari M, et al. Correlates of cognitive impairment among patients with heart failure: results of a multicenter survey. American Journal of Medicine. 2005;118(5):496–502. doi: 10.1016/j.amjmed.2005.01.030. [DOI] [PubMed] [Google Scholar]
- 6.Formiga F, Chivite D, Solé A, Manito N, Ramon JM, Pujol R. Functional outcomes of elderly patients after the first hospital admission for decompensated heart failure (HF). A prospective study. Archives of Gerontology and Geriatrics. 2006;43(2):175–185. doi: 10.1016/j.archger.2005.10.010. [DOI] [PubMed] [Google Scholar]
- 7.Karlsson MR, Edner M, Henriksson P, et al. A nurse-based management program in heart failure patients affects females and persons with cognitive dysfunction most. Patient Education and Counseling. 2005;58(2):146–153. doi: 10.1016/j.pec.2004.08.005. [DOI] [PubMed] [Google Scholar]
- 8.Stanek KM, Gunstad J, Paul RH, et al. Longitudinal cognitive performance in older adults with cardiovascular disease: evidence for improvement in heart failure. Journal of Cardiovascular Nursing. 2009;24(3):192–197. doi: 10.1097/JCN.0b013e31819b54de. [DOI] [PMC free article] [PubMed] [Google Scholar]
- 9. WAIS-III Technical Manual: Harcourt Assessment Co., 2002.
- 10.Lezak MD, Howieson DB, Loring DW. Neuropsychological Assessment. 4th edition. New York, NY, USA: Oxford University Press; 2004. [Google Scholar]
- 11.Fried LP, Kronmal RA, Newman AB, et al. Risk factors for 5-year mortality in older adults: the cardiovascular health study. Journal of the American Medical Association. 1998;279(8):585–592. doi: 10.1001/jama.279.8.585. [DOI] [PubMed] [Google Scholar]
- 12.Sachdev PS, Brodaty H, Valenzuela MJ, et al. The neuropsychological profile of vascular cognitive impairment in stroke and TIA patients. Neurology. 2004;62(6):912–919. doi: 10.1212/01.wnl.0000115108.65264.4b. [DOI] [PubMed] [Google Scholar]
- 13.Elkins JS, Knopman DS, Yaffe K, Johnston SC. Cognitive function predicts first-time stroke and heart disease. Neurology. 2005;64(10):1750–1755. doi: 10.1212/01.WNL.0000161850.01792.77. [DOI] [PubMed] [Google Scholar]
- 14.Riegel B, Moelter ST, Ratcliffe SJ, et al. Excessive daytime sleepiness is associated with poor medication adherence in adults with heart failure. Journal of Cardiac Failure. 2011;17(4):340–348. doi: 10.1016/j.cardfail.2010.11.002. [DOI] [PMC free article] [PubMed] [Google Scholar]
- 15.Brandt J, Folstein MF. Telephone Interview for Cognitive Status: Psychological Assessment Resources. 2003. [Google Scholar]
- 16.Roger VL, Go AS, Lloyd-Jones DM, et al. Heart disease and stroke statistic—2012 update: a report from the American Heart Association. Circulation. 2012;125(1):e2–e220. doi: 10.1161/CIR.0b013e31823ac046. [DOI] [PMC free article] [PubMed] [Google Scholar]
- 17.Dinges D, Kribbs N, Bates B, Carlin M. A very brief probed recall memory task: sensitivity to sleep loss. Sleep Research. 1993;22, article 330 [Google Scholar]
- 18.Reitan RM. Trail Making Test. Tucson, Ariz, USA: Reitan Neuropsychological Laboratory; 1992. [Google Scholar]
- 19.Gladsjo JA, Heaton RK, Palmer BW, Taylor MJ, Jeste DV. Use of oral reading to estimate premorbid intellectual and neuropsychological functioning. Journal of the International Neuropsychological Society. 1999;5(3):247–254. doi: 10.1017/s1355617799533079. [DOI] [PubMed] [Google Scholar]
- 20.Kubo SH, Schulman S, Starling RC, Jessup M, Wentworth D, Burkhoff D. Development and validation of a patient questionnaire to determine New York heart Association classification. Journal of Cardiac Failure. 2004;10(3):228–235. doi: 10.1016/j.cardfail.2003.10.005. [DOI] [PubMed] [Google Scholar]
- 21.Charlson ME, Pompei P, Ales KA, MacKenzie CR. A new method of classifying prognostic comorbidity in longitudinal studies: development and validation. Journal of Chronic Diseases. 1987;40(5):373–383. doi: 10.1016/0021-9681(87)90171-8. [DOI] [PubMed] [Google Scholar]
- 22.Charlson M, Szatrowski TP, Peterson J, Gold J. Validation of a combined comorbidity index. Journal of Clinical Epidemiology. 1994;47:1245–1251. doi: 10.1016/0895-4356(94)90129-5. [DOI] [PubMed] [Google Scholar]
- 23.Johns MW. Reliability and factor analysis of the Epworth sleepiness scale. Sleep. 1992;15(4):376–381. doi: 10.1093/sleep/15.4.376. [DOI] [PubMed] [Google Scholar]
- 24.Johns MW. Daytime sleepiness, snoring, and obstructive sleep apnea; the Epworth sleepiness scale. Chest. 1993;103(1):30–36. doi: 10.1378/chest.103.1.30. [DOI] [PubMed] [Google Scholar]
- 25.Johns MW. Sensitivity and specificity of the multiple sleep latency test (MSLT), the maintenance of wakefulness test and the Epworth sleepiness scale: failure of the MSLT as a gold standard. Journal of Sleep Research. 2000;9(1):5–11. doi: 10.1046/j.1365-2869.2000.00177.x. [DOI] [PubMed] [Google Scholar]
- 26.Dobbels F, Berben L, De Geest S, et al. The psychometric properties and practicability of self-report instruments to identify medication nonadherence in adult transplant patients: a systematic review. Transplantation. 2010;90(2):205–219. doi: 10.1097/TP.0b013e3181e346cd. [DOI] [PubMed] [Google Scholar]
- 27.Lubke GH, Muthén B. Investigating population heterogeneity with factor mixture models. Psychological Methods. 2005;10(1):21–39. doi: 10.1037/1082-989X.10.1.21. [DOI] [PubMed] [Google Scholar]
- 28.Feldman BJ, Masyn KE, Conger RD. New approaches to studying problem behaviors: a comparison of methods for modeling longitudinal, categorical adolescent drinking data. Developmental Psychology. 2009;45(3):652–676. doi: 10.1037/a0014851. [DOI] [PMC free article] [PubMed] [Google Scholar]
- 29.Jung T, Wackrama KAS. An introduction to latent class growth analysis and growth mixture modeling. Society Personality Psychology Compass. 2008;2:302–317. [Google Scholar]
- 30.Muthen B. Latent variable hybrids: overview of old and new models. In: Hancock GR, Samuelsen KM, editors. Advances in Latent Variable Mixture Models. Charlotte, NC, USA: Information Age Publishing; 2003. pp. 1–24. [Google Scholar]
- 31.Nagin DS, Tremblay RE. Analyzing developmental trajectories of distinct but related behaviors: a group-based method. Psychological Methods. 2001;6(1):18–34. doi: 10.1037/1082-989x.6.1.18. [DOI] [PubMed] [Google Scholar]
- 32.Muthén B, Asparouhov T, Rebollo I. Advances in behavioral genetics modeling using Mplus: applications of factor mixture modeling to twin data. Twin Research and Human Genetics. 2006;9(3):313–324. doi: 10.1375/183242706777591317. [DOI] [PubMed] [Google Scholar]
- 33.Graham JW. Missing data analysis: making it work in the real world. Annual Review of Psychology. 2009;60:549–576. doi: 10.1146/annurev.psych.58.110405.085530. [DOI] [PubMed] [Google Scholar]
- 34.Ram N, Grimm KJ. Methods and measures: growth mixture modeling: a method for identifying differences in longitudinal change among unobserved groups. International Journal of Behavioral Development. 2009;33(6):565–576. doi: 10.1177/0165025409343765. [DOI] [PMC free article] [PubMed] [Google Scholar]
- 35.Wang M, Chan D. Mixture latent Markov modeling: identifying and predicting unobserved heterogeneity in longitudinal qualitative status change. Organizational Research Methods. 2011;14(3):411–431. [Google Scholar]
- 36.Frank SA, Smith DE. Measurement invariance, entropy, and probability. Entropy. 2010;12(3):289–303. [Google Scholar]
- 37.Lo Y, Mendell NR, Rubin DB. Testing the number of components in a normal mixture. Biometrika. 2001;88(3):767–778. [Google Scholar]
- 38.Nylund KL, Asparouhov T, Muthén BO. Deciding on the number of classes in latent class analysis and growth mixture modeling: a Monte Carlo simulation study. Structural Equation Modeling. 2007;14(4):535–569. [Google Scholar]
- 39.Bennett SJ, Sauvé MJ, Shaw RM. A conceptual model of cognitive deficits in chronic heart failure. Journal of Nursing Scholarship. 2005;37(3):222–228. doi: 10.1111/j.1547-5069.2005.00039.x. [DOI] [PubMed] [Google Scholar]
- 40.Zuccalà G, Marzetti E, Cesari M, et al. Correlates of cognitive impairment among patients with heart failure: results of a multicenter survey. American Journal of Medicine. 2005;118(5):496–502. doi: 10.1016/j.amjmed.2005.01.030. [DOI] [PubMed] [Google Scholar]
- 41.Pressler SJ, Subramanian U, Kareken D, et al. Cognitive deficits in chronic heart failure. Nursing Research. 2010;59(2):127–139. doi: 10.1097/NNR.0b013e3181d1a747. [DOI] [PMC free article] [PubMed] [Google Scholar]
- 42.Stern Y, Gurland B, Tatemichi TK, Tang MX, Wilder D, Mayeux R. Influence of education and occupation on the incidence of Alzheimer’s disease. Journal of the American Medical Association. 1994;271(13):1004–1010. [PubMed] [Google Scholar]
- 43.Stern Y. Cognitive reserve. Neuropsychologia. 2009;47(10):2015–2028. doi: 10.1016/j.neuropsychologia.2009.03.004. [DOI] [PMC free article] [PubMed] [Google Scholar]
- 44.Lim J, Dinges DF. Sleep deprivation and vigilant attention. Annals of the New York Academy of Sciences. 2008;1129:305–322. doi: 10.1196/annals.1417.002. [DOI] [PubMed] [Google Scholar]
- 45.Cole CS, Richards KC. Sleep and cognition in people with Alzheimer’s disease. Issues in Mental Health Nursing. 2005;26(7):687–698. doi: 10.1080/01612840591008258. [DOI] [PubMed] [Google Scholar]
- 46.Kline CE, Crowley EP, Ewing GB, et al. The effect of exercise training on obstructive sleep apnea and sleep quality: a randomized controlled trial. Sleep. 2011;34(12):1631–1640. doi: 10.5665/sleep.1422. [DOI] [PMC free article] [PubMed] [Google Scholar]
- 47.Carter PA. A brief behavioral sleep intervention for family caregivers of persons with cancer. Cancer Nursing. 2006;29(2):95–103. doi: 10.1097/00002820-200603000-00003. [DOI] [PubMed] [Google Scholar]
- 48.Egea CJ, Aizpuru F, Pinto JA, et al. Cardiac function after CPAP therapy in patients with chronic heart failure and sleep apnea: a multicenter study. Sleep Medicine. 2008;9(6):660–666. doi: 10.1016/j.sleep.2007.06.018. [DOI] [PubMed] [Google Scholar]
- 49.Friedman JI, Wallenstein S, Moshier E, et al. The effects of hypertension and body mass index on cognition in schizophrenia. American Journal of Psychiatry. 2010;167(10):1232–1239. doi: 10.1176/appi.ajp.2010.09091328. [DOI] [PubMed] [Google Scholar]
- 50.Sabia S, Kivimaki M, Shipley MJ, Marmot MG, Singh-Manoux A. Body mass index over the adult life course and cognition in late midlife: the Whitehall II Cohort Study. American Journal of Clinical Nutrition. 2009;89(2):601–607. doi: 10.3945/ajcn.2008.26482. [DOI] [PMC free article] [PubMed] [Google Scholar]
- 51.Almeida OP, Tamai S. Congestive heart failure and cognitive functioning amongst older adults. Arquivos de Neuro-Psiquiatria B. 2001;59(2):324–329. doi: 10.1590/s0004-282x2001000300003. [DOI] [PubMed] [Google Scholar]
- 52.Hoth KF, Poppas A, Moser DJ, Paul RH, Cohen RA. Cardiac dysfunction and cognition in older adults with heart failure. Cognitive and Behavioral Neurology. 2008;21(2):65–72. doi: 10.1097/WNN.0b013e3181799dc8. [DOI] [PubMed] [Google Scholar]
- 53.Festa JR, Jia X, Cheung K, et al. Association of low ejection fraction with impaired verbal memory in older patients with heart failure. Archives of Neurology. 2011;68(8):1021–1026. doi: 10.1001/archneurol.2011.163. [DOI] [PubMed] [Google Scholar]
- 54.Putzke JD, Williams MA, Daniel FJ, Foley BA, Kirklin JK, Boll TJ. Neuropsychological functioning among heart transplant candidates: a case control study. Journal of Clinical and Experimental Neuropsychology. 2000;22(1):95–103. doi: 10.1076/1380-3395(200002)22:1;1-8;FT095. [DOI] [PubMed] [Google Scholar]
- 55.Putzke JD, Williams MA, Rayburn BK, Kirklin JK, Boll TJ. The relationship between cardiac function and neuropsychological status among heart transplant candidates. Journal of Cardiac Failure. 1998;4(4):295–303. doi: 10.1016/s1071-9164(98)90235-4. [DOI] [PubMed] [Google Scholar]
- 56.Vukovic J, Colditz MJ, Blackmore DG, Ruitenberg MJ, Bartlett PF. Microglia modulate hippocampal neural precursor activity in response to exercise and aging. The Journal of Neuroscience. 2012;32(19):6435–6443. doi: 10.1523/JNEUROSCI.5925-11.2012. [DOI] [PMC free article] [PubMed] [Google Scholar]