

Abstract
Background
Proteomic profiling of an experimental tumor metastasis model has the potential to identify gene products that can influence this fatal phenotype of tumor cells. In this study, we focused on the notoriously difficult to assess ribosomal protein component of a pair of cell lines which originate from the same tumor but have opposite metastatic capabilities.
Materials and Methods
Cell lysate proteins were separated using a two-dimensional liquid chromatographic system directly coupled to an ESI-TOF mass spectrometer for accurate intact protein MW analysis. Characterization of distinct post-translational modifications and sequence variation within several ribosomal proteins was obtained using monolithic capillary LC/MS/MS, MALDI-MS and -MS/MS.
Results
The combination of these techniques enabled the identification of 45 unique ribosomal proteins, several of which were differentially expressed in metastatic M4A4 cells.
Conclusion
The described proteomic profiling approach enables the identification of phenotype-associated ribosomal proteins for subsequent functional analyses and disease biomarker development.
Keywords: Ribosomal proteins, cancer biomarkers, electrospray ionization time-of-flight mass spectrometry, liquid chromatography, monolith
The essential cellular activity of translation of mRNA into protein is mediated at the ribosome, a macromolecular complex composed of ribonucleic acids and proteins (1). In mammalian cells the ribosome is comprised of two major subunits of 40S and 60S and components include 4 ribosomal RNAs (rRNAs) and some 82 proteins (2–4). These ribosomal proteins stabilize rRNA structure, regulate catalytic function, and through protein-protein interactions integrate translation with other cellular processes (1, 2). Given the pivotal role of these proteins in the translation of genetic expression into functional phenotype, it is not surprising that recent studies have implicated ribosomal proteins not only as targets of tumor suppressors or proto-oncogenes (5), but also as more direct mediators of aspects of tumor progression (6–8). Accordingly, several ribosomal proteins have been investigated as potential biomarkers in some cancer types (9). The detailed characterization of this class of proteins in mammalian cells of malignant phenotype will broaden our understanding of their role in cancer progression mechanisms. However, due to their small size and basic nature, ribosomal proteins are particularly difficult to profile within the total proteome.
We have recently developed novel two-dimensional liquid phase separation techniques and successfully applied these to human cancer proteomes to effectively separate intact proteins from very complex mixtures (10–14). Subsequently, comprehensive MS analysis on the separated proteins has identified several candidate biomarkers of specific cancer types (15). We have demonstrated that liquid-phase chromatofocusing, in particular, provides outstanding separation characteristics to fractionate intact proteins for convenient interfacing with other analytical techniques (13–15). In the present work, we utilize this approach to characterize the ribosomal protein component of a human tumor metastasis model. In order to facilitate the investigation of the multi-step process of tumor metastasis we have isolated spontaneously occurring monoclonal sublines of the MDA-MB-435 tumor cell line which exhibit many phenotypic differences in growth, invasion, dissemination and spontaneous metastatic efficiency in vivo (16). The common origin of these cell lines enables the comparative investigation of cellular and molecular events in the metastatic process in a stable and isogenic model (17).
The analytical approach employed here fractionates proteins based upon isoelectric point (pI) in the first dimension by chromatofocusing (CF), and each fraction is subsequently separated based upon polarity of the protein in the second dimension by nonporous reversed-phase high-performance liquid chromatography (NPS RP-HPLC). The protein eluants from RP-HPLC are directed online to electrospray ionization time-of-flight mass spectrometry (ESI TOF-MS) to obtain an accurate and reproducible protein intact molecular weight. Purified proteins are also collected and stored for further analysis by peptide mapping using matrix-assisted laser desorption-ionization TOF MS (MALDI-TOF MS). The combination of these methods enables high accuracy protein profile comparisons between biological samples and enables the elucidation of peptide-specific alterations.
Comparative analysis of the two cell lines identified 45 unique ribosomal proteins, many with multiple post-translational modifications. An almost unidirectional increase in the expression of several ribosomal proteins was apparent in the metastatic M4A4 cells. This study describes an efficient analytical approach which greatly facilitates the unbiased assessment of intact ribosomal proteins in human cells. The findings extend recent reports which implicate ribosomal proteins in cancer-associated signaling and translational control mechanisms, and identify ribosomal proteins associated with a metastatic phenotype for subsequent functional analyses and disease biomarker development.
Materials and Methods
Preparation of human cancer cell lines
Preparation of human tumor cell lines M4A4 and NM2C5 derived from MDA-MB-435 cell line has been described elsewhere (9, 18). Briefly, cell lines were maintained as subconfluent monolayer cultures in RPMI 1640 medium (Gibco-BRL, Grand Island, NY, USA) supplemented with 10% fetal calf serum at 37°C under 5% CO2/95% air. The medium was exchanged every third day and passaging was performed when approximately 75% confluency was reached. In order to limit any potential biological variability, analyses were performed on cultures passaged no more than ten times from frozen stock vials designated passage 1 at the time of initial monoclonal expansion. Cell lines were cultured under parallel conditions such that feeding and passaging regime, confluency, and all serum/media batches remained identical for both cell lines.
Chromatofocusing
Approximately 90 million cells were used for each protein preparation. Frozen cell pellets were thawed and mixed with lysis buffer composed of 6 M urea, 2 M thiourea, 2% w/v n-octyl β-D-glucopyranoside (19), 5 mM TCEP, 1 mM PMFS, 10% v/v glycerol, and 10 mM Tris (all from Sigma, St. Louis, MO, USA). Upon lysis at RT for 30 min, the sample was centrifuged at 35000 rpm for 1 hr at 4 AC. Protein concentration was measured using a Bradford assay kit (Bio-Rad, Hercules, CA, USA). Prior to a weak anion exchange-based CF fractionation, the lysis buffer in the whole cell lysate was replaced by a start buffer (SB) composed of 25 mM bis-tris propane (Sigma), 6 M urea, and 0.2% w/v OG using a PD-10 column (Amersham Biosciences, Piscataway, NJ, USA). CF experiment was performed using a Beckman System Gold model 127 pump and 166 UV detector module (Beckman Coulter, Fullerton, CA, USA) with a HPCF-1D prep column (4.6×250 mm, Eprogen, Darien, IL, USA). A linear pH gradient was generated using a combination of SB and elution buffer (EB) containing 6 M urea, 0.2% OG, and 10% polybuffer 74 (Amersham Biosciences). Saturated iminodiacetic acid (Sigma) was used to adjust the pH of the SB at 7.2 and EB at 3.9 and the column was equilibrated in SB until the pH of the column was the same as SB using a pH-flow cell (Lazar Research Laboratories, Los Angeles, CA, USA). Upon equilibration, ca. 2.5 mg of buffer-exchanged sample was loaded onto the column at a low flow rate. Solvent flow was then switched to EB and the flow rate was set to 1 mL/min for fraction collection at the intervals of 0.2 pH units along the linear gradient, where the elution profile was recorded at 280 nm. One microgram of bovine insulin (Sigma) was added to the CF fractions under analysis as an internal standard to enable relative quantitation of proteins to compare their expression levels between human tumor cell lines M4A4 and NM2C5. At the end of the gradient, the column was flushed with 1 M sodium chloride (Sigma) to remove proteins still bound. All collected samples were stored at −80°C until further analysis.
Reversed phase HPLC protein separation and Tryptic digestion
Proteins fractionated by CF were further separated by a nonporous (NPS)-RP-HPLC column (4.6×33 mm, Eprogen) packed with 1.5 μm C18 ODSIIIE silica beads using a HPLC System Gold (Beckman Coulter). Protein of selected pH fractions was loaded for separation utilizing the following gradient where solvents A and B were comprised of 0.1% trifluoroacetic acid (TFA, Sigma) in DI water and acetonitrile (ACN, Sigma), respectively; 5–15% B in 1 min, 15–25% B in 2 min, 25–31% B in 3 min, 31–41% B in 10 min, 41–47% B in 3 min, 47–67% B in 4 min, 67–100% B in 1 min, 100% B in 2 min, and 100-5% B in 1 min at a flow rate of 0.5 mL/min. The protein separation was monitored at 214 nm for off-line collection using a fraction collector (SC-100, Beckman Coulter) controlled by acquisition program built in-house. The collected proteins were dried down completely by SpeedVac (model SC210A, Thermo Electron, Marietta, OH) and subjected to enzymatic digestion by adding 50 μL of 50 mM ammonium bicarbonate (Sigma) and 0.5 μg of TPCK-modified trypsin of sequencing grade (Promega, Madison, WI) for incubation at 37°C for 18 hr. Each of the tryptic digest mixtures was added with 1 μL of 10% TFA to halt digestion and stored at −80°C until further analysis.
HPLC/ESI-TOF MS
NPS-RP-HPLC separation was also interfaced on-line with ESI-TOF MS (LCT, Waters-Micromass, Manchester, UK) by injecting CF-separated proteins using the same chromatographic conditions described in the previous section, except that 0.1% TFA was substituted by 0.3% formic acid (Sigma). A flow splitter was used to deliver 40% of the eluent to the LCT with the following parameters: capillary voltage at 3200 V, sample cone voltage at 40 V, and extraction cone voltage at 3 V. The desolvation temperature was set at 300°C with a nitrogen gas flow of 650 L/hr, while the source temperature was at 120°C. The intact MW was obtained by deconvolution utilizing MassLynx software version 4.0 (Waters-Micromass).
MALDI-TOF MS and data analysis
The tryptically digested proteins were desalted using C18 ZipTips (Millipore, Bedford, MA) to concentrate peptide mixtures in 5 μL of 60% ACN and 0.5% TFA. A matrix solution was prepared by diluting saturated α-cyano-4-hydroxycinnamic acid (α-CHCA, Sigma) solution with 60% ACN and 0.1% TFA at 1:4 ratio added with the internal standards, including angiotensin I, adrenocorticotropic hormone (ACTH) fragment 1–17, and ACTH 18–39 (all from Sigma). The matrix solution was spotted on the MALDI plate so that each well contained 50 fmol of each of the internal standards, followed by layering 1 μL of the desalted sample on top. The Micromass TofSpec 2E was used in the reflectron mode with a nitrogen laser (337 nm) ionization source. The instrument was operated in the positive ion mode with an operating voltage at 20 kV, an extraction voltage at 19.98 kV, and the pulse voltage at 2300 V. All spectra acquired over the mass range of 500 to 4000 Da were combined for internal calibration and post-processed using MassLynx software to obtain monoisotopic peptide masses for submission to the MS-Fit search engine (http://prospector.ucsf.edu). The search was performed against the SwissProt database under the species of Homo sapiens by allowing the following parameters; one missed cleavage, mass tolerance of 50 ppm or less, no limitations set for MW and pI ranges, and possible modifications including N-terminal Gln to pyroGlu, oxidation of M, N-terminal acetylation, and phosphorylation of S, T and Y.
MALDI-Quadrupole Ion Trap (QIT)-TOF MS and data analysis
The MALDI-QIT-TOF MS (AXIMA-QIT, Shimadzu-Biotech, Manchester, UK) was used to perform MS/MS of selected peptides. Samples prepared for MALDI-TOF MS analysis were used. 0.5 μL of the desalted peptide mixtures desalted by C18 ZipTips were deposited on the MALDI target plate along with 0.5 μL of the matrix solution of 2,5-dihydroxybenzoic acid (DHB; Sigma) at a concentration of 20 mg/mL in 0.1% TFA and 60% ACN. The MALDI-QIT-TOF MS was externally calibrated using a mixture of bradykinin fragment 1–7, angiotensin II, P14R, ACTH fragment 18–39, and insulin chain B (all from Sigma) to obtain the mass tolerance of 10 ppm. The standard instrument settings for optimum transmission at medium mass were used to record all mass spectra in this work. Data acquisition and processing were performed using Kompact LAUNCHPAD™ software (Shimadzu) and the ion masses were submitted to the Mascot MS/MS ions search (http://www.matrixscience.com), where search was performed under SwissProt database with the following parameters: (1) species of Homo sapiens, (2) one missed cleavage, (3) possible modifications of peptide N-terminal Gln to pyroGlu, oxidation of Met, N-terminal acetylation and phosphorylation of S, T, and Y, (4) peptide mass tolerance of ±1 Da, (5) MS/MS tolerance of ±0.9 Da, and (6) peptide charge of +1.
Monolithic capillary LC/MS/MS and data analysis
The Ultra-Plus II MD capillary pump module (Micro-Tech Scientific, Vista, CA, USA) was used for on-line monolithic capillary LC/MS/MS. A monolithic column (200 μm × 60 mm) was prepared by copolymerizing styrene and divinylbenzene (PS/DVB) according to the procedure described elsewhere (19). The solvent system was comprised of two solvents of A and B, where 0.05% formic acid was added to HPLC grade water and ACN, respectively. The capillary column was directly connected to a micro-injector (Valco Instruments, Houston, TX, USA) and the flow was split pre-column to generate ca. 2.5 μL/min. The tryptic digests of each individual ribosomal protein were analyzed by rapid monolithic LC/MS/MS by applying a gradient of 0 to 100% B in 18 min. A linear ion trap MS (LTQ, Thermo Finnigan, San Jose, CA, USA) was used to sequence the tryptic peptides. The capillary transfer tube was set at 175°C and the ESI voltage at +4 kV. A sheath nitrogen gas flow of 12 arbitrary units was used and ion activation was achieved with ultra-high purity helium (all from Cryogenic Gases, Detroit, MI, USA) at a normalized collision energy of 35%. All tandem mass spectra were analyzed by TurboSequest of Bioworks software version 3.1 SR1 (Thermo Finnigan) with SwissProt database under the species of Homo sapiens. The database searching allowed a maximum number of two missed cleavages to consider fully tryptic peptides assigned with Xcorr values of the following; ≥1.5 for singly charged ions, ≥2.5 for doubly charged ions, and ≥3.5 for triply charged ions, while no ions at higher charged states were considered. Also, ΔCn ≥0.1 was considered regardless of the charge states.
Results
Liquid phase fractionation
Previous studies have utilized sucrose gradient procedures followed by MALDI-TOF MS to investigate ribosomal proteins (RPs), however, there are problems associated with non-specific co-purification of proteins during this extraction strategy (20), and such studies analyze peptide mixtures through sequencing at the expense of information retained within intact protein. If it is feasible, and especially in a disease model, it is preferable to fractionate the entire native proteome and then to focus on specific classes of proteins for more detailed downstream analysis. The liquid-phase 2D separation strategy employed here was designed to maintain the cellular context and avoid potential misclassification or loss of RP-associated factors. Soluble proteins from lysed cells were separated by their pI in the first dimension using chromatofocusing (CF), and the second dimension employed a nonporous reversed-phased HPLC separating proteins according to their hydrophobicity. Eluent from the NPS-RP-HPLC step was split post-column for direct introduction to ESI-TOF MS and to a UV detector for fraction collection for off-line analysis by peptide mass fingerprinting (PMF) or MS/MS. The two-dimensional fractionation of the whole proteins prior to protein or peptide analysis allows the tryptic digest peptides to be directly associated with a protein mass, increasing the confidence of an assignment, and the combination of these methods enabled high accuracy protein profile comparisons between the isogenic tumor cell line samples. Figure 1 shows a reversed phase HPLC chromatogram for pH fraction 6.0–6.2 obtained from the fractionation of the metastatic M4A4 cancer cell line protein lysate. The majority of ribosomal proteins eluted early in separation due to their less hydrophobic nature, a phenomenon exaggerated by the small size of this family of proteins. The 15 ribosomal proteins identified by subsequent analysis of this particular fraction are displayed above the appropriate peaks in Figure 1.
Figure 1.

NPS-RP-HPLC chromatogram of pH fraction 6.0–6.2 with identified ribosomal proteins annotated.
Mass spectrometric analysis of ribosomal proteins
Previous work on ribosomal protein characterization has relied heavily on the use of MALDI-TOF MS for intact MW estimation (21). MALDI analysis using linear TOF MS is a rapid method for the determination of protein mass (8, 22), but the technique generates mass spectra consisting exclusively of singly charged ions, and so it is limited by poor mass resolution (22, 23). Furthermore, protein identifications based solely on MALDI-TOF MS can be tentative as they are typically performed only by intact protein MW match. To confirm the proposed identities and post-translational modifications in this study, a series of experiments based on enzymatic digests were performed. Protein fractions collected from NPS-RP HPLC were enzymatically digested and analyzed by MALDI-TOF MS for protein identification by PMF. In cases of ambiguity of PMF protein identifications, we performed MS/MS analysis using capillary monolith liquid chromatography separation of tryptic digests of proteins isolated from the liquid separations, with on-line detection by linear ion trap MS. Occasionally, the tryptic peptide sequences that were not detected/or performed by the monolith-based LC/MS/MS methods were successfully sequenced by MALDI-QIT-TOF MS. The integration of information obtained at both protein and peptide levels enables a comprehensive analysis of the protein complement under study (15).
A total of 45 ribosomal proteins were identified by the combination of techniques applied to fractions obtained from both the metastatic M4A4 and non-metastatic NM2C5 cell lines. The comparisons of theoretical and experimental intact protein MW values for the 45 unique ribosomal proteins are listed in Table I, and Tables II and III detail confirmatory PMF and sequencing data of these proteins. Data on most of the ribosomal proteins revealed a close match between the theoretical and experimental MW values, implying that major post-transalational modifications are not commonly present. The most common reported modification is removal of the N-terminal methionyl residue by N-terminal methionine aminopeptidase, a metalloendopeptidase that specifically removes methionine residues (24). Of the 45 unique ribosomal proteins, 28% were identified by direct matches with the theoretical masses. When the theoretical intact MW values of the were calculated assuming the removal of the first methionine residue, excellent agreement was observed with the experimentally determined intact MW values for the majority of ribosomal proteins. The majority of the other ribosomal proteins were identified by subtracting the residue mass of methionine from the theoretical mass, however, significant deviations between the theoretical and experimental MW values of specific ribosomal proteins were revealed (Table I). The most dramatic was a deviation of > 5000 Da was observed for the 39S ribosomal protein L40. One explanation for this deviation is the possible truncation of the signal peptide. The L40 signal peptide consists of 46 amino acids, and truncation of this moiety would result in a MW of 19242 Da. This MW value closely matches (within ca. 100 ppm) the experimental MW accurately obtained from ESI-TOF MS.
Table I.
Comparison of theoretical and experimental pI and intact MW values obtained for ribosomal proteins separated from human cancer cell lines M4A4 and NM2C5.
| Protein ID | Accession No. | Removal of Met | pI
|
Theoretical MWa | Experimental MWb
|
||
|---|---|---|---|---|---|---|---|
| Theo. | Exp. | M4A4 | NM2C5 | ||||
| 39S ribosomal proteins | |||||||
| L13 | Q9BYD1 | 9.18 | 6.2-6.0 | 20692 | 20604 | n.d. | |
| L40 | Q9NQ50 | 9.62 | 5.8-6.0 | 24491 | 19240 | n.d. | |
| 40S ribosomal proteins | |||||||
| S3a | P61247 | ✓ | 9.75 | 6.2-6.0 | 29814 | 29868 | n.d. |
| S4 X isoform | P62701 | ✓ | 10.16 | 6.2-6.0 | 29476 | 29510 | 29511 |
| S6 | P62753 | 10.85 | 6.4-6.2 | 28681 | 28735 | n.d. | |
| S8 | P62241 | ✓ | 10.32 | 6.0-5.8 | 24074 | 24076 | n.d. |
| S9 | P46781 | ✓ | 10.66 | 6.0-5.8 | 22460 | 22463 | 22461 |
| S10 | P46783 | 10.15 | 6.4-6.2 | 18898 | 18956 | 18957 | |
| S13 | P62277 | ✓ | 10.53 | 6.2-6.0 | 17901 | 17093 | 17902 |
| S15 | P62841 | ✓ | 10.39 | 6.2-6.0 | 16909 | 16953 | 16953 |
| S15a | P62244 | ✓ | 10.14 | 5.8-5.6 | 14708 | 14710 | n.d. |
| S16 | P62249 | ✓ | 10.21 | 6.2-6.0 | 16314 | 16315 | 16316 |
| S17 | P08708 | ✓ | 9.85 | 6.2-6.0 | 15419 | 15420 | n.d. |
| S18 | P62269 | 10.99 | 6.2-6.0 | 17719 | 17631 | 17631 | |
| S19 | P39019 | ✓ | 10.31 | 6.4-6.2 | 15920 | 15930 | n.d. |
| S23 | P62266 | 10.50 | 6.0-5.8 | 15676 | 15684 | n.d. | |
| S24 | P62847 | 10.79 | 6.2-6.0 | 15423 | 15468 | 15468 | |
| S26 | P62854 | ✓ | 11.01 | 6.0-5.8 | 12884 | 12906 | 12883 |
| S29 | P62273 | 10.16 | 6.4-6.2 | 6546 | 6545 | n.d. | |
| S30 | P62861 | ✓ | 12.15 | 6.8-6.6 | 6648 | 6648 | n.d. |
| 60S ribosomal proteins | |||||||
| L3 | P39023 | ✓ | 10.19 | 6.0-5.8 | 45978 | 46041 | 46036 |
| L4 | P36578 | 11.07 | 5.8-5.6 | 47697 | 47658 | 47655 | |
| L5 | P46777 | ✓ | 9.73 | 6.0-5.8 | 34231 | 34235 | n.d. |
| L6 | Q02878 | ✓ | 10.59 | 6.0-5.8 | 32597 | 32599 | 32599 |
| L7a | P62424 | ✓ | 10.61 | 6.2-6.0 | 29864 | 29853 | 29847 |
| L8 | P62917 | ✓ | 11.04 | 6.4-6.2 | 27893 | 27953 | n.d. |
| L10 | P27635 | ✓ | 10.11 | 6.4-6.2 | 24445 | 24572 | n.d. |
| L12 | P30050 | 9.48 | 6.2-6.0 | 17808 | 17758 | n.d. | |
| L13 | P26373 | ✓ | 11.65 | 5.8-5.6 | 24130 | 24133 | 24132 |
| L13a | P40429 | ✓ | 10.94 | 6.2-6.0 | 23446 | 23492 | 23492 |
| L14 | P50914 | ✓ | 10.94 | 6.4-6.2 | 23159 | 23532 | n.d. |
| L17 | P18621 | ✓ | 10.18 | 6.4-6.2 | 21266 | 21310 | n.d. |
| L18a | Q02543 | 10.72 | 6.2-6.0 | 20762 | 20806 | 20827 | |
| L21 | P46778 | ✓ | 10.49 | 6.2-6.0 | 18434 | 18436 | 18435 |
| L23a | P62750 | 10.44 | 6.2-6.0 | 17695 | 17607 | 17607 | |
| L24 | P83731 | 11.26 | 6.2-6.0 | 17779 | 17783 | 17781 | |
| L26 | P61254 | 10.55 | 6.2-6.0 | 17258 | 17260 | 17260 | |
| L27 | P61353 | ✓ | 10.56 | 6.2-6.0 | 15667 | 15666 | 15666 |
| L27a | P46776 | ✓ | 11.00 | 6.0-5.8 | 16430 | 16648 | 16647 |
| L28 | P46779 | ✓ | 12.02 | 6.0-5.8 | 15616 | 15670 | 15700 |
| L35 | P42766 | ✓ | 11.04 | 6.2-6.0 | 14420 | 14421 | 14422 |
| L35a | P18077 | 11.07 | 6.4-6.2 | 12536 | 12450 | n.d. | |
| L36 | Q9Y3U8 | ✓ | 11.59 | 6.2-6.0 | 12123 | 12124 | 12125 |
| L37a | P61513 | ✓ | 10.44 | 6.4-6.2 | 10144 | 10144 | n.d. |
| L39 | P62891 | 12.55 | 6.0-5.8 | 6275 | n.d | 6276 | |
Theoretical MW calculated assuming Met residue removed.
n.d., denotes not detected.
Table II.
Identification of ribosomal proteins through PMF analysis.
| Protein ID | Accession No. | % Coverage | MOWSE score |
|---|---|---|---|
| 39S ribosomal proteins | |||
| L13 | Q9BYD1 | 81 | 2.97E+04 |
| L40 | Q9NQ50 | 28 | 1334 |
| 40S ribosomal proteins | |||
| S3a | P61247 | 31 | 666 |
| S4 X isoform | P62701 | 38 | 3.30E+04 |
| S8 | P62241 | 42 | 8.77E+05 |
| S9 | P46781 | 21 | 1334 |
| S10 | P46783 | 41 | 7.46E+04 |
| S13 | P62277 | 33 | 2230 |
| S15 | P62841 | 51 | 6.85E+04 |
| S15a | P62244 | 41 | 4192 |
| S16 | P62249 | 47 | 3863 |
| S17 | P08708 | 19 | 457 |
| S18 | P62269 | 32 | 2943 |
| S26 | P62854 | 33 | 3132 |
| 60S ribosomal proteins | |||
| L3 | P39023 | 22 | 4.86E+06 |
| L4 | P36578 | 13 | 306 |
| L6 | Q02878 | 44 | 3.30E+04 |
| L7a | P62424 | 14 | 687 |
| L13 | P26373 | 39 | 3.43E+04 |
| L18a | Q02543 | 45 | 405 |
| L21 | P46778 | 35 | 1591 |
| L23a | P62750 | 30 | 479 |
| L24 | P83731 | 33 | 253 |
| L26 | P61254 | 34 | 315 |
| L27 | P61353 | 57 | 8820 |
| L27a | P46776 | 29 | 1426 |
| L35 | P42766 | 26 | 566 |
| L36 | Q9Y3U8 | 49 | 1679 |
Table III.
Identification of ribosomal proteins through MS sequencing.
| Protein ID | Accession No. | Tryptic Peptides Sequenced**
|
|
|---|---|---|---|
| LC/MS/MS (amino acid): Mascot score | MALDI-MS/MS (amino acid): Mascot score | ||
| 40S ribosomal proteins | |||
| S3a* | P61247 | (65–81): 45 | |
| S4 X isoform* | P62701 | (198–210), (211–220), (221–229), (230–239): 124 | |
| S6 | P62753 | (120–131): 19 | |
| S8* | P62241 | (26–30), (26–36), (49–53), (128–138), (128–139), (157–169), (170–183), (184–192), (193–199) | (77–91): 46 |
| S10* | P46783 | (81–95), (140–153): 102 | |
| S13* | P62277 | (9–18), (42–54), (43–54), (78–92), (114–120): 87 | |
| S15* | P62841 | (65–76), (81–99) | |
| S16* | P62249 | (4–14): 36 | |
| S19 | P39019 | (7–15): 19 | |
| S24 | P62847 | (1–8), (69–83): 194 | (50–61): 38 |
| S26* | P62854 | (15–21), (28–33), (42–50), (51–65) | (51–65), (100–114): 55 |
| S29 | P62273 | (1–11): 20 | |
| 60S ribosomal proteins | |||
| L3* | P39023 | (10–18), (50–57), (103–114), (120–126), (160–168), (261–267), (286–293), (300–311), (342–347), (348–355), (349–355), (378–384) | (10–18): 16 |
| L5 | P46777 | (164–177): 89 | |
| L7a* | P62424 | (37–47), (75–88): 45 | |
| L8 | P62917 | (128–143): 92 | |
| L10 | P27635 | (116–127), (145–152): 47 | |
| L12 | P30050 | (100–114): 73 | |
| L13* | P26373 | (5–15), (145–157): 75 | (21–30), (74–81), (105–115), (123–128) |
| L13a | P40429 | (1–11): 15 | |
| L14 | P50914 | (23–34), (142–157): 38 | |
| L17 | P18621 | (3–12), (105–120), (153–166): 187 | |
| L18a* | Q02543 | (44–52). (77–83): 44 | |
| L21* | P46778 | (122–128), (142–159), (146–159): 89 | (21–31), (63–77): 78 |
| L23a* | P62750 | (7–14), (42–47), (69–78), (71–78), (79–88), (115–123), (116–123), (124–134), (124–135), (140–152), (140–156): 46 | |
| L24* | P83731 | (81–93): 66 | (28–35), (48–56), (81–93): 29 |
| L26* | P61254 | (3–11), (52–59): 51 | |
| L27* | P61353 | (73–83), (128–132): 70 | (9–16): 66 |
| L27a* | P46776 | (21–25), (42–56), (37–54), (94–104), (119–124) | |
| L28 | P46779 | (1–10), (22–32), (58–64): 138 | |
| L35a | P18077 | (9–15), (37–45): 67 | |
| L37a | P61513 | (17–22), (62–79): 109 | |
Also analyzed by PMF analysis, see Table II.
Proteins without Mascot score analyzed by TurboSequest (Thermo Finnigan).
Several ribosomal proteins exhibited small, but noticeable, deviations between experimental and intact MW values. For example, the experimental intact MW of 40S ribosomal protein S24 was found to be 45 Da greater than what is theoretically expected. When this protein underwent tryptic digestion and analysis by monolithic capillary LC/MS/MS, it was observed that the tryptic peptide of MNDTVTIR (1–8) had a shift of +42 Da from the fragment ions generated from the N-terminal end (Figure 2). This shift is a signature of N-terminal acetylation, and the actual theoretical MW of this protein closely matches the experimentally determined intact MW value when this PTM is accounted for. Notably, the gene that encodes the S24 protein has been reported to produce differentially spliced mRNAs that result in two distinct isoforms (25). S24 isoform-2 has one Glu residue missing from the C terminal end of the complete isoform-1 and results in a theoretical MW of 15294 Da. Our accurate intact mass determination obtained from on-line LC/ESI-TOF MS unambiguously assigns isoform-1 as the mature form of the S24 protein present in this sample. N-terminal acetylation is the most widely recognized PTM that occurs in the cytoplasmic ribosomal protein family (24) Other examples of this phenomenon were observed for 60S ribosomal proteins L21 and L13a. In the latter case, MALDI-qIT-TOF MS successfully sequenced the tryptic peptide containing the N-terminal acetylation, AEVQVLVLDGR (1–11) (Figure 3).
Figure 2.
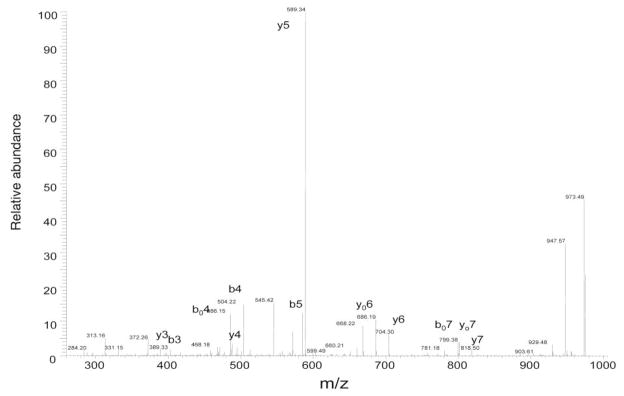
Monolithic LC/MS/MS of tryptic peptide, MNDTVTIR (1–8), from ribosomal protein S24.
Figure 3.
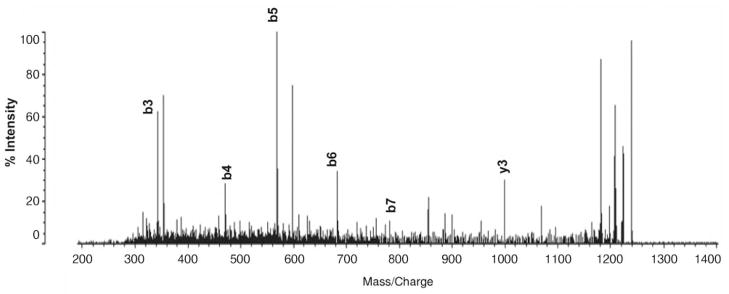
MALDI-MS/MS tryptic peptide, AEVQVLVLDGR (1–11), from 60S ribosomal protein L13a.
In a previous study of mammalian ribosomal proteins, the 40S ribosomal protein S10 was reported to contain a potential extra glycine residue at the glycine-rich C-terminal region (154–165: GGFGRGRGQPPQ), resulting in a higher experimental MW value (26). It is interesting to note that a similar observation was made in this study, where the experimental MW value of 40S ribosomal protein S10 was 59 Da higher than the theoretical MW value. An extra glycine residue of 57 Da could account for the observed deviation, however, no peptide sequence that reflected this variation was observed in this study. It is possible that this alteration in peptide sequence may not have been detectable within the mass range of tandem MS used in this analysis, so further detailed study at the peptide level will be required to confirm this observation.
Differential expression of RPs in the metastasis model
A number of ribosomal proteins were found to be significantly differentially expressed in the MDA-MB-435 human tumor metastasis model. While there were minor differences in the levels of several ribosomal proteins, here we focus on the absence/presence of specific ribosomal proteins. Notably, the differential expression of RPs was virtually unidirectional. Eighteen ribosomal proteins were confirmed to be present in M4A4 metastatic tumor cells but absent in the isogenic NM2C5 non-metastatic tumor cells (Table I). Only one RP (60S RPL39) was absent from M4A4 cells and present in NM2C5 (Table I). The absence call is of course related to the sensitivity of the detection techniques employed, but the methods used in tis study enable us to detect as little as 50 pg (~100 fmoles) of a 40 kDa protein (27) which is comparable to silver staining methods. When the RP has been detected in one sample but not the other, it is either absent, at levels below 50 pg, or aberrantly translated or modified to such an extent as to escape the initial ESI-TOF assignment and thus further analysis. Supporting evidence for the absence of specific RPs in NM2C5 cells comes from our previous RNA-based microarray analyses of the model (17). It is interesting that the absence of a number of RPs does not entirely affect the function of the NM2C5 cells, which, while not metastatic, remain robustly proliferative in vitro and tumorigenic in vivo.
Discussion
The fact that it is not necessary to express the complete repertoire of available RP gene products for cell viability is becoming realized, and a potential role for RPs in carcinogenesis and tumor progression is being founded on the idea that subsets of gene families are translationally regulated by specific RP complexes (8). Furthermore, recent studies have shown that many ribosomal proteins have extra-ribosomal cellular functions independent of protein biosynthesis (28, 29). Due to their small size and basic nature, RPs are difficult to characterize in complex samples, but by focusing on specific RP’s, a few articles have reported the differential expression of RPs in tumor models and human tumor tissue specimens. The 60S RPL32 and the 40S RPS16 were identified as differentially expressed in a model that recapitulates the progression to an androgen-independent state of prostate tumor cells (30), and proteomic profiling of malignant and benign prostate tissue specimens identified 39S RPL12 as being overexpressed in cancer samples (31). One study that specifically measured a subset of 12 RPs in human colorectal mucosa identified RPS11 and RPL7 as being downregulated in colorectal cancer and their data suggested that this correlated with a state of dedifferentiation often seen in malignant cells (32). The loss of specific RPs, as exemplified in the case of L39 in M4A4 cells, may be as important as the gain of RPs in progression to a more aggressive cellular phenotype.
One of the mechanisms of oncogenic cellular transformation and/or maintenance appears to be the differential recruitment of mRNAs to ribosomes (8). This relatively recent observation adds to the points of potential regulation that determine the transfer of genetic information into the proteome and phenotype, and may play a pivotal role in the sensing of the extracellular environment that in many ways defines metastatic tumor cells. Of the RPs identified here to be expressed differentially in metastatic M4A4 cells, several have been associated with cancer either through tissue profiling, or as factors in cancer-associated signal transduction pathways and translational control.
Studies suggest that RPL13 plays an essential role in the progression of some gastrointestinal malignancies. Increased expression of RPL13 is observed in a significant number of gastric and colorectal cancer tissues relative to adjacent normal tissue samples, and the level of expression correlates with clinical staging in gastric cancers (28). Knockdown of L13 expression causes attenuation of cancer cell growth with significant G1 and G2/M arrest of the cell cycle, and significantly enhances the cellular sensitivity to certain DNA damaging agents. A role for L13 in transcript-specific translational control has been elucidated. In response to interferon-gamma, the entire cellular pool of L13 is phosphorylated and released from the 60S ribosomal subunit. The free L13 binds to a specific 3′-UTR element of target mRNA’s and silences translation (29). Ribosomal protein L35 may also be involved in tumor cell resistance and cellular response to cytotoxic damage. Cells engineered to overexpress L35a protein are more resistant to a panel of apoptosis-inducing reagents (33). In line with this potential role, L35a is overexpressed in glioblastoma multiforme (GBM) brain tumors (34), a type of cancer that is particularly resistant to chemotherapy and radiation treatment. The enhanced expression of RPS3a has also been recognized in both cancer cell lines and tumors (35). Conversely, the down-regulation of S3a has been shown to result in neuronal and prostate cellular differentiation and cell growth arrest (35, 36). The best studied of the ribosomal proteins with respect to cancer-associated signal transduction pathways is the 40S ribosomal subunit protein S6. Mammalian S6 is phosphorylated in response to multiple external signals, which are transduced through the phosphatidylinositol 3-kinase (PI3-kinase)/mTOR pathway (37). Given the central role of these pathways in proliferation and cell cycle, S6 and its kinase (S6K) are coming under scrutiny in the control of oncogenic phenotypes. A prevailing model has implicated S6 phosphorylation in translational control of a specific class of mRNAs, referred to as TOP (terminal oligopyrimidine tract in the 5′UTR) mRNA (38). TOP mRNAs are stored in inactive translational particles and shift to actively translating polysomes upon mitogenic stimulation and these mRNAs are enriched in proto-oncogenes with cancer promoting functions (39). Clinical trials of mTOR inhibition for cancer are already under way, but given the sensitivity of ribosomal proteins to antibiotics, it is feasible that S6 and other RPs may become more potent downstream targets for the amelioration of malignant tumors.
All of the above examples appear to fit the profile observed in M4A4 cells in this study. It appears that ribosome populations are heterogeneous and that a subset of RPs may be responsible for the translation of oncogenic mRNA’s in response to signals that enhance cell growth, dedifferentiation and resistance to cytotoxic damage. The comparison of the overall profiles of RPs in other tumor models will help to define which tightly correlate with a more aggressive phenotype, and which subsets of genes they regulate can then be elucidated.
In this study, a comprehensive platform that integrates information from the protein and peptide levels through combination of two-dimensional, liquid phase separations combined with various types of mass spectrometric analysis was applied to the analysis of ribosomal proteins isolated from human breast tumor cells. The approach enabled highly accurate mass assignments and the reliable characterization of sequence variations and post-translational modifications of a notoriously difficult protein complement of human cells. Recent studies are revealing novel roles for ribosomal proteins in cancer and other diseases, therefore, methods that can facilitate the thorough characterization of ribosomal proteins in complex biological samples is critical. The application of the described experimental platform to a human tumor metastasis model revealed major differential expression of specific ribosomal proteins and has identified several candidates for subsequent manipulation and functional analysis, and for potential development as diagnostic and/or prognostic biomarkers. The techniques are also applicable to more challenging matrices such as human tissue and body fluids in a high-throughput manner.
Acknowledgments
This work was supported in part by the National Cancer Institute under grant RO1 CA108597 (40). We also acknowledge the National Science Foundation under grant DBI 99874 for funding of the MALDI-TOF MS instrument used in this work. We would also like to thank Dr. Christian G. Huber (Saarland University, Germany) for supplying the monolithic columns.
References
- 1.Brodersen DE, Nissen P. The social life of ribosomal proteins. FEBS. 2005;272:2098–2108. doi: 10.1111/j.1742-4658.2005.04651.x. [DOI] [PubMed] [Google Scholar]
- 2.Wilson DN, Nierhaus JH. Ribosomal proteins in the spotlight. Crit Rev Biochem Mol Biol. 2005;40:243–267. doi: 10.1080/10409230500256523. [DOI] [PubMed] [Google Scholar]
- 3.Puder M, Barnard GF, Raymond JS, Glenn D, Steele J, Chen LB. Nucleotide and deduced amino acid sequence of human ribosomal protein L18. Biochimica Biophysica Acta. 1993;126:134–136. doi: 10.1016/0167-4781(93)90050-n. [DOI] [PubMed] [Google Scholar]
- 4.Wool IG, Chen YL, Gluck A. Structure and evolution of mammalian ribosomal proteins. Biochem Cell Biol. 1995;73:933–947. doi: 10.1139/o95-101. [DOI] [PubMed] [Google Scholar]
- 5.Ruggero D, Pandolfi PP. Does the ribosome translate cancer? Nature Rev. 2003;3:179–192. doi: 10.1038/nrc1015. [DOI] [PubMed] [Google Scholar]
- 6.Maggi LB, Jr, Weber JD. Nucleolar adaptation in human cancer. Cancer Invest. 2005;23:599–608. doi: 10.1080/07357900500283085. [DOI] [PMC free article] [PubMed] [Google Scholar]
- 7.Yu Y, Maggie LB, Brady SN, Apicelli AJ, Dai N-s, Lu H, Weber JD. Nucleophosmin is essential for ribosomal protein L5 nuclear export. Mol Cell Biol. 2006;26:3798–3809. doi: 10.1128/MCB.26.10.3798-3809.2006. [DOI] [PMC free article] [PubMed] [Google Scholar]
- 8.Holland EC. Regulation of translation and cancer. Cell Cycle. 2004;3:452–455. [PubMed] [Google Scholar]
- 9.Kreunin P, Yoo C, Urquidi V, Lubman DM, Goodison S. Proteomic profiling identifies breast tumor metastasis-associated factors in an isogenic model. Proteomics. 2007;7:299–312. doi: 10.1002/pmic.200600272. [DOI] [PMC free article] [PubMed] [Google Scholar]
- 10.Hamler RL, Zhu K, Buchanan NS, Kreunin P, Kachman MT, Miller FR, Lubman DM. A two-dimensional liquid-phase separation method coupled with mass spectrometry for proteomic studies of breast cancer and biomarker identification. Proteomics. 2004;4:562–577. doi: 10.1002/pmic.200300606. [DOI] [PubMed] [Google Scholar]
- 11.Wang H, Kachman MT, Schwartz DR, Cho KR, Lubman DM. Comprehensive proteome analysis of ovarian cancers using liquid phase separation, mass mapping, and tandem mass spectrometry: A strategy for identification of candidate cancer biomarkers. Proteomics. 2004;4:2476–2495. doi: 10.1002/pmic.200300763. [DOI] [PubMed] [Google Scholar]
- 12.Zhu K, Miller FR, Barder TJ, Lubman DM. Identification of low molecular weight proteins isolated by 2-D liquid separations. J Mass Spectrom. 2004;39:770–780. doi: 10.1002/jms.650. [DOI] [PubMed] [Google Scholar]
- 13.Zhu Y, Wu R, Sangha N, Yoo C, Cho KR, Shedden KA, Katabuchi h, Lubman DM. Classifications of ovarian cancer tissues by proteomic patterns. Proteomics. 2006;6:5846–5856. doi: 10.1002/pmic.200600165. [DOI] [PubMed] [Google Scholar]
- 14.Kreunin P, Urquidi V, Lubman DM, Goodison S. Identification of metastasis-associated proteins in a human tumor metastasis model using the mass-mapping technique. Proteomics. 2004;4:2754–2765. doi: 10.1002/pmic.200300767. [DOI] [PMC free article] [PubMed] [Google Scholar]
- 15.Yoo C, Patwa TH, Kreunin P, Miller FR, Huber CG, Nesvizhskii AI, Lubman DM. Comprehensive analysis of proteins of pH fractionated samples using monolithic LC/MS/MS, intact MW measurement and MALDI-QIT-TOF MS. J Mass Spectrom. 2007;42 doi: 10.1002/jms.1163. [DOI] [PMC free article] [PubMed] [Google Scholar]
- 16.Goodison S, Kawai K, Hihara J, Jiang P, Yang M, Urquidi V, Hoffman RM, Tarin D. Prolonged dormancy and site-specific growth potential of cancer cells spontaneously disseminated from nonmetastatic breast tumors as revealed by labeling with green fluorescent protein. Clin Cancer Res. 2003;9:3808–3814. [PubMed] [Google Scholar]
- 17.Goodison S, Yuan J, Sloan D, Kim R, Li C, Popescu NC, Urquidi V. The RhoGAP protein DLC-1 functions as a metastasis suppressor in breast cancer cells. Cancer Res. 2005;65:6042–6053. doi: 10.1158/0008-5472.CAN-04-3043. [DOI] [PMC free article] [PubMed] [Google Scholar]
- 18.Urquidi V, Sloan D, Kawai K, Agarwal D, Woodman AC, Tarin D, Goodison S. Contrasting expression of thrombospondin-1 and osteopontin correlates with absence or presence of metastatic phenotype in an isogenic model of spontaneous human breast cancer metastasis. Clin Cancer Res. 2002;8:61–74. [PubMed] [Google Scholar]
- 19.Premstaller A, Oberacher H, Walcher W, Timperio AM, Zolla L, Chervet J-P, Cavusoglu N, Dorsselaer Av, Huber CG. High-performance liquid chromatography-electrospray ionization mass spectrometry using monolithic capillary columns for proteomic studies. Anal Chem. 2001;73:2390–2396. doi: 10.1021/ac010046q. [DOI] [PubMed] [Google Scholar]
- 20.Fleischer TC, Weaver CM, McAfee KJ, Jennings JL, Link AJ. Systematic identification and functional screens of uncharacterized proteins associated with eukaryotic ribosomal complexes. Genes and Development. 2006;20:1294–1307. doi: 10.1101/gad.1422006. [DOI] [PMC free article] [PubMed] [Google Scholar]
- 21.Arnold RJ, Reilly JP. Observation of Escherichia coli ribosomal proteins and their posttranslational modifications by mass spectrometry. Anal Biochem. 1999;269:105–112. doi: 10.1006/abio.1998.3077. [DOI] [PubMed] [Google Scholar]
- 22.Wilcox SK, Cavey GS, Pearson JD. Single ribosomal protein mutations in antibiotic-resistant bacteria analyzed by mass spectrometry. Antimicrob Agents Chemother. 2001;45:3046–3055. doi: 10.1128/AAC.45.11.3046-3055.2001. [DOI] [PMC free article] [PubMed] [Google Scholar]
- 23.Jones JJ, Stump MJ, Fleming RC, Jackson O, Lay J, Wilkins CL. Investigation of MALDI-TOF and FT-MS techniques for analysis fo Escherichia coli whole cells. Anal Chem. 2003;75:1340–1347. doi: 10.1021/ac026213j. [DOI] [PubMed] [Google Scholar]
- 24.Odintsova TI, Muller E-C, Ivanov AV, Egorov TA, Bienert R, Vladimirov SN, Kostka S, Otto A, Wittmann-Liebold B, Karpova GG. Characterization and analysis of posttranslational modifications of the human large cytoplasmic ribosomal subunit proteins by mass spectrometry and Edman sequencing. J Protein Chem. 2003;22:249–258. doi: 10.1023/a:1025068419698. [DOI] [PubMed] [Google Scholar]
- 25.Xu WB, Roufa DJ. The gene encoding human ribosomal protein S24 and tissue-specific expression of differentially spliced mRNAs. Genes. 1996;169:257–262. doi: 10.1016/0378-1119(96)88652-5. [DOI] [PubMed] [Google Scholar]
- 26.Louie DF, Resing KA, Lewis TS, Ahn NG. Mass spectrometric analysis of 40S ribosomal proteins from Rat-1 fibroblasts. J Biol Chem. 1996;271:28189–28198. doi: 10.1074/jbc.271.45.28189. [DOI] [PubMed] [Google Scholar]
- 27.Lubman DM, Kachman MT, Wang H, Gong S, Yan F, Hamler RL, O’Neil KA, Zhu K, Buchanan NS, Barder TJ. Two-dimensional liquid separations-mass mapping of proteins from human cancer cell lysates. J Chromatogr B Analyt Technol Biomed Life Sci. 2002;782:183–196. doi: 10.1016/s1570-0232(02)00551-2. [DOI] [PubMed] [Google Scholar]
- 28.Kobayashi T, Sasaki Y, Oshima Y, Yamamoto H, Mita H, Suzuki H, Toyota M, Tokino T, Itoh F, Imai K, Shinomura Y. Activation of the ribosomal protein L13 gene in human gastrointestinal cancer. Int J Mol Med. 2006;18:161–170. [PubMed] [Google Scholar]
- 29.Mazumder B, Sampath P, Seshadri V, Maitra RK, DiCorleto PE, Fox PL. Regulated release of L13a from the 60S ribosomal subunit as a mechanism of transcript-specific translational control. Cell. 2003;115:187–198. doi: 10.1016/s0092-8674(03)00773-6. [DOI] [PubMed] [Google Scholar]
- 30.Karan D, Kelly DL, Rizzino A, Lin MF, Batra SK. Expression profile of differentially-regulated genes during progression of androgen-independent growth in human prostate cancer cells. Carcinogenesis. 2002;23:967–975. doi: 10.1093/carcin/23.6.967. [DOI] [PubMed] [Google Scholar]
- 31.Lexander H, Palmberg C, Auer G, Hellstrom M, Franzen B, Jornvall H, Egevad L. Proteomic analysis of protein expression in prostate cancer. Anal Quant Cytol Histol. 2005;27:263–272. [PubMed] [Google Scholar]
- 32.Kasai H, Nadano D, Hidaka E, Higuchi K, Kawakubo M, Sato TA, Nakayama J. Differential expression of ribosomal proteins in human normal and neoplastic colorectum. J Histochem Cytochem. 2003;51:567–574. doi: 10.1177/002215540305100502. [DOI] [PubMed] [Google Scholar]
- 33.Lopez CD, Martinovsky G, Naumovski L. Inhibition of cell death by ribosomal protein L35a. Cancer Lett. 2002;180:195–202. doi: 10.1016/s0304-3835(02)00024-1. [DOI] [PubMed] [Google Scholar]
- 34.Kroes RA, Jastrow A, McLone MG, Yamamoto H, Colley P, Kersey DS, Yong VW, Mkrdichian E, Cerullo L, Leestma J, Moskal JR. The identification of novel therapeutic targets for the treatment of malignant brain tumors. Cancer Lett. 2000;156:191–198. doi: 10.1016/s0304-3835(00)00462-6. [DOI] [PubMed] [Google Scholar]
- 35.Bevort M, Leffers H. Down regulation of ribosomal protein mRNAs during neuronal differentiation of human NTERA2 cells. Differentiation. 2000;66:81–92. doi: 10.1046/j.1432-0436.2000.660203.x. [DOI] [PubMed] [Google Scholar]
- 36.Goodin JL, Rutherford CL. Characterization of human ribosomal S3a gene expression during adenosine 3′:5′ cyclic monophosphate induced neuroendocrine differentiation of LNCaP cells. Regulation of S3a gene expression in LNCaP. Mol Biol Rep. 2002;29:301–316. doi: 10.1023/a:1020457400377. [DOI] [PubMed] [Google Scholar]
- 37.Fingar DC, Blenis J. Target of rapamycin (TOR): an integrator of nutrient and growth factor signals and coordinator of cell growth and cell cycle progression. Oncogene. 2004;23:3151–3171. doi: 10.1038/sj.onc.1207542. [DOI] [PubMed] [Google Scholar]
- 38.Jefferies HB, Fumagalli S, Dennis PB, Reinhard C, Pearson RB, Thomas G. Rapamycin suppresses 5′TOP mRNA translation through inhibition of p70s6k. EMBO J. 1997;16:3693–3704. doi: 10.1093/emboj/16.12.3693. [DOI] [PMC free article] [PubMed] [Google Scholar]
- 39.Anand N, Murthy S, Amann G, Wernick M, Porter LA, Cukier IH, Collins C, Gray JW, Diebold J, Demetrick DJ, Lee JM. Protein elongation factor EEF1A2 is a putative oncogene in ovarian cancer. Nat Genet. 2002;31:301–305. doi: 10.1038/ng904. [DOI] [PubMed] [Google Scholar]
- 40.Poehlsgaard J, Douthwaite S. The bacterial ribosome as a target for antiobiotics. Nat Rev Microbiol. 2005;3:870–881. doi: 10.1038/nrmicro1265. [DOI] [PubMed] [Google Scholar]