

Abstract
Squamous cell carcinoma of the head and neck (SCCHN) cells can escape recognition by tumor antigen (TA)-specific cytotoxic T lymphocytes (CTL) by downregulation of antigen processing machinery (APM) components, such as the transporter associated with antigen processing (TAP)-1/2 heterodimer. APM component upregulation by interferon gamma (IFN-γ) restores SCCHN cell recognition and susceptibility to lysis by CTL, but the mechanism underlying TAP1/2 downregulation in SCCHN cells is not known. Because IFN-γ activates signal transducer and activator of transcription (STAT)-1, we investigated phosphorylated (p)-STAT1 as a mediator of low basal TAP1/2 expression in SCCHN cells. SCCHN cells were found to express basal total STAT1 but low to undetectable levels of activated STAT1. The association of increased pSTAT1 levels and APM components likely reflects a cause–effect relationship, since STAT1 knockdown significantly reduced both IFN-γ-mediated APM component expression and TA-specific CTL recognition of IFN-γ-treated SCCHN cells. On the other hand, since oncogenic pSTAT3 is overexpressed in SCCHN cells and was found to heterodimerize with pSTAT1, we also tested whether pSTAT3 and pSTAT1:pSTAT3 heterodimers inhibited IFN-γ-induced STAT1 activation and APM component expression. First, STAT3 activation or depletion did not affect basal or IFN-γ-induced expression of pSTAT1 and APM components or recognition of SCCHN cells by TA-specific CTL. Second, pSTAT1:pSTAT3 heterodimers did not interfere with IFN-γ-induced STAT1 binding to the TAP1 promoter or APM protein expression. These findings demonstrate that APM component downregulation is regulated primarily by an IFN-γ-pSTAT1-mediated signaling pathway, independent of oncogenic STAT3 overexpression in SCCHN cells.
Keywords: Antigen processing machinery, STAT1, STAT3, Immune escape, Cytotoxic T lymphocytes
Introduction
Cytotoxic T lymphocytes (CTL) recognize antigenic peptides bound to human leukocyte antigen (HLA) class I molecules on the membrane of target cells. These peptides are mostly but not exclusively derived from endogenous proteins that are degraded by the proteasome and by the immunoproteasome to 8- to 10-amino acid long peptides. The generated peptides are then transported into the endoplasmic reticulum by the transporters associated with antigen processing, (TAP)1/2 complex. In the ER, with the help of antigen processing machinery (APM) components, peptides are loaded on β2 microglobulin-associated HLA class I heavy chains; these trimolecular complexes are then transported to the cell surface for recognition by cognate CTL [1, 2].
APM components demonstrate abnormal expression and/or function in malignant cells, causing impaired expression of HLA class I tumor antigen (TA)-derived peptide complexes on tumor cells [3, 4]. The resulting defective interactions with the host’s immune system provide tumor cells with a mechanism to escape lysis by CTL. Squamous cell carcinoma of the head and neck (SCCHN) cells can evade detection and lysis by CTL through the downregulation of APM components such as TAP1 resulting in poor TA processing and presentation [5–8]. These abnormalities have clinical significance since they correlate with poor prognosis in patients with SCCHN [9–11]. Furthermore, abnormalities in APM component expression and/or function are likely to have a negative impact on the clinical response to T-cell-based immunotherapy. These findings highlight the need to characterize the molecular basis of APM component defects in SCCHN cells, since this information could improve the clinical course of the disease by developing targeted therapies to correct these defects and augment T-cell-based immunotherapies.
Incubation of SCCHN cells with interferon gamma (IFN-γ) upregulates APM components, such as TAP1/2, and restores recognition and lysis of SCCHN cells by HLA class I restricted, TA-specific CTL [7]. IFN-γ induces autophosphorylation of janus-activated kinase (JAK)-2 and trans-phosphorylation of JAK1 [12]. Activated JAK1 phosphorylates tyrosine residue 440 of the IFN-γ receptor (IFN-γR), providing a docking site for signal transducer and activator of transcription (STAT1)-1 to bind. STAT1 is phosphorylated on tyrosine residue 701 likely by JAK2 [13]. STAT1 then dissociates from the IFN-γR and can form homodimers that bind to gamma-activated sequences (GAS) in the promoters of APM component genes, such as TAP1 [14–16].
We investigated the role of STAT1 and STAT3 because both of these transcription factors can modulate the signaling activity of interferons by forming STAT1:STAT3 heterodimers and inhibiting their respective gene activation [17, 18]. Furthermore, IL-10, a potent STAT3 agonist [19], has been shown to inhibit IFN-γ-mediated STAT1 phosphorylation [20] and APM component expression in tumor cells [21–24]. Several reports demonstrate that SCCHN cells secrete IL-6 [25–27] and that STAT3 activation in these cells occurs by autocrine/paracrine stimulation of the IL-6 receptor [27]. Moreover, others have shown that pretreatment serum IL-6 levels could serve as a prognostic biomarker in SCCHN patients [28, 29], and its biological and clinical significance prompted us to select IL-6 as the STAT3 agonist in our studies. Thus, we investigated whether the low level of phosphorylated pSTAT1 is responsible for poor basal APM expression and whether the beneficial effect of IFN-γ is mediated by the activation of STAT1 and/or by reduction of STAT3 levels via STAT1:STAT3 heterodimers.
Materials and methods
Cell lines
The HLA-A*0201+ SCCHN cell lines, PCI-13 and SCC90 were characterized and described previously [30]. Both tumor cell lines were cultured in DMEM (Sigma–Aldrich Inc., St. Louis, MO) supplemented with 10% FBS (Mediatech, Herndon, VA), 2% l-glutamine and 1% penicillin/streptomycin (Invitrogen Corp, Carlsbad, CA).
Cytokines
Recombinant human IL-6 was purchased from R&D systems (Minneapolis, MN), and IFN-γ was purchased from InterMune (Brisbane, CA).
Antibodies and reagents
IFN-γR α chain monoclonal antibody (mAb) was purchased from BD Pharmingen (San Jose, CA). Anti-HLA-A,B,C mAb (w6/32) (Ebiosciences, San Diego, CA) and anti-HLA-DR (L243) mAb (Biolegend, San Diego, CA) were used in ELISPOT assays. LMP2-specific mAb SY-1 [31], TAP1-specific mAb NOB-1, TAP2-specific mAb NOB-2 and calreticulin-specific mAb TO-11 were developed and characterized as described [31, 32]. FITC-conjugated IgG anti-mouse mAb was used as a secondary antibody for APM and IFN-γR α chain staining and purchased from Invitrogen Corp. The intracellular pSTAT staining was performed using PE-conjugated irrelevant IgG2a mAb isotype control, PE-conjugated phosphorylated tyrosine 701 STAT1 mAb (pSTAT1 Tyr701) and PE-conjugated pSTAT3 Tyr705 mAb purchased from BD Biosciences (San Jose, CA). Western blotting antibodies include anti-pSTAT1 Tyr701 mAb, anti-pSTAT3 Tyr705 mAb (Cell Signaling Tech, Danvers, MA), anti-STAT1 (C-24) polyclonal (pAb) (Santa Cruz Biotech, Santa Cruz, CA), anti-STAT3 (C-20) pAb (Santa Cruz Biotech), anti-β-actin mAb (Sigma–Aldrich Inc.), anti-rabbit IgG-HRP (Promega, Madison, WI) and anti-mouse IgG-HRP (Biorad, Hercules, CA).
Intracellular flow cytometry for APM component and pSTAT1 expression
Intracellular flow cytometry was performed as described [33]. Briefly, the cells were fixed using 1.5% paraformaldehye for 10 min at room temperature (RT) and permeabilized with 100% methanol for at least 24 h at −20°C. Cells were then washed in fluorescence-activated cell sorting (FACS) buffer (2% FBS/PBS) and stained either with a PE-conjugated primary STAT-specific mAb or sequentially by incubation with an unconjugated primary APM component-specific mAb and then with a FITC-conjugated anti-mouse secondary mAb. Both incubations were for 30 min at RT. FACS analysis was performed on the same day as staining. Isotype control antibody staining was set at a mean fluorescence intensity (MFI) of 5 on an EPICS XL cytometer (Beckman Coulter, Brea, CA) for each condition and cell line tested. A minimum of 10,000 cells were collected per test. Analyses were performed using EXPO32 ADC software (Beckman Coulter). pSTAT1, pSTAT3 and APM component expression was determined based on MFI and was expressed as a mean ± SE of the results obtained in at least three independent experiments.
Immunoblot analysis
Cells were lysed in 10 mM Tris HCl, 5 mM EDTA, 50 mM NaCl, 30 mM Na2P2O7, 50 mM NaF, 1 mM NaVO4, 1% Triton X-100, 1 mM PMSF and vortexed for at least 1 h at 4°C, sonicated for 6 s at 20% of the maximum potency (Cole Parmer Instrument, Verona Hills, IL) and centrifuged at 4°C, 16,100 g for 15 min. The supernatant protein was normalized, and 40–60 μg of protein was size fractionated through a 4–12% SDS–PAGE gel (Lonza, Rockand, ME), transferred to a PVDF membrane (Millipore, Billerica, MA) and immunoblotted with the indicated antibodies. Densitometry was performed on a Personal Densitometer SI (Molecular Dynamics, Sunnyvale, CA) according to the manufacturer’s instructions.
Small interfering RNA (siRNA)
SCCHN cell lines were transfected at 30–40% confluence with STAT1-targeting siRNA, STAT3-targeting siRNA or a non-targeting siRNA control (Ambion, Austin, TX), Lipofectamine RNAi max (Invitrogen Corp) and Optimem I (Invitrogen Corp) according to the Lipofectamine RNAi max instructions. Eighteen to twenty-four hours after the transfection, cells were washed with PBS and incubated with or without IFN-γ (40–100 U/ml) for 15 min or 48 h at 37°C. Then, cells were collected and analyzed by flow cytometry, immunoblot or ELISPOT analyses.
- STAT1:
-
5′-CCUACGAACAUGACCCUAUTT-3′ (s) and
5′-AUAGGGUCAUGUUCGUAGGTG-3′ (as)
- STAT3:
-
5′-GCCUCAAGAUUGACCUAGATT-3′ (s) and
5′-UCUAGGUCAAUCUUGAGGCCT-3′ (as)
- Non-targeting control:
-
5′-AGUACAGCAAACGAUACGGtt-3′ (s) and
5′-CCGUAUCGUUUGCUGUACUtt-3′ (as)
ELISPOT assay
ELISPOT assays were performed as described [34]. Briefly, multiscreenHTS-HA filter plates (Millipore) were coated with anti-human IFN-γ mAb 1-D1K (Mabtech, Mariemont, OH) (10 μg/mL in PBS) overnight at 4°C. Unbound mAb was removed by four successive washings with PBS. Plates were then blocked for 1 h at 37°C with DMEM supplemented with 10% human serum. p5365–73-[35] or HPV7–15 [36]-specific CTL were added to wells in triplicate (5 × 10⁴) and then SCCHN cells (5 × 10⁴). Following an 18–24 h of incubation at 37°C, plates were washed with PBS/0.05% Tween 20 (PBS-T) and incubated with biotinylated anti-IFN-γ mAb (Mabtech) (2 μg/ml) for 4 h at 37°C. Plates were washed with PBS-T avidin-peroxidase complex (Vector laboratories, Burlingame, CA) (1 h at RT). Unbound complex was removed by 5 successive washings with PBS-T followed by PBS. Peroxidase staining was performed with 3,3,5′-tetramethylbenzidine (Vector Laboratories) for 4 min and stopped by rinsing the plates under running tap water. Spots were enumerated in triplicate wells as a mean ± standard error using computer-assisted video image analysis software (Cellular Technology Ltd., Shaker Heights, OH). The HLA class I restriction of the recognition of target cells by the tested CTL was assessed by performing the assay in the presence of an anti-HLA class I–specific mAb W6/32 (10 μg/ml); the specificity of the inhibition was assessed using an anti-HLA-DR-specific mAb L243 (10 μg/ml).
SCCHN tumor digestion
SCCHN tumors were minced in tumor cell line culture media and washed three times with PBS. The tumors were digested in Hank’s Balanced Salt Solution (Mediatech), containing 10 mg/ml of collagenase type IV (Sigma), 1 mg/ml of hyaluronidase type V (Sigma) and 200 mg/ml of DNase type IV (Sigma), and incubated in a shaking 37°C water bath for 2–4 h. The digested tumors were then filtered through a 70-μm nylon mesh filter unit (BD Falcon, Franklin Lakes, NJ), washed three times in FACS buffer and analyzed by flow cytometry for expression of IFN-γR.
Co-immunoprecipitation
Cell lysates were prepared as described in the immunoblot analysis section and precleared with protein A agarose beads (Millipore, Temecula, CA) at 4°C for 1 h. Cell lysates (750 μg of protein/ml) were incubated on a rotator overnight at 4°C with 5 μg of anti-STAT1 mAb, anti-STAT3 mAb or control IgG mAb. Protein A agarose beads were then added to the lysates, and the incubation was continued for 1 additional hour at 4°C on a rotator. Beads were then washed with lysis buffer three times, size fractionated through a 4–12% SDS–PAGE gel, transferred to a PVDF membrane and immunoblotted with the indicated antibodies.
Chromatin immunoprecipitation (ChIP) assay
Cells were serum starved for 48 h at 37°C in AIM V (Invitrogen Corp, Carlsbad, CA) prior to incubation with IL-6 (50 ng/ml) for 60 min at 37°C, IFN-γ (1,000 U/ml) for 30 min at 37°C, or sequentially with IL-6 (50 ng/ml) for 30 min at 37°C and with IFN-γ (1,000 U/ml) for 30 min at 37°C in the presence of IL-6. At the end of the incubation, cells were fixed with formaldehyde (1% final concentration) (Sigma–Aldrich Inc.) for 10 min at RT. Cells were then quenched with glycine (0.125 M final concentration) (Sigma–Aldrich Inc.) for 5 min, washed twice with ice-cold PBS and harvested. After centrifugation at 16,100 g for 12 min at 4°C, cells were lysed in SDS lysis buffer (Millipore) containing protease inhibitors. Chromatin was sheared by sonication for 12 s at 20% of the maximum potency (Cole Parmer Instrument) to generate fragmented DNA with an average length between 200 and 1,000 base pairs. STAT1, STAT3 and IgG control mAbs were used to immunoprecipitate STAT1- and STAT3-bound chromatin (5 μg of antibody) rotating overnight at 4°C. Protein A agarose beads were added to each IP (60 μl) and incubated for 1 h rotating at 4°C. The subsequent washes and elution steps were performed using the Ez-ChIPTM kit (Millipore) and according to the manufacturer’s instructions. Protein–DNA crosslinks were reversed at 65°C overnight. After RNase (10 μg, 30 min at 37°C) (Sigma–Aldrich Inc.) and sequential proteinase K (10 μg, 2 h at 45°C) (Sigma–Aldrich Inc.) digestion, DNA was purified using the QIAquick PCR purification kit (Qiagen). Purified DNA was used in each PCR (at 94°C for 5 min, and 35 cycles at 94°C for 30 s, at 55°C for 30 s, at 68°C for 1 min) using the following primers:
- TAP1
-
5′-AAGTAGGCGTTATCTAGTGAGCAGGC-3′ (s) and
5′-ACACCTAGAGCTAGCCATTGGCAC-3′ (as).
Statistical analysis
Data are expressed as a mean ± standard error of the results obtained in at least three independent experiments. A two-tailed t test was used to calculate whether observed differences were statistically significant. P < 0.05 was considered significant.
Results
SCCHN cells express low basal pSTAT1 and high basal pSTAT3
At basal untreated conditions in SCCHN cells, PCI-13 and SCC90, high pSTAT3 (Tyrosine 705) was associated with low to undetectable levels of pSTAT1 (Tyrosine 701) and APM component expression (Fig. 1). This low level of pSTAT1 does not reflect a deficiency of STAT1, since these cells express significant levels of total STAT1 (Fig. 1b). Treatment of SCCHN cells with IFN-γ (100 U/ml, 15 min) upregulated pSTAT1 but not pSTAT3 (Fig. 1). In contrast, IL-6 (50 ng/ml, 15 min) treatment, which is secreted by SCCHN cells in an autocrine/paracrine fashion [27], strongly upregulated pSTAT3 (Fig. 1).
Fig. 1.
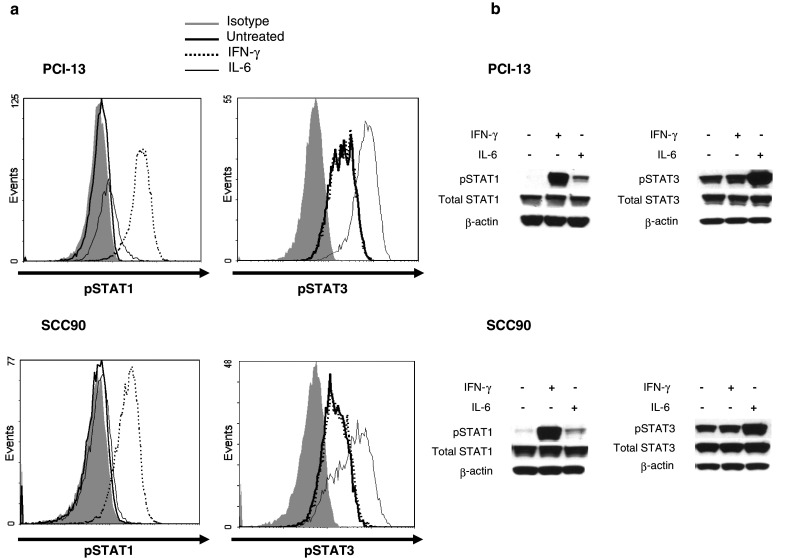
SCCHN cells express low basal pSTAT1 and high basal pSTAT3 that are inducible by treatment with IFN-γ and IL-6. Cells were treated with IFN-γ (100 U/ml, 15 min) or IL-6 (50 ng/ml, 15 min) and assayed for pSTAT1 (Tyrosine 701) or pSTAT3 (Tyrosine 705) by a intracellular flow cytometry or b immunoblot analyses. Data represent at least three independent experiments
Induction of IFN-γ-mediated pSTAT1, APM expression and CTL recognition in STAT3-depleted SCCHN cells
Others have shown that IL-10, a potent STAT3 agonist, can inhibit IFN-γ-mediated STAT1 phosphorylation [20] and TAP1/2 expression in tumor cells [21–24]. These studies suggest that pSTAT3 might suppress STAT1 phosphorylation and inhibit APM expression in SCCHN cells. Since pSTAT3 is expressed at very high levels in SCCHN cells (Fig. 1), we investigated whether depleting STAT3 altered the IFN-γ-pSTAT1-APM pathway. Using STAT3 siRNA, target-specific reduction of greater than 90% was achieved in PCI-13 and SCC90 cells (Fig. 2a, b). Interestingly, pSTAT1 and APM component expression levels were equivalent between STAT3 and non-targeting siRNA transfections alone or in combination with IFN-γ treatment (Fig. 2c–f, P = not significant (NS), two-tailed t test). Calreticulin, a non-IFN-γ-inducible APM component, was used as a negative control. To document the functional impact of the above findings on TA-specific CTL recognition of SCC90 cells, IFN-γ ELISPOT was performed. The beneficial effect of IFN-γ in activating STAT1 and restoring SCCHN cell recognition by p5365–73-[35] or HPV7–15-specific [36] CTL was unaffected by STAT3 depletion (Fig. 2g–h, P = NS, two-tailed t test). CTL recognition was abrogated using an anti-HLA-A-, anti-HLA-B-, anti-HLA-C-specific mAb demonstrating that CTL were HLA class I restricted. Similar results were obtained with PCI-13 cells. These data illustrate that the APM expression in SCCHN cells is strongly dependent on IFN-γ-induced pSTAT1, and STAT3 does not functionally alter the activity of this pathway.
Fig. 2.

IFN-γ-mediated pSTAT1, APM expression and CTL recognition in STAT3-depleted SCCHN cells. a PCI-13 and b SCC90 cells were transfected with the indicated doses of siRNA, and knockdown of STAT3 protein was assessed by immunoblot and densitometry analyses. Data represent at least three independent experiments. c PCI-13 and d SCC90 cells were transfected with (200 or 100 nM, respectively) non-targeting or STAT3 siRNA alone or in combination with IFN-γ (100 U/ml, 15 min), added 48 h after transfection. Intracellular flow cytometry for pSTAT1 was performed. Data represent the mean fluorescence intensity MFI of at least three independent experiments. (P = NS, two-tailed t test). Error bars indicate standard error. PCI-13 (e) and SCC90 (f) cells were transfected as described above, except IFN-γ (100 U/ml, 48 h) was added 24 h after transfection. Intracellular flow cytometry for TAP1, TAP2, LMP2 and calreticulin was performed. Calreticulin, a non-IFN-γ-inducible APM component, was included to control for global changes in protein expression following treatment. Data represent the (MFI) of at least three independent experiments. (P = NS, two-tailed t test). Error bars indicate standard error. IFN-γ ELISPOT assay were performed using (g) p5365–73- or (h) HPV7–15 -specific cytotoxic T lymphocytes as effector cells and SCC90 cells as targets that have been transfected and treated with IFN-γ as described in (b). An anti-HLA-A,B,C mAb (w6/32) was used to demonstrate that CTL was HLA class I restricted. Error bars indicate standard error (P = NS, two-tailed t test)
Low pSTAT1 levels contribute to basal APM downregulation and CTL evasion in SCCHN cells
To identify the mechanism of IFN-γ-mediated TAP1 expression and restoration of SCCHN cell lysis by CTL [7], we also investigated the role of pSTAT1. SCCHN cells isolated from primary tumors (Fig. 3a) express IFN-γR and previous studies demonstrated that tumor cells derived from SCCHN lesions upregulate HLA class I and APM components in response to IFN-γ treatment [9]. Established SCCHN cells also express IFN-γR (data not shown) and treatment with IFN-γ (100 U/ml, 15 min or 48 h) in a representative cell line, PCI-13, significantly upregulated pSTAT1 and APM component expression compared to basal, untreated conditions (Fig. 3b, c; P < 0.005 and 0.001, respectively, two-tailed t test), demonstrating that the IFN-γ-pSTAT1-APM signaling pathway is intact.
Fig. 3.

STAT1 signaling is intact in SCCHN cells. a SCCHN cells isolated from SCCHN tumors were tested for basal IFN-γR expression by flow cytometry. PCI-13 cells were treated with IFN-γ (100 U/ml) for either 15 min or 48 h and then analyzed by intracellular flow cytometry for either b pSTAT1 c or APM component expression, respectively. Data represent at least three independent experiments. Mean fluorescence intensity (MFI) was plotted, and error bars indicate standard error (*P < 0.005, *P < 0.001, two-tailed t test)
Moreover, STAT1 siRNA (200 nM, 48 h), which specifically decreased STAT1 protein by greater than 75% (Fig. 4a), significantly reduced IFN-γ-mediated pSTAT1 and APM component expression (Fig. 4b, c; P < 0.0005 and 0.002, respectively, two-tailed t test). To assess the functional impact of STAT1 expression in SCCHN cells, IFN-γ ELISPOT was performed. STAT1 depletion significantly impaired TA-specific CTL recognition of IFN-γ-treated SCCHN cells (Fig. 4d; P < 0.01, two-tailed t test). Similar results were obtained in SCC90 cells. Taken together, these data suggest that activated STAT1 is a crucial mediator of APM component expression and that low basal pSTAT1 activation contributes to APM-mediated downregulation in SCCHN cells and escape from CTL recognition.
Fig. 4.
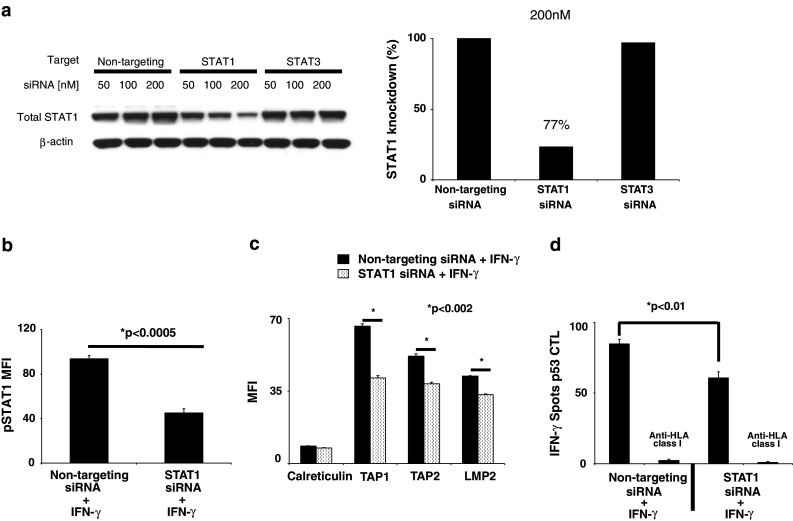
Activated STAT1 is a critical mediator of APM component expression and TA-specific CTL recognition of SCCHN cells. a PCI-13 cells were transfected with the indicated doses of siRNA, and knockdown of STAT1 protein was assessed by immunoblot and densitometry analyses. PCI-13 cells were transfected with 200 nM of the indicated siRNA and 24 h after transfection, IFN-γ (40 U/ml) was added for either 15 min or 48 h and then analyzed by intracellular flow cytometry for either b pSTAT1 or c APM component expression by MFI, respectively. Data represent at least three independent experiments. Error bars indicate standard error (*P < 0.0005, *P < 0.002, two-tailed t test). d PCI-13 cells were transfected with 200 nM of the indicated siRNA and 24 h after transfection treated with IFN-γ (40 U/ml) for an additional 24 h. The cells were collected as used as targets, and p5365–73-specific cytotoxic T lymphocyte (CTL) was used as effector cells in IFN-γ ELISPOT assays. An anti-HLA-A,B,C mAb (w6/32) was used to demonstrate that CTL was HLA class I restricted. Error bars indicate standard error (*P < 0.01, two-tailed t test)
IFN-γ and IL-6 induce pSTAT1/3 heterodimerization
Since it has been shown that STAT1:STAT3 heterodimers inhibit STAT1 gene activation [17, 18], this raised the question as to whether these complexes contributed to low APM gene expression. To investigate the potential suppressive role of STAT1:STAT3 heterodimers on basal APM expression, we stimulated SCCHN cells with IFN-γ (100 U/ml, 15 min) or IL-6 (50 ng/ml, 15 min), immunoprecipitated STAT1 and STAT3, size fractionated the proteins on a SDS gel, and then probed using anti-pSTAT1 (Tyrosine 701), anti-pSTAT3 (Tyrosine 705), anti-total STAT1 and total anti-total STAT3 mAbs. Interestingly, pSTAT1:pSTAT3 heterodimers were detected at low levels in the SCCHN cells under basal conditions, and both IL-6 and IFN-γ treatments increased pSTAT1:pSTAT3 heterodimer formation (Fig. 5). These data suggest that overexpressed pSTAT3 in SCCHN cells could be interfering with pSTAT1 homodimerization and APM gene activation.
Fig. 5.

IL-6 and IFN-γ increase pSTAT1:pSTAT3 heterodimerization. Cells were treated with either IL-6 (50 ng/ml, 15 min) or IFN-γ (100 U/ml, 15 min). Whole cell lysates were prepared and immunoprecipitated with anti-STAT1 or anti-STAT3 or an irrelevant control mAb. The immunoprecipitates were size fractionated by SDS/PAGE and transferred to a PVDF membrane. The blots were probed for anti-pSTAT1, STAT1, pSTAT3, and total STAT3 from a PCI-13 and b SCC90 cells
IFN-γ-mediated STAT1 binding to the TAP1 promoter, APM protein expression and TA-specific CTL recognition is independent of STAT1:STAT3 heterodimerization
Given the presence of pSTAT1:pSTAT3 heterodimers under basal conditions, we investigated whether these complexes could inhibit IFN-γ-induced STAT1 binding to the TAP1 promoter, using chromatin immunoprecipitation (ChIP) assays. Pretreatment of SCCHN cells with IL-6 (50 ng/ml, 30 min) to increase the formation of pSTAT1:pSTAT3 heterodimers did not inhibit IFN-γ (1,000 U/ml, 30 min)-mediated STAT1 binding to the TAP1 promoter compared to IFN-γ treatment alone (Fig. 6a, b). Furthermore, the levels of STAT3 bound to the TAP1 promoter remained unchanged with either cytokine treatment, demonstrating that pSTAT1:pSTAT3 heterodimers do not bind to the TAP1 promoter (Fig. 6a, b). These data illustrate that pSTAT1:pSTAT3 heterodimers do not interfere with the IFN-γ-pSTAT1 signaling pathway and that pSTAT1 is a crucial transcription factor in regulating TAP1 gene transcription.
Fig. 6.

IFN-γ-mediated-STAT1 binding to the TAP1 promoter and APM protein expression is independent of STAT1:STAT3 heterodimerization. a PCI-13 and b SCC90 cells were untreated, treated with IL-6 (50 ng/ml, 60 min), IFN-γ (1,000 U/ml, 30 min) or pretreated with IL-6 (50 ng/ml, 30 min), then treated with IFN-γ (1,000 U/ml, 30 additional min) in the presence of IL-6. The cells were fixed with formaldehyde, quenched with glycine and lysed in SDS lysis buffer. Chromatin was sheared by sonication and probed with anti-STAT1, anti-STAT3 and anti-IgG mAbs. Protein–DNA crosslinks were reversed, and both RNA and protein were removed by enzymatic digestion. DNA was purified, and PCR was performed amplifying a canonical GAS sequence in the TAP1 promoter localized to STAT1 binding. c PCI-13 and d SCC90 cell were untreated, treated with IL-6 (50 ng/ml, 48 h), IFN-γ (100 U/ml, 48 h) or pretreated with IL-6 (50 ng/ml, 30 min), then treated with IFN-γ (100 U/ml, 48 h) in the presence of IL-6. Intracellular flow cytometry was performed measuring TAP1, TAP2, LMP2 and calreticulin. MFI was plotted representing at least three independent experiments (P = NS, two-tailed t test). Error bars indicate standard error
To determine whether increasing pSTAT1:pSTAT3 heterodimerization affected IFN-γ-induced APM expression at the protein level, SCCHN cells were pretreated with IL-6 (50 ng/ml, 30 min), then treated with IFN-γ (100 U/ml, for 48 h) in the presence of IL-6. Under these conditions, IFN-γ-mediated APM component levels were equivalent to cells pretreated with IL-6 prior to incubation with IFN-γ (Fig. 6c, d; P = NS, two-tailed t test), further supporting the independence of the IFN-γ-pSTAT1 pathway from STAT3. Lastly, IFN-γ ELISPOT demonstrated that the beneficial effect of IFN-γ in activating STAT1 and restoring SCCHN cell recognition by TA-specific CTL was unaffected by pSTAT1:pSTAT3 heterodimerization (data not shown). These data, together with the ChIP analyses, demonstrated that pSTAT1 and not its heterodimerization with pSTAT3, is important in regulating APM protein expression and TA-specific CTL recognition of SCCHN cells. Thus, a deficiency in STAT1 activation and not overexpressed pSTAT3 is responsible for poor basal APM component expression in SCCHN cells.
Discussion
Abnormal APM component expression and/or dysfunction frequently occur in human malignancies [4], but this mechanism of immune escape has not been thoroughly investigated. In this study, we document that SCCHN cells express low basal levels of pSTAT1 (Fig. 1) as a mechanism of APM component downregulation despite intact IFN-γR expression and signaling (Fig. 3) and that exogenous IFN-γ-mediated STAT1 activation is required to facilitate STAT1 binding to the TAP1 promoter (Fig. 6a, b), APM protein expression (Fig. 4c) and TA-specific CTL recognition (Fig. 4d). These data support that low basal pSTAT1 levels and not defects in the endogenous IFN-γ-pSTAT1-APM signal transduction pathway are responsible for the low basal APM component expression observed in SCCHN cells.
Complete inhibition of IFN-γ mediated APM component expression was not observed after significant knockdown of total STAT1 protein. Interestingly, treatment of SCCHN cells with a tenfold lower dose of IFN-γ (10 U/ml) upregulated APM components (data not shown) suggesting that a threshold level of pSTAT1 is required to induce APM protein expression. Thus, despite the significant reduction of total STAT1 by siRNA (Fig. 4a), residual STAT1 was sufficiently activated by IFN-γ to mediate APM component expression and CTL recognition, albeit at significantly reduced levels (Fig. 4c, d). Interestingly, others have shown reduced IFN-γ levels in the plasma of patients with SCCHN compared to age-matched controls [37, 38], providing a potential clinical explanation for low basal STAT1 activation and APM-mediated immune escape in SCCHN cells.
Others have shown that STAT3 activation by type I IFNs can inhibit STAT1 target gene expression through formation of STAT1:STAT3 heterodimers [17, 18]; therefore, we also investigated whether overexpressed pSTAT3 and these heterodimer complexes were responsible for low basal APM component expression in SCCHN cells. Our exclusion for a role of STAT3 in basal APM-mediated immune escape differs from previous reports that provide evidence that STAT3 activation by IL-10 inhibits IFN-γ-mediated STAT1 phosphorylation [20] and downregulates TAP expression in tumor cells [21–24]. In SCCHN cells, the IL-10 receptor is not appreciably expressed, and IL-10 did not activate pSTAT3 in our studies (unpublished data). The biological basis for pSTAT1:pSTAT3 heterodimers in SCCHN is unknown [39]. We investigated whether pSTAT1:pSTAT3 heterodimers were responsible for low basal APM component expression and SCCHN escape from CTL recognition. STAT1:STAT3 heterodimers were detected in PCI-13 and SCC90 cells at basal, untreated conditions, and these complexes were increased after treatment with IFN-γ and IL-6 (Fig. 5). Interestingly, IFN-γ-mediated pSTAT1 upregulation also induced heterodimer formation with pSTAT3 (Fig. 5), but APM protein was still expressed (Fig. 6c, d). This finding might be due to the abundant activation of STAT1 by IFN-γ, inducing pSTAT1 homodimerization and APM gene activation and excess pSTAT1 dimerizing with pSTAT3, which is overexpressed in SCCHN cells. Also, STAT3 was found bound to the TAP1 promoter (Fig. 6a, b), and this observation is consistent with the fact that STAT1 and STAT3 can bind to the same consensus gamma-activating sequence (GAS), yet regulate different target genes [40].
IL-6 induced pSTAT1:pSTAT3 heterodimerization did not alter IFN-γ-mediated APM protein (Fig. 6c, d). To investigate whether the dose of IFN-γ (100 U/ml) used in our studies might be masking a potential negative regulatory effect of IL-6-mediated STAT1:STAT3 heterodimers, we used a 10-fold lower dose of IFN-γ (10 U/ml). Even at this lower dose, IL-6 treatment did not inhibit IFN-γ-mediated APM component expression (data not shown). Importantly, at baseline, STAT3 depletion by siRNA could not reproduce the beneficial effects of stimulating the IFN-γ-STAT1-APM pathway. Treatment of SCCHN cells with IFN-γ after STAT3 depletion did not augment APM component expression or TA-specific CTL recognition (Fig. 2c–f). These data demonstrate that APM component expression and CTL recognition of SCCHN cells primarily require activation of STAT1 with exogenous IFN-γ independent of STAT3.
The mechanism of how SCCHN cells maintain low basal pSTAT1 and APM component expression is still not known. Deficiencies in TAP expression have been documented to occur through a lack of STAT1 and IRF1 phosphorylation [41], mutations in the JAK1 kinase that prevent its activation and subsequent STAT1 phosphorylation [42], and impaired RNA polymerase II recruitment to the TAP1 promoter [43]. Several investigators have identified that members of a small sub-family of non-receptor protein tyrosine phosphatases (PTPs), Src homology-2 domain-containing phosphatases (SHP)-1 and SHP2 can dephosphorylate JAK1 [44] and STAT1 [45]. Providing a stimulus for STAT1 activation such as IFN-γ can correct APM downregulation and enhance CTL lysis in vitro, but perhaps a more efficacious therapeutic approach would be a targeted therapy against the negative regulators of STAT1 phosphorylation in SCCHN. A greater understanding of the mechanisms responsible for low basal pSTAT1 and APM expression could augment current T-cell-based immunotherapies by enhancing the immunogenicity of its tumor cell target.
In summary, these studies identified low pSTAT1 in SCCHN cells as a critical mediator of APM component downregulation and CTL escape. We also investigated a potential role for pSTAT1:pSTAT3 heterodimers in APM component downregulation of SCCHN cells. Our data demonstrate that pSTAT1:pSTAT3 heterodimers do not alter the IFN-γ-pSTAT1-APM signaling axis. The function of the pSTAT1:pSTAT3 heterodimer remains unknown, but these findings indicate a need to directly stimulate the STAT1 pathway to enhance APM expression and reverse CTL evasion by tumor cells. Future studies might include investigating the negative regulators of STAT1 activation whose dysregulated activity might be responsible for low basal pSTAT1 and APM component levels in SCCHN.
Acknowledgments
The authors thank R. J. Binder and W. J. Storkus for critical reading of the manuscript and C. Visus for expert technical assistance. The authors have no conflicting financial interests.
References
- 1.Cerundolo V, et al. Presentation of viral antigen controlled by a gene in the major histocompatibility complex. Nature. 1990;345(6274):449–452. doi: 10.1038/345449a0. [DOI] [PubMed] [Google Scholar]
- 2.Hosken NA, Bevan MJ. Defective presentation of endogenous antigen by a cell line expressing class I molecules. Science. 1990;248(4953):367–370. doi: 10.1126/science.2326647. [DOI] [PubMed] [Google Scholar]
- 3.Campoli M, Ferrone S. HLA antigen changes in malignant cells: epigenetic mechanisms and biologic significance. Oncogene. 2008;27(45):5869–5885. doi: 10.1038/onc.2008.273. [DOI] [PMC free article] [PubMed] [Google Scholar]
- 4.Seliger B. Different regulation of MHC class I antigen processing components in human tumors. J Immunotoxicol. 2008;5(4):361–367. doi: 10.1080/15476910802482870. [DOI] [PubMed] [Google Scholar]
- 5.Ferris RL, Hunt JL, Ferrone S. Human leukocyte antigen (HLA) class I defects in head and neck cancer: molecular mechanisms and clinical significance. Immunol Res. 2005;33(2):113–133. doi: 10.1385/IR:33:2:113. [DOI] [PubMed] [Google Scholar]
- 6.Ferris RL, Whiteside TL, Ferrone S. Immune escape associated with functional defects in antigen-processing machinery in head and neck cancer. Clin Cancer Res. 2006;12(13):3890–3895. doi: 10.1158/1078-0432.CCR-05-2750. [DOI] [PubMed] [Google Scholar]
- 7.Lopez-Albaitero A, et al. Role of antigen-processing machinery in the in vitro resistance of squamous cell carcinoma of the head and neck cells to recognition by CTL. J Immunol. 2006;176(6):3402–3409. doi: 10.4049/jimmunol.176.6.3402. [DOI] [PubMed] [Google Scholar]
- 8.Matsui M, Ikeda M, Akatsuka T. High expression of HLA-A2 on an oral squamous cell carcinoma with down-regulated transporter for antigen presentation. Biochem Biophys Res Commun. 2001;280(4):1008–1014. doi: 10.1006/bbrc.2000.4234. [DOI] [PubMed] [Google Scholar]
- 9.Meissner M, et al. Defects in the human leukocyte antigen class I antigen processing machinery in head and neck squamous cell carcinoma: association with clinical outcome. Clin Cancer Res. 2005;11(7):2552–2560. doi: 10.1158/1078-0432.CCR-04-2146. [DOI] [PubMed] [Google Scholar]
- 10.Ogino T, et al. HLA class I antigen down-regulation in primary laryngeal squamous cell carcinoma lesions as a poor prognostic marker. Cancer Res. 2006;66(18):9281–9289. doi: 10.1158/0008-5472.CAN-06-0488. [DOI] [PubMed] [Google Scholar]
- 11.Ogino T, et al. Association of tapasin and HLA class I antigen down-regulation in primary maxillary sinus squamous cell carcinoma lesions with reduced survival of patients. Clin Cancer Res. 2003;9(11):4043–4051. [PubMed] [Google Scholar]
- 12.Gough DJ, et al. IFNgamma signaling-does it mean JAK-STAT? Cytokine Growth Factor Rev. 2008;19(5–6):383–394. doi: 10.1016/j.cytogfr.2008.08.004. [DOI] [PubMed] [Google Scholar]
- 13.Shuai K, et al. A single phosphotyrosine residue of Stat91 required for gene activation by interferon-gamma. Science. 1993;261(5129):1744–1746. doi: 10.1126/science.7690989. [DOI] [PubMed] [Google Scholar]
- 14.Rouyez MC, et al. IFN regulatory factor-2 cooperates with STAT1 to regulate transporter associated with antigen processing-1 promoter activity. J Immunol. 2005;174(7):3948–3958. doi: 10.4049/jimmunol.174.7.3948. [DOI] [PubMed] [Google Scholar]
- 15.Min W, Pober JS, Johnson DR. Kinetically coordinated induction of TAP1 and HLA class I by IFN-gamma: the rapid induction of TAP1 by IFN-gamma is mediated by Stat1 alpha. J Immunol. 1996;156(9):3174–3183. [PubMed] [Google Scholar]
- 16.Chatterjee-Kishore M, et al. Different requirements for signal transducer and activator of transcription 1 alpha and interferon regulatory factor 1 in the regulation of low molecular mass polypeptide 2 and transporter associated with antigen processing 1 gene expression. J Biol Chem. 1998;273(26):16177–16183. doi: 10.1074/jbc.273.26.16177. [DOI] [PubMed] [Google Scholar]
- 17.Ho HH, Ivashkiv LB. Role of STAT3 in type I interferon responses. Negative regulation of STAT1-dependent inflammatory gene activation. J Biol Chem. 2006;281(20):14111–14118. doi: 10.1074/jbc.M511797200. [DOI] [PubMed] [Google Scholar]
- 18.Thyrell L, et al. Interferon alpha induces cell death through interference with interleukin 6 signaling and inhibition of STAT3 activity. Exp Cell Res. 2007;313(19):4015–4024. doi: 10.1016/j.yexcr.2007.08.007. [DOI] [PubMed] [Google Scholar]
- 19.Murray PJ. Understanding and exploiting the endogenous interleukin-10/STAT3-mediated anti-inflammatory response. Curr Opin Pharmacol. 2006;6(4):379–386. doi: 10.1016/j.coph.2006.01.010. [DOI] [PubMed] [Google Scholar]
- 20.Ito S, et al. Interleukin-10 inhibits expression of both interferon alpha- and interferon gamma- induced genes by suppressing tyrosine phosphorylation of STAT1. Blood. 1999;93(5):1456–1463. [PubMed] [Google Scholar]
- 21.Kurte M, et al. A synthetic peptide homologous to functional domain of human IL-10 down-regulates expression of MHC class I and transporter associated with antigen processing 1/2 in human melanoma cells. J Immunol. 2004;173(3):1731–1737. doi: 10.4049/jimmunol.173.3.1731. [DOI] [PubMed] [Google Scholar]
- 22.Petersson M, et al. Constitutive IL-10 production accounts for the high NK sensitivity, low MHC class I expression, and poor transporter associated with antigen processing (TAP)-1/2 function in the prototype NK target YAC-1. J Immunol. 1998;161(5):2099–2105. [PubMed] [Google Scholar]
- 23.Salazar-Onfray F, et al. Down-regulation of the expression and function of the transporter associated with antigen processing in murine tumor cell lines expressing IL-10. J Immunol. 1997;159(7):3195–3202. [PubMed] [Google Scholar]
- 24.Terrazzano G, et al. HLA class I antigen downregulation by interleukin (IL)-10 is predominantly governed by NK-kappaB in the short term and by TAP1 + 2 in the long term. Tissue Antigens. 2000;55(4):326–332. doi: 10.1034/j.1399-0039.2000.550406.x. [DOI] [PubMed] [Google Scholar]
- 25.Chen Z, et al. Expression of proinflammatory and proangiogenic cytokines in patients with head and neck cancer. Clin Cancer Res. 1999;5(6):1369–1379. [PubMed] [Google Scholar]
- 26.Woods KV, et al. Variable expression of cytokines in human head and neck squamous cell carcinoma cell lines and consistent expression in surgical specimens. Cancer Res. 1998;58(14):3132–3141. [PubMed] [Google Scholar]
- 27.Sriuranpong V, et al. Epidermal growth factor receptor-independent constitutive activation of STAT3 in head and neck squamous cell carcinoma is mediated by the autocrine/paracrine stimulation of the interleukin 6/gp130 cytokine system. Cancer Res. 2003;63(11):2948–2956. [PubMed] [Google Scholar]
- 28.Duffy SA, et al. Interleukin-6 predicts recurrence and survival among head and neck cancer patients. Cancer. 2008;113(4):750–757. doi: 10.1002/cncr.23615. [DOI] [PubMed] [Google Scholar]
- 29.Meyer F, et al. Serum prognostic markers in head and neck cancer. Clin Cancer Res. 2010;16(3):1008–1015. doi: 10.1158/1078-0432.CCR-09-2014. [DOI] [PubMed] [Google Scholar]
- 30.Heo DS, et al. Biology, cytogenetics, and sensitivity to immunological effector cells of new head and neck squamous cell carcinoma lines. Cancer Res. 1989;49(18):5167–5175. [PubMed] [Google Scholar]
- 31.Bandoh N, et al. Development and characterization of human constitutive proteasome and immunoproteasome subunit-specific monoclonal antibodies. Tissue Antigens. 2005;66(3):185–194. doi: 10.1111/j.1399-0039.2005.00462.x. [DOI] [PubMed] [Google Scholar]
- 32.Ogino T, et al. Endoplasmic reticulum chaperone-specific monoclonal antibodies for flow cytometry and immunohistochemical staining. Tissue Antigens. 2003;62(5):385–393. doi: 10.1034/j.1399-0039.2003.00114.x. [DOI] [PubMed] [Google Scholar]
- 33.Krutzik PO, Nolan GP. Intracellular phospho-protein staining techniques for flow cytometry: monitoring single cell signaling events. Cytometry A. 2003;55(2):61–70. doi: 10.1002/cyto.a.10072. [DOI] [PubMed] [Google Scholar]
- 34.Andrade Filho PA, et al. Novel immunogenic HLA-A*0201-restricted epidermal growth factor receptor-specific T-cell epitope in head and neck cancer patients. J Immunother. 2010;33(1):83–91. doi: 10.1097/CJI.0b013e3181b8f421. [DOI] [PMC free article] [PubMed] [Google Scholar]
- 35.Andrade Filho PA, et al. CD8+ T cell recognition of polymorphic wild-type sequence p53(65–73) peptides in squamous cell carcinoma of the head and neck. Cancer Immunol Immunother. 2010;59(10):1561–1568. doi: 10.1007/s00262-010-0886-1. [DOI] [PMC free article] [PubMed] [Google Scholar]
- 36.Albers A, et al. Antitumor activity of human papillomavirus type 16 E7-specific T cells against virally infected squamous cell carcinoma of the head and neck. Cancer Res. 2005;65(23):11146–11155. doi: 10.1158/0008-5472.CAN-05-0772. [DOI] [PubMed] [Google Scholar]
- 37.Lathers DM, Young MR. Increased aberrance of cytokine expression in plasma of patients with more advanced squamous cell carcinoma of the head and neck. Cytokine. 2004;25(5):220–228. doi: 10.1016/j.cyto.2003.11.005. [DOI] [PubMed] [Google Scholar]
- 38.Lathers DM, Achille NJ, Young MR. Incomplete Th2 skewing of cytokines in plasma of patients with squamous cell carcinoma of the head and neck. Hum Immunol. 2003;64(12):1160–1166. doi: 10.1016/j.humimm.2003.08.024. [DOI] [PubMed] [Google Scholar]
- 39.Lui VW, et al. Antiproliferative mechanisms of a transcription factor decoy targeting signal transducer and activator of transcription (STAT) 3: the role of STAT1. Mol Pharmacol. 2007;71(5):1435–1443. doi: 10.1124/mol.106.032284. [DOI] [PubMed] [Google Scholar]
- 40.Zhong Z, Wen Z, Darnell JE., Jr Stat3: a STAT family member activated by tyrosine phosphorylation in response to epidermal growth factor and interleukin-6. Science. 1994;264(5155):95–98. doi: 10.1126/science.8140422. [DOI] [PubMed] [Google Scholar]
- 41.Dovhey SE, Ghosh NS, Wright KL. Loss of interferon-gamma inducibility of TAP1 and LMP2 in a renal cell carcinoma cell line. Cancer Res. 2000;60(20):5789–5796. [PubMed] [Google Scholar]
- 42.Hayashi T, et al. The mutation in the ATP-binding region of JAK1, identified in human uterine leiomyosarcomas, results in defective interferon-gamma inducibility of TAP1 and LMP2. Oncogene. 2006;25(29):4016–4026. doi: 10.1038/sj.onc.1209434. [DOI] [PubMed] [Google Scholar]
- 43.Setiadi AF, et al. Identification of mechanisms underlying transporter associated with antigen processing deficiency in metastatic murine carcinomas. Cancer Res. 2005;65(16):7485–7492. doi: 10.1158/0008-5472.CAN-03-3734. [DOI] [PubMed] [Google Scholar]
- 44.Haque SJ, et al. Receptor-associated constitutive protein tyrosine phosphatase activity controls the kinase function of JAK1. Proc Natl Acad Sci U S A. 1997;94(16):8563–8568. doi: 10.1073/pnas.94.16.8563. [DOI] [PMC free article] [PubMed] [Google Scholar]
- 45.Baron M, Davignon JL. Inhibition of IFN-gamma-induced STAT1 tyrosine phosphorylation by human CMV is mediated by SHP2. J Immunol. 2008;181(8):5530–5536. doi: 10.4049/jimmunol.181.8.5530. [DOI] [PubMed] [Google Scholar]