Abstract
Protein synthesis and autophagic degradation are regulated in an opposite manner by mammalian target of rapamycin (mTOR), whereas under certain conditions it would be beneficial if they occured in unison to handle rapid protein turnover. We observed a distinct cellular compartment at the trans-side of the Golgi apparatus, the ‘TOR-autophagy spatial coupling compartment’ (TASCC), where (auto)lysosomes and mTOR accumulated during Ras-induced senescence. mTOR recruitment to the TASCC was amino acid- and Rag guanosine triphosphatase (GTPase)-dependent, and disruption of mTOR localization to the TASCC suppressed interleukin-6/8 synthesis. TASCC-formation was observed during macrophage differentiation and in glomerular podocytes; both displayed increased protein secretion. The spatial coupling of cells’ catabolic and anabolic machinery could augment their respective functions and facilitate the mass synthesis of secretory proteins.
During oncogene-induced senescence (OIS) a dynamic transition in phenotype is mediated by multiple effector mechanisms, including the secretory phenotype (1, 2) and autophagy (3). Senescent cells continue to grow in size and produce large amounts of secretory proteins, therefore protein synthesis also seems to be activated. The active protein turnover caused by coupling protein degradation and synthesis may facilitate acute phenotypic regeneration. To understand how these processes are co-regulated during OIS, we examined the spatial relationship between mTOR (4, 5) and autophagy (6, 7) in IMR90 cells stably expressing 4OHT-inducible H-RasV12 (ER:Ras) (3).
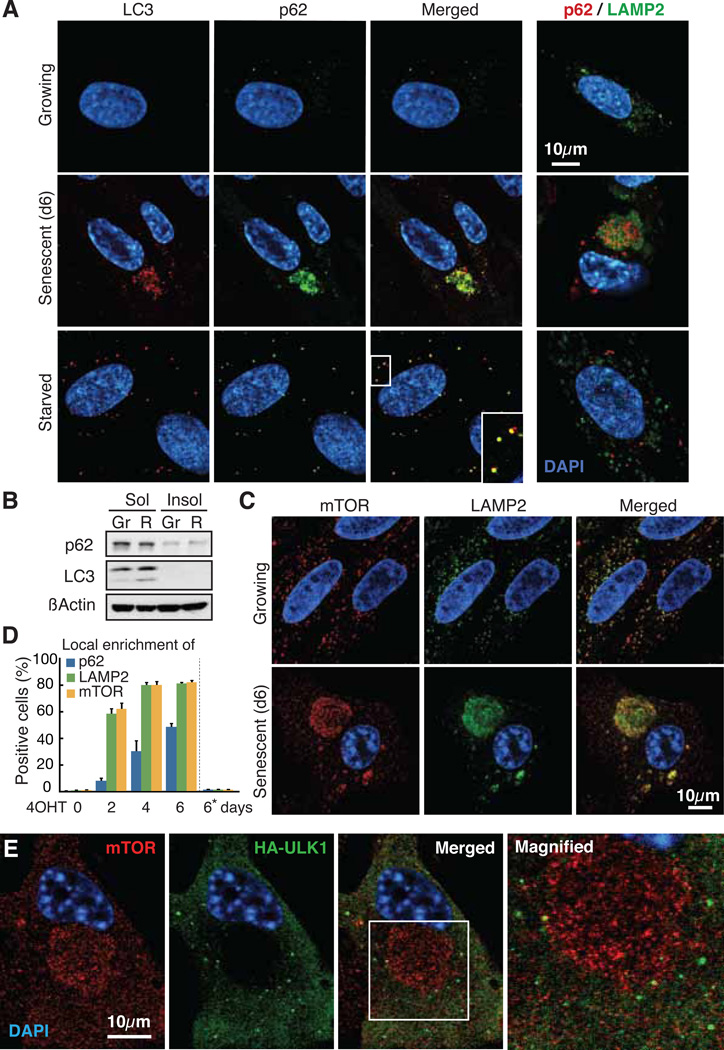
Autophagy markers, p62 and LC3, formed prominent puncta and colocalized throughout the cytoplasm upon amino acid (AA) starvation in IMR90 cells, while growing cells only formed occasional puncta (Fig. 1A) (8–10). In contrast, during Ras-induced senescence (RIS), cells exhibited distinct cytoplasmic areas that were enriched for p62 and LC3 (Fig. 1A). This autophagic area overlapped with senescence-associated-β-galactosidase activity (a lysosomal enzyme) and LAMP2 (a lysosomal protein), suggesting autolysosome enrichment (Fig. 1A, fig. S1, A and B). Locally concentrated p62 can form detergent-insoluble ‘aggresomes’. However, they typically do not colocalize to lysosomes (10, 11) and there was no increase in p62 or LC3 in the Triton X-insoluble fraction during RIS (Fig. 1B), indicating active autophagy (fig. S1C).
Fig. 1.
Spatial association between autophagy and mTOR. (A) Confocal immunofluorescence images. 4OHT was given to ER:Ras-IMR90 cells for 0 (Growing) or 6 days (Senescent). Starved, DMEM without amino acids or serum for 2h. (B) Immunoblot analysis for indicated proteins in 1% Triton-X100 soluble (Sol) and insoluble (Insol) fractions from growing (Gr) and Ras-induced senescent (R) cells. (C) Confocal images of mTOR and LAMP2 immunofluorescence. (D) Quantification of TASCC-formation kinetics (mean ± SEM; n≥3). Asterisk, parental cells treated with 4OHT for 6 days. (E) Confocal images of mTOR and HA immunofluorescence in HA-ULK1 expressing ER:Ras-IMR90 cells.
We next determined the subcellular localization of mTOR, which also congregated in distinct cytoplasmic areas in RIS, but not in growing, cells (Fig. 1C). The mTOR-, LAMP2-, and p62-positive areas overlapped (Fig. 1, C and D, fig. S1D). Furthermore, the mTOR and LAMP2 signals were spatially associated with each other more frequently inside than outside these areas (fig. S2). Thus, protein degradation and synthesis may be spatially coupled during RIS in an area we call the ‘TOR-autophagy spatial coupling compartment’ (TASCC).
mTOR complex 1 (mTORC1) negatively regulates autophagy upstream of the Atg1/ULK complex, which plays an essential role at the early stage of autophagosome formation (12, 13). To test whether autophagosomes are formed outside the TASCC and then move into the TASCC to form autolysosomes, we examined the location of ULK1 and ATG12, which only localize transiently to developing autophagosomes (14–16). The developing autophagosomes containing ULK1/ATG12 were indeed excluded from the TASCC (Fig. 1E, fig. S3 and movie S1). In addition, we used tandem fluorescent (mRFP-GFP)-LC3, in which GFP is more sensitive to acidic conditions than mRFP. Thus, both signals are active in autophagosomes, but the mRFP signal is predominant in autolysosomes (9, 17). The TASCC was mostly occupied by autolysosomes with a prominent red signal, while mixed signals from green and red were found in the isolated puncta surrounding the TASCC (fig. S4). Spatial organization of mTOR and developing autophagosomes may thus allow their simultaneous activation.
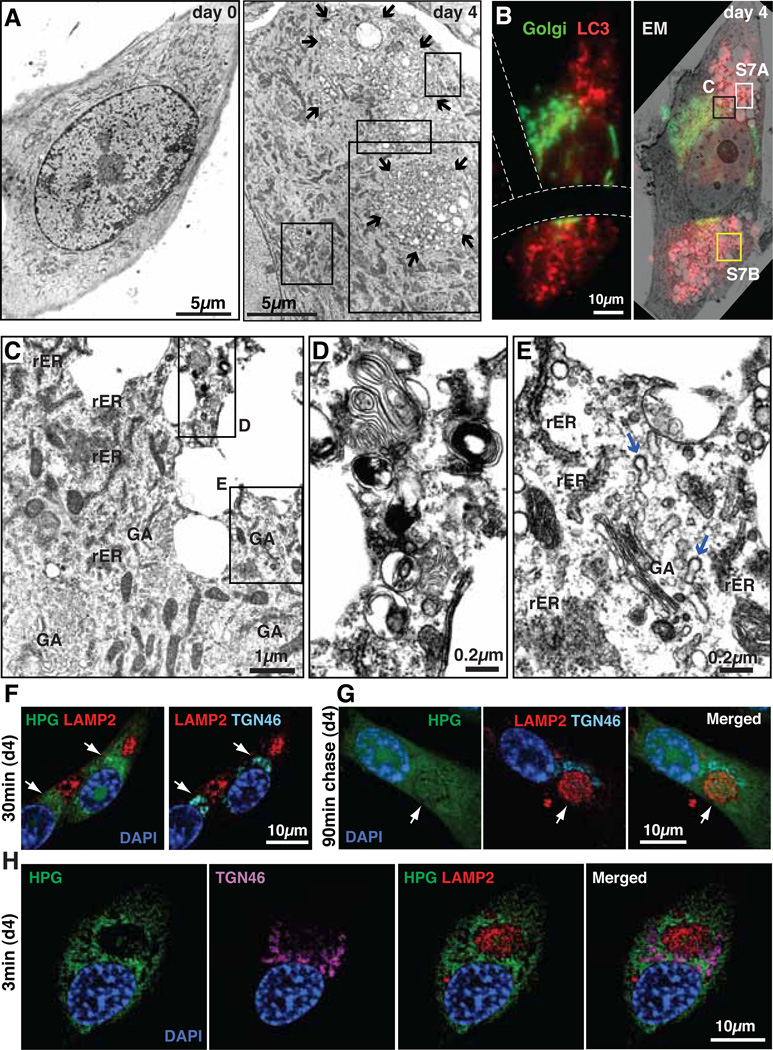
Electron microscopy (EM) analysis also revealed a distinctive cytoplasmic compartmentalization in RIS cells, with prominent autophagic vacuoles (Fig. 2, A to E). Well-developed Golgi apparatus (GA) and vesicles were enriched around these compartments and rough endoplasmic reticulum (rER) was often found adjacent to these compartments, suggesting that high levels of protein synthesis take place around them (fig. S5). Confocal images showed that the trans-Golgi network (TGN), which typically exhibited a perinuclear pattern in growing cells, was mostly positioned close to the TASCC (fig. S6). Fluorescence-EM imaging confirmed the spatial relationship between the GA, rER and TASCC (Fig. 2, B to E, and fig. S7). The TASCC-GA association was recapitulated in mouse papillomas, an in vivo OIS model (fig. S8).
Fig. 2.
Spatial association between TASCC and secretory apparatus. (A) Electron microscopy (EM) of ER:Ras-IMR90 cells. 4OHT was given for 0 or 4 days. Arrows, TASCC. Regions indicated by rectangles are magnified in fig. S5. (B to E) Fluorescence-EM. LC3 (RFP) and Golgi (GFP) were BacMam system labeled at day 4. Dashed lines, grid on coverslip (B). Regions indicated by rectangles are magnified in corresponding figure panels (also fig. S7). GA, Golgi apparatus. Blue arrows, GA-derived coated vesicles. (F to H) Visualization of nascent protein synthesis during Ras-induced senescence (see fig. S9). After 30 min labeling with HPG in day 4 Ras-induced senescent cells (d4), nascent protein was accumulated in TGN (arrows), but not in the TASCC (F). After 90 min chase, nascent protein was readily detected in TASCC (arrows) (G). Short-term (3 min) labeling of HPG to visualize sites of protein synthesis (H).
Lysosomal, membrane and secretory proteins newly synthesized at the rER are processed within the GA and sorted into the TGN. To directly visualize this process, we performed metabolic labeling using a Click-iT methionine analog, L-homopropargylglycine (HPG), which allows us to detect nascent proteins by fluorescence (fig. S9). A 30 min pulse of HPG in RIS cells resulted in a cytoplasmic distribution of the nascent proteins, which were excluded from the TASCC but enriched in the TGN (Fig. 2F). After a 90min chase with normal medium, labeled proteins were readily detected in the TASCC, confirming that proteins actively processed through the rER-GA were enriched in the TASCC (Fig. 2G). Consistently, interleukin-6/8 (IL6/8), senescence-associated secretory proteins, were enriched in the TGN and/or TASCC in RIS cells (fig. S6). After shorter labeling (3min), nascent proteins were often enriched in the area close to the TASCC (Fig. 2H and fig. S9D). The labeled proteins did not yet overlap with the TGN, thus the signal is likely to represent sites of protein synthesis. Similarly IL8 mRNA was detected at the marginal regions of the TASCC, particularly during the early phase of RIS (fig. S10).
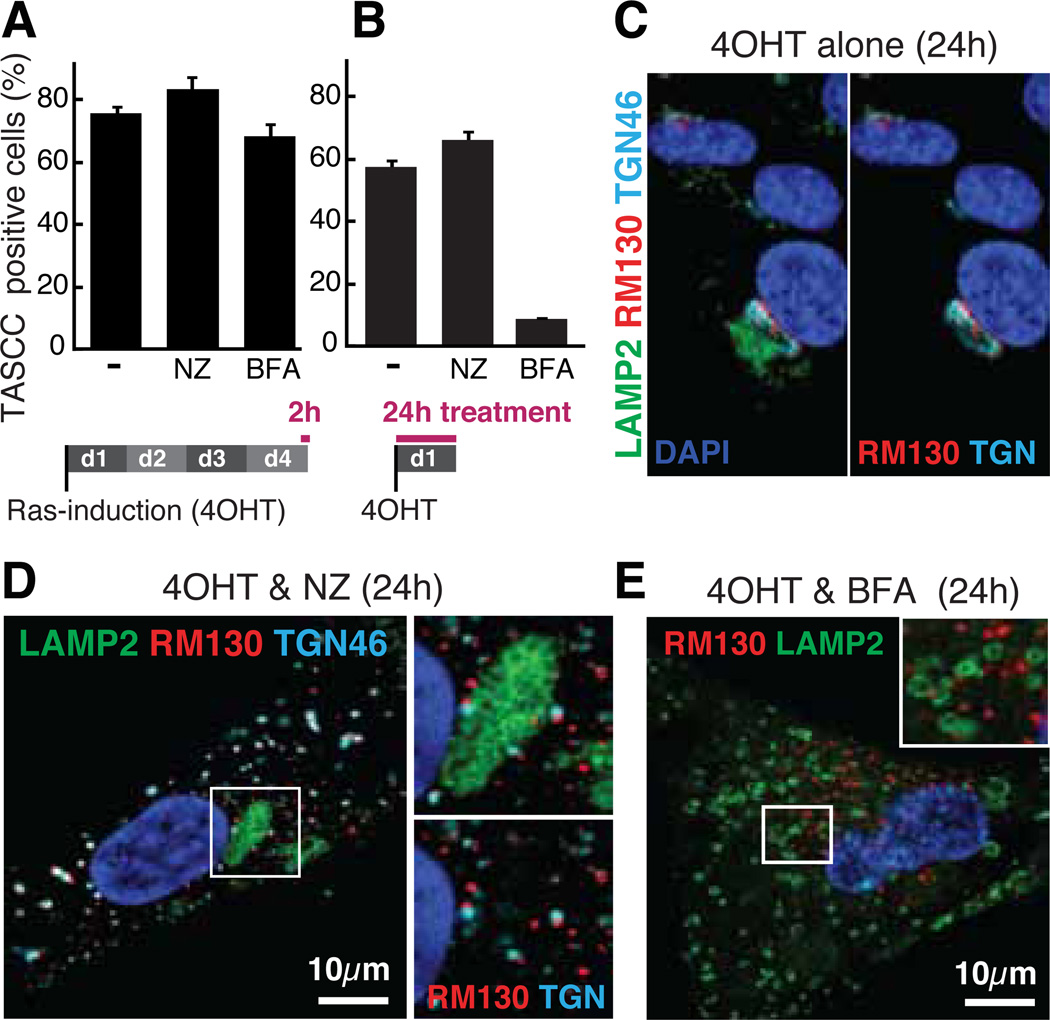
To further characterize the TASCC, we asked whether the microtubule depolymerizing drug nocodazole affects TASCC-formation (fig. S11). The TASCC was intact after 2h treatment at day 4, suggesting that microtubules were not required for TASCC-maintenance (Fig. 3A). Similarly, nocodazole did not prevent TASCC-induction when added upon Ras-induction, for 24h (Fig. 3B). Nocodazole fragments GA, causing ‘mini-stacks’, which are functionally active (18). The spatial relationship between the TASCC and mini-stacks was preserved (Fig. 3, C and D), reinforcing the importance of the process of protein transfer through the rER-GA-TASCC. We next assessed the requirement for a functional rER-GA system for TASCC-formation using brefeldin A (BFA), which effectively blocks protein transport from the ER to GA. BFA did not affect TASCC-maintenance, but did prevent TASCC-formation (Fig. 3B and fig. S11). Importantly, basal non-TASCC lysosomes were intact (Fig. 3E), suggesting that de novo lysosome biogenesis is critical for TASCC-induction. Functional Gene Ontology analysis of day 4 expression microarray data revealed significant enrichment for genes involved in membrane biogenesis, including lysosomes, GA, and ER (fig. S12 and table S1). Thus activated lysosomal and membrane biogenesis may contribute to TASCC-formation in the vicinity of the TGN, where secretory proteins are also processed.
Fig. 3.
Brefeldin A, but not nocodazole, prevents TASCC-formation. (A and B) ER:Ras-IMR90 cells were treated with 10µM nocodazole (NZ), or 40ng/ml brefeldin A (BFA), which were added after (A) or before (B) TASCC-establishment. TASCC was assessed by mTOR/LAMP2 immunofluorescence. (C to E) Representative confocal images of cells treated as in (B). RM130 and TGN46, cis- and trans-Golgi network markers, respectively.
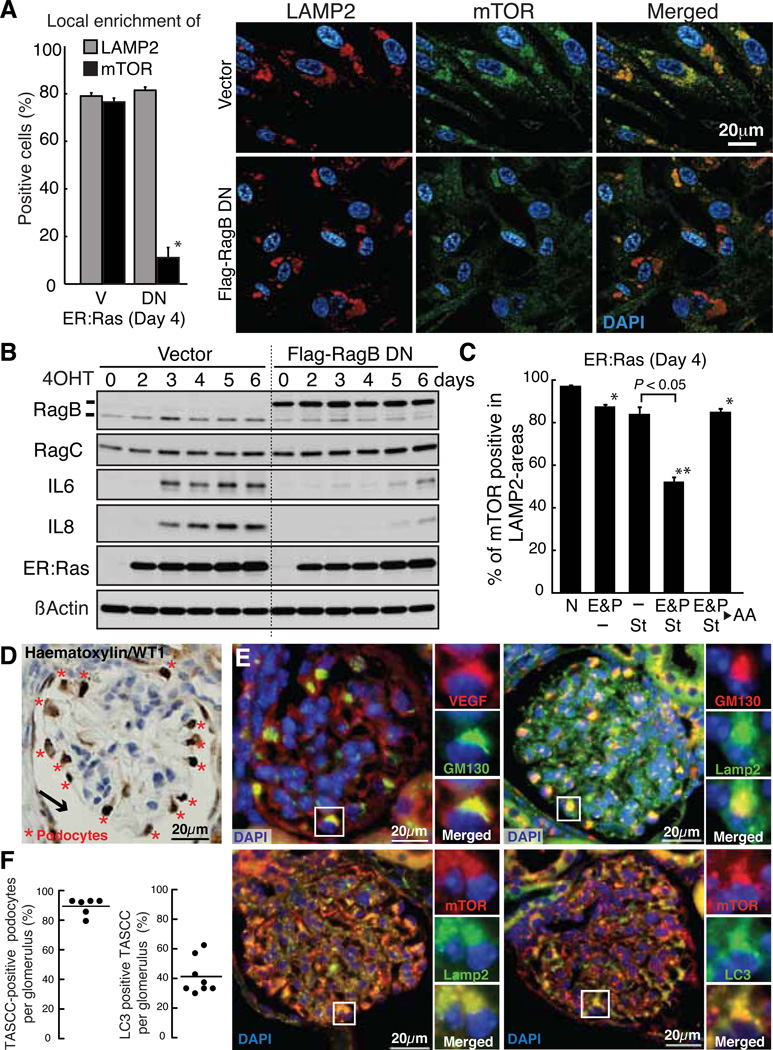
The Rag/Gtr family of small guanosine triphosphatases (GTPases) mediate AA signaling to TORC1 (19, 20). In mammalian cells, in response to AAs, the Rag GTPase complex recruits mTORC1 to lysosomes, where mTOR is activated by Rheb (19, 21). Dominant negative (DN) forms of Rag GTPases can disrupt the AA-mediated mTORC1-lysosome association (19–21). We tested whether Rag GTPases are involved in TASCC-formation. RagB/C were enriched in the TASCC (fig. S13A). When RagB-DN was stably expressed in ER:Ras cells (fig. S13B) there was no obvious effect on LAMP2 enrichment at day 4, nor total mTOR levels (fig. 13C). However, mTOR enrichment in this area was significantly suppressed (Fig. 4A). The induction of IL6/8 during RIS was substantially inhibited post-transcriptionally, indicating a role for Rag GTPase-mediated mTOR-lysosome association in the TASCC (Fig. 4B and fig. S13D).
Fig. 4.
Functional implication of TASCC. (A and B) ER:Ras-IMR90 cells expressing vector (V) or dominant negative mutant RagB-T54N (DN) were assessed for mTOR enrichment to LAMP2-compartments by immunofluorescence (mean ± SEM; n=3) (A). *P < 0.01 relative to V. Immunoblot analysis at time points indicated after Ras-induction (B). (C) Effect of AA-depletion on mTOR enrichment in LAMP2-compartments as in (A). Cells were incubated with AA-free medium supplemented with 10% dialyzed FBS (St) and/or lysosomal protease inhibitors, 10µg/ml E64d and 25µg/ml Pepstatin A (E&P), for 3h. N, normal medium (fig. S14). As an additional control, we restored essential AAs (▸ AA) for 30min after E&P/St treatment (mean ± SEM; n=3). *P < 0.05, **P < 0.01 relative to N. (D) Typical immunohistochemical image of mouse glomerulus. WT1, podocyte marker. Arrow, capsule space. (E) Representative images for indicated proteins in mouse glomeruli show TASCC in podocytes. (F) The percentage of TASCC-positive podocytes (left) and LC3 enrichment per TASCC-positive podocytes (right) in each glomerulus section were plotted. The dots represent glomeruli sampled from two mice.
Because Rag GTPases are AA-specific TOR regulators, we asked whether AAs derived from (auto)lysosomes within the TASCC reinforce mTOR recruitment. We treated cells with inhibitors of lysosomal proteases (E64d and Pepstatin A; E&P) and/or AA-free media (Fig. 4C). AA-depletion showed no obvious effect on the local accumulation of LAMP2 in RIS cells. Three-hour treatment of day 4 ER:Ras cells with E&P or AA-free medium alone showed only marginal effects on mTOR accumulation in the TASCC. When E&P and AA-free medium were combined, enrichment of mTOR was significantly reduced, while enrichment of RagB, which constitutively localizes to lysosomes (21), was not reduced (Fig. 4C and fig. S14). The effect of adding E&P to the AA-free medium on mTOR dispersion was also significant, indicating a contribution of (auto)lysosome-derived AAs to mTOR recruitment at the TASCC (Fig. 4C). Similar results were obtained with ATG5 knockdown (fig. S15).
To identify the TASCC in different systems, we chose HL60 human promyelocytic leukemia cells, which can be differentiated into macrophage-like cells by 12-O-tetradecanoylphorbol-13-acetate (TPA) with transient upregulation of IL8. We found that this surge in IL8 production was associated with the concomitant activation of autophagy (fig. S16, A to C). After TPA treatment, a substantial population of attached cells exhibited local enrichment for mTOR, RagB, lysosomes, and autophagy vacuoles at perinuclear regions, which were spatially associated with IL8 and TGN, suggesting that the TASCC is also involved in macrophage differentiation (fig. S16, D to F and fig. S10C).
Looking for TASCC in a more physiological setting, we examined mouse renal glomerular podocytes, a core element of the filtration barrier in glomeruli. Podocytes, identified within regions facing capsule space in glomerulus sections (Fig. 4D), play a critical role in the constant turnover of glomerular basement membrane and endothelium maintenance by secreting vascular endothelial growth factor (VEGF) and many other factors. Podocytes exhibit an unusually high level of constitutive autophagy (22), suggesting simultaneous activation of anabolic and catabolic processes. We detected prominent GA, which were accompanied by enriched VEGF, mTOR, Lamp2, and LC3 (Fig. 4, E and F).
Recent reports have shown that AA re-addition induces Rag GTPase-dependent mTORC1-lysosome compartmentalization (19, 21), and we now provide evidence for functional relevance for this process. We propose a model that may explain how cells can activate both protein synthesis and autophagic degradation (fig. S17). The spatial integration of rER-GA, autolysosomes, and mTOR creates a self-enhancing system, where autolysosome-derived AAs reinforce mTOR enrichment and activity (23), leading to the efficient synthesis of secretory and lysosomal proteins (5). Furthermore, the TASCC might also function to sequester mTOR. Since the TASCC can be found in diverse contexts, it may represent a general mechanism for rapid protein turnover.
Supplementary Material
Acknowledgments
We thank K. Ryan, N. Mizushima, F. Watt, and R. Rios for reagents; R. Rios, D. Tuveson, T. Kanaseki, I. Mills, N. Dolman, and members of Narita lab for helpful discussion; L. Blackburn for editing; CRI’s Genomics, Bioinformatics, Microscopy (J. Harris), and Histopathology facilities for technical support; Gurdon institute’s Microscopy facility (A. Sossick) for OMX. This work was supported by the University of Cambridge, Cancer Research UK, Hutchison Whampoa Ltd.; Grants-in-Aid of Scientific Research from Ministry of Education, Culture, Sports, Science and Technology of Japan, and the Program for Promotion of Fundamental Studies in NIBIO (S.A and S.S.); Juvenile Diabetes Research Foundation Award and NIH grant DK083491 (K.I.). Expression data are available at NCBI GEO, accession number GSE28464.
References and Notes
- 1.Kuilman T, Peeper DS. Nat Rev Cancer. 2009;9:81–94. doi: 10.1038/nrc2560. [DOI] [PubMed] [Google Scholar]
- 2.Coppe JP, Desprez PY, Krtolica A, Campisi J. Annu Rev Pathol. 2010;5:99–118. doi: 10.1146/annurev-pathol-121808-102144. [DOI] [PMC free article] [PubMed] [Google Scholar]
- 3.Young ARJ, et al. Genes & Development. 2009;23:798–803. doi: 10.1101/gad.519709. [DOI] [PMC free article] [PubMed] [Google Scholar]
- 4.Wullschleger S, Loewith R, Hall MN. Cell. 2006;124:471–484. doi: 10.1016/j.cell.2006.01.016. [DOI] [PubMed] [Google Scholar]
- 5.Ma XM, Blenis J. Nat Rev Mol Cell Biol. 2009;10:307–318. doi: 10.1038/nrm2672. [DOI] [PubMed] [Google Scholar]
- 6.He C, Klionsky DJ. Annu Rev Genet. 2009;43:67–93. doi: 10.1146/annurev-genet-102808-114910. [DOI] [PMC free article] [PubMed] [Google Scholar]
- 7.Nakatogawa H, Suzuki K, Kamada Y, Ohsumi Y. Nat Rev Mol Cell Biol. 2009;10:458–467. doi: 10.1038/nrm2708. [DOI] [PubMed] [Google Scholar]
- 8.Kabeya Y, et al. EMBO J. 2000;19:5720–5728. doi: 10.1093/emboj/19.21.5720. [DOI] [PMC free article] [PubMed] [Google Scholar]
- 9.Pankiv S, et al. Journal of Biological Chemistry. 2007;282:24131–24145. doi: 10.1074/jbc.M702824200. [DOI] [PubMed] [Google Scholar]
- 10.Komatsu M, et al. Cell. 2007;131:1149–1163. doi: 10.1016/j.cell.2007.10.035. [DOI] [PubMed] [Google Scholar]
- 11.Johnston JA, Ward CL, Kopito RR. The Journal of Cell Biology. 1998;143:1883–1898. doi: 10.1083/jcb.143.7.1883. [DOI] [PMC free article] [PubMed] [Google Scholar]
- 12.Mizushima N. Curr Opin Cell Biol. 2010;22:132–139. doi: 10.1016/j.ceb.2009.12.004. [DOI] [PubMed] [Google Scholar]
- 13.Chan EY, Kir S, Tooze SA. J Biol Chem. 2007;282:25464–25474. doi: 10.1074/jbc.M703663200. [DOI] [PubMed] [Google Scholar]
- 14.Hara T, et al. The Journal of Cell Biology. 2008;181:497–510. doi: 10.1083/jcb.200712064. [DOI] [PMC free article] [PubMed] [Google Scholar]
- 15.Jung CH, et al. Mol Biol Cell. 2009;20:1992–2003. doi: 10.1091/mbc.E08-12-1249. [DOI] [PMC free article] [PubMed] [Google Scholar]
- 16.Mizushima N, Yoshimori T, Levine B. Cell. 2010;140:313–326. doi: 10.1016/j.cell.2010.01.028. [DOI] [PMC free article] [PubMed] [Google Scholar]
- 17.Kimura S, Noda T, Yoshimori T. Autophagy. 2007;3:452–460. doi: 10.4161/auto.4451. [DOI] [PubMed] [Google Scholar]
- 18.Thyberg J, Moskalewski S. Experimental Cell Research. 1999;246:263–279. doi: 10.1006/excr.1998.4326. [DOI] [PubMed] [Google Scholar]
- 19.Sancak Y, et al. Science. 2008;320:1496–1501. doi: 10.1126/science.1157535. [DOI] [PMC free article] [PubMed] [Google Scholar]
- 20.Kim E, Goraksha-Hicks P, Li L, Neufeld TP, Guan K-L. Nat Cell Biol. 2008;10:935–945. doi: 10.1038/ncb1753. [DOI] [PMC free article] [PubMed] [Google Scholar]
- 21.Sancak Y, et al. Cell. 2010:1–14. [Google Scholar]
- 22.Hartleben B, et al. J Clin Invest. 2010;120:1084–1096. doi: 10.1172/JCI39492. [DOI] [PMC free article] [PubMed] [Google Scholar]
- 23.Yu L, et al. Nature. 2010;465:942–946. doi: 10.1038/nature09076. [DOI] [PMC free article] [PubMed] [Google Scholar]
Associated Data
This section collects any data citations, data availability statements, or supplementary materials included in this article.


