Abstract
Background
Two major problems for translating gene therapy for heart failure therapy are: safe and efficient delivery and the inability to establish a relationship between vector exposure and in vivo effects. We present a pharmacokinetics (PK) analysis of molecular cardiac surgery with recirculating delivery (MCARD) of scAAV6-βARKct. MCARD’s stable cardiac specific delivery profile was exploited to determine vector exposure, half-life, and systemic clearance.
Methods and Results
Five naive sheep underwent MCARD with 1014 genome copies of scAAV6-βARKct. Blood samples were collected over the recirculation interval time of 20 minutes and evaluated with quantitative polymerase chain reaction (qPCR). C(t) curves were generated and expressed on a log scale. The exposure, half-life, and clearance curves were generated for analysis. qPCR and Western blots were used to determine biodistribution. Finally, all in vivo transduction data was plotted against MCARD’s PK to determine if a relationship existed. Vector concentrations at each time point were (cardiac and systemic, respectively): 5 minutes: 9.16 ± 0.15 and 3.21 ± 0.38; 10 minutes: 8.81 ± 0.19 and 3.62 ± 0.37; 15 minutes: 8.75 ± 0.12 and 3.69 ± 0.31; and 20 minutes: 8.66 ± 0.22 and 3.95 ± 0.26; P <.00001. The half life of the vector was 2.66 ± 0.24 minutes. PK model data revealed that only 0.61 ± 0.43% of the original dose remained in the blood after delivery, and complete clearance from the system was achieved at 1 week. A PK transfer function revealed a positive correlation between exposure and in vivo transduction. Robust βARKct expression was found in all cardiac regions with none in the liver.
Conclusion
MCARD may offer a viable method to establish a relationship between vector exposure and in vivo transduction. Using this methodology, it may be possible to address a critical need for establishing an effective therapeutic window.
Keywords: Cardiac gene therapy, gene pharmacokinetics, cardiac surgery, beta adrenergic signaling system
The transfer of therapeutic transgenes for the treatment of heart failure has emerged as an attractive strategy, because novel pharmacologic and surgical interventions fail to extend 5-year survival rates. Extensive preclinical studies have provided solid proof of concept data indicating gene therapy’s clinical potential, whereby the expression of selected transgenes in the myocardium enhances contractility, restores global function, and in some cases completely reverses chronic heart failure.1–3 Even with an improved understanding of vector design for cardiac application4 and advances in delivery systems, regulatory scrutiny remains high. Recently, the cardiac gene therapy field has gained significant momentum with promising results emerging from the CUPID phase I/II double-blind “first in man” clinical trial.5 These results notwithstanding, there has been little or no reported effort to establish a critical link between vector exposure and subsequent expression levels predictive of clinical benefit.
Compared with the development of standard cardiac pharmaceuticals, establishing a dose response in cardiac gene therapy for larger organisms has been problematic for several well established reasons. First, standard pharmacokinetics (PK) parameters, such as biologic elimination half-life, bioavailability, and kinetic clearance curves are much more difficult to acquire. Second, unlike standard pharmacologic approaches, gene therapy treatments rely on transduced myocytes to manufacture proteins or nucleic acids (eg, small interfering RNA) that are known to affect disease processes. This “biologic” reliance is problematic in establishing a hit response, because healthy and stressed cells have varying levels of transduction activity. Furthermore, even when cells are healthy, the functional relationship between genome copies (GC) per cell and therapeutic efficacy appears to be highly nonlinear and not necessarily monotonic.
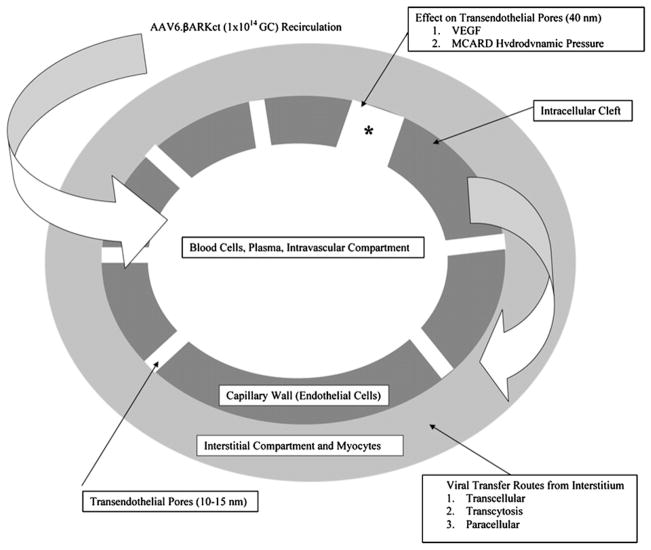
Outside of in vivo variability, the true rate-limiting obstacle to establishing a dose response in cardiac gene therapy has been the inability to achieve a consistent delivery profile as a function of dose levels. Stable delivery, whereby vector is exposed at a reproducible concentration over a known time interval, is a requirement for a quantitative PK analysis. Achieving stable and efficient delivery with a transvascular approach in larger organisms has been problematic owing to more complex transport barriers not operative in small animals (Fig. 1).
Fig. 1.
Diagram of the endothelial barriers as a constraint when transfering gene therapy vector to the interstitium.
To establish this critical link, there is interest in the development of advanced delivery platforms that offer more stability by exposing myocardial tissue to predictable dose levels. Another important problem these novel systems must address when using a vector such as adeno-associated virus is the importance of penetrating the endothelial barrier, requiring separate considerations that affect the efficiency of macromolecular transvascular transport. Furthermore, myocyte-specific and vector-specific cellular uptake and nuclear processing must be considered as well (Fig. 1). Routine cardiac catheterization strategies of delivery are attractive owing to their clinical safety and controlled delivery.6 One striking disadvantage of intracoronary delivery is very low reported transduction efficiencies,7,8 with cardiac expression levels within the range of 0.03 to <1 GC therapeutic DNA per cell. Furthermore, global delivery is not generally achieved and expression is typically limited to the axis of the primary vessel. Transient occlusion of coronary vessels and retrograde perfusion provides improved results compared with standard intracoronary infusion, but these methods may engender significant safety concerns in heart failure patients that have coronary artery disease.8,9 In either case, there is a very low probability of achieving a consistent delivery profile in terms of establishing a dose response, because vector concentration at the site of transfer inevitably washes away into the systemic circulation. In fact, there is >100 times as much vector in the liver than in the heart when delivered using an intracoronary infusion technique,10 thus imposing safety limits.
To address these critical transport issues, our lab has established molecular cardiac surgery with recirculating delivery (MCARD) as a solution to provide both an efficient and a stable delivery profile.11,12 The 2 key features of MCARD are retrograde flow and complete isolation in situ, which specifically facilitates the control of vector concentration and exposure time. This method has allowed us to achieve transduction in the range of 40–100 GC vector per myocyte in left ventricular myocardium, with none in collateral organs.13
In the present study, we attempted to implement a thorough PK analysis of MCARD of a promising therapeutic gene for heart failure, βARKct.14,15 Our aim was 2-fold: to acquire PK data of gene transfer and then to attempt to correlate this data with downstream tissue transduction data after necropsy. A standard 2-compartment model was applied to quantify the effects of a single large 1014 GC vector dose. We anticipated that MCARD’s PK could be used as metrics to correlate with the in vivo transduction data derived from tissues at animal sacrifice. We hoped to demonstrate for the first time in a translational gene therapy study that it may be possible to establish a highly desirable therapeutic index with superior delivery.
Methods
The complete study design consisted of 3 separate parts:
MCARD of gene with blood sample collection and variable monitoring.
Applying a PK model to the data derived from blood samples and components.
Quantitative analysis of GC biodistribution in tissues after animal sacrifices at 10 weeks.
Surgical and Blood Collection Protocol
MCARD of βARKct
Heparin was administered (130 U/kg) and redosed to maintain an activated clotting time of >400 seconds. A median sternotomy was performed, and a transepicardial echocardiogram was used to evaluate global cardiac function before cannulation. The right carotid artery was then cannulated for systemic perfusion. The aortic root vent, superior vena cava (SVC) cannula and retrograde cardioplegia catheter were placed, and partial cardiopulmonary bypass was initiated. The inferior vena cava (IVC) was cannulated; full cardiopulmonary bypass ensued; the right and the left azygous (hemiazygous) veins were ligated; the IVC and SVC were doubly snared; and vent cannulas were placed into the left ventricular (LV) cavity through the apex and into the right ventricle through the outflow tract. The LV, right ventricular, and aortic root vents were connected via a Y-connector to the venous limb of the cardiac venous return circuit. The arterial limb of the cardiac circuit was connected to the coronary sinus catheter. The cardiac circuit was primed with Plegisol. The aorta was cross-clamped. Cold (4°C) crystalloid cardioplegia was delivered antegrade. The heart was isolated by tightening the SVC and IVC snares, cross-clamping the pulmonary artery. Cardiac circuit flow was initiated briefly (~15 seconds) until the coronary sinus pressure equaled 80 mm Hg. Flow was 60–100 mL/min. The virus solution (1014 GC self-complimentary AAV6. CMV.βARKct in phosphate-buffered saline solution [PBS]) was injected into the retrograde catheter and recirculated for 20 minutes, with coronary sinus pressure of 80 mm Hg, and flow adjusted to maintain a constant coronary sinus pressure. The coronary circuit was then flushed antegrade with Hespan to wash out residual vector. The aortic cross-clamp was removed, and rewarming was initiated. Postprocedure transepicardial echocardiogram confirmed maintenance of global cardiac function. As the animal was being weaned from bypass, the first branch of the obtuse marginal artery was identified and a Prolene snare stitch was loosely applied, advanced exteriorly through the chest wall, and buried in the subcutaneous fascia. The animal was subsequently weaned completely from coronary bypass and closed in standard fashion. Animal subjects recovered from anesthesia, received critical cardiac postoperative care without incident, and survived to their being killed at 10 weeks.
Sample Collection and Circuit Data Monitoring During the Procedure
Blood samples and key variables were acquired in parallel with the MCARD procedure described above. Before the cardiac circuit’s initiation, the first key variable to record was the start volume of the cardiac circuit. This was approximated reasonably as the full amount of blood removed and emptied to the waste container during exsanguination.
The time zero reference of the collection procedure was just after all vector genome content was infused into the cardiac circuit with recirculation commencing. Blood samples were collected and stored in 3 mL EDTA tubes (BD, Franklin Lakes, New Jersey) from both circuits at 0, 5, 10, 15, and 20 minutes. Five additional samples were taken from the systemic circulation at 40 minutes, 1 hour, 1 day, 4 days, and 1 week after MCARD.
Blood Sample Processing and Model Derivation
qPCR Analysis for Cardiac/Systemic Blood Samples and Components
Real-time polymerase chain reaction (PCR) was performed using the MyiQ Real-Time PCR Detection System and analyzed using the MyiQ software package (Bio-Rad Laboratories).
The DNA from blood was isolated by the High Pure Viral Nucleic Acid Kit (Roche Applied Science) according to manufacturer’s protocol. For quantitative (q) PCR assay, 5 μL eluted viral DNA was taken per reaction. Samples were analyzed in duplicate or triplicate in optical 96-well plates using iQ Sybr Green Supermix (Bio-Rad Laboratories) and βARKct-specific primers (forward 5′-ATGCATGGCTACATGTCCAA-3′ and reverse 5′-ATCTCCTCCATGGTCAGCAG-3′). Total volume of each reaction was 25 μL.
As a positive control and a reference for measurement of the exact copy number of a transcript in blood samples, we used OriGene qPCR qPCR primer pairs and template standards against Homo sapiens gene ADRBK1 NM_001619, SCU no. HK200617. Six template-standard 10-fold dilutions with copy numbers from 1,000,000 to 10 were used as the external quantization standard.
PCR for standard curve and unknown samples was performed simultaneously in the same run. Reactions were performed using the 2-step amplification plus melting curve protocol with the following conditions: 95°C for 3 minutes; 40 cycles of 95°C for 10 seconds and 60°C for 45 seconds. The melt curve protocol began immediately after amplification and consisted of 1 minutes at 60°C followed by 10-second steps with a 0.5°C increase in temperature at each step.
The viral copy numbers in blood samples were calculated based on the standard curve results by MyiQ software.
Pharmacokinetics Model Derivation
To validate the transfer model, samples were drawn from various lines, waste containers, and the field to ensure no loss of vector. qPCR consistently tested these components to contain much less than 0.0001% of initial vector dose; therefore, we considered these residuals to be negligible in the analysis. Blood PCR results from the MCARD cases were loaded into Matlab full version 9.0a to generate C(t) curves for both the cardiac and the systemic perfusion circuits.
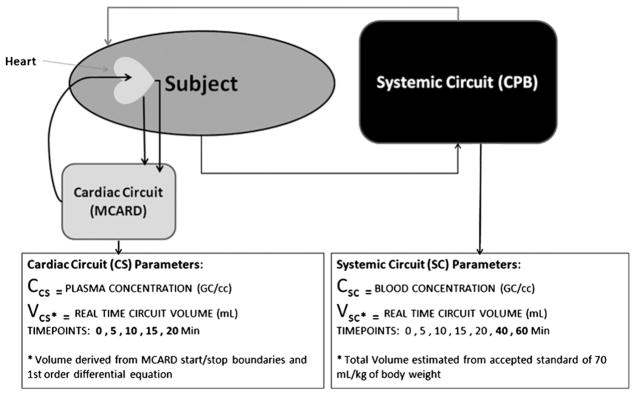
Two separate 1-compartment PK models (Fig. 2) were developed to plot the concentration and volume distribution. The distribution volume was modeled as follows for the cardiac circuit:
Fig. 2.
Pharmacokinetics model for MCARD gene transfer.
Initial start volume was logged as the total decompression volume; this was defined as the volume removed from the circuit such that the heart was visibly compressed.
A first-order differential equation, standard for a 1-compartment PK model, was implemented to model the cardiac circuit volume over time, for systemic dilution (eluted systemic circuit influx) and voluntary removal to avoid intraprocedure heart distention.
The modeled effective number of GC within the cardiac circuit was then derived from the blood PCR-derived concentrations multiplied by the distribution volume for that time point.
The systemic compartment was modeled with a standard estimated cardiopulmonary bypass volume metric of 70 mL/kg body weight assumed to be fixed, given that the rate of elution into the cardiac circuit was minimal.
Postmortem Biodistribution Analysis (mRNA and peptide) of Cardiac and Collateral Organ Tissues
Real-Time qPCR
Real-time (RT) qPCR was performed using the MyiQ RT PCR Detection System (Bio-Rad Laboratories) and analyzed using the MyiQ software package (Bio-Rad Laboratories). The samples were disrupted in liquid nitrogen by using mortar and pestle, followed by homogenization via pipetting. Total RNA was isolated by using the RNeasy Fibrous Mini Kit (Qiagen), according to the manufacturer’s protocol. First-strand cDNA synthesis was performed by reverse transcription of 1 μg total RNA with iScript cDNA Synthesis kit as recommended. RT qPCR analysis was performed in optical 96-well plates by using the iQ Sybr Green Supermix (Bio-Rad Laboratories). To examine the expression of βARKct, 2 sets of specific primers were used: GRK2 forward 5′-CCCTCTCACCATCTCTGAG-3′, reverse 5′-CGGTTGGGGAACAAGTAGAA-3′; and βARKct forward 5′-ATGCATGGCTACATGTCCAA-3′, reverse 5′-ATCTCCTC-CATGGTCAGCAG-3′. The level of 18S rRNA was used to calculate normalized expression. The ΔΔCt analysis was performed by using the IQ5 software.
Western Blotting
Frozen cardiac tissue samples acquired after killing were disrupted by Omni TH Tissue Homogenizer in RIPA lysis buffer (Cell Signaling Technology) supplemented with Complete Protease Inhibitor Cocktail (Roche). Protein extract concentrations were quantified by using Bio-Rad Protein Assay according to the manufacturer’s protocol. A total of 150 μg of each protein sample was loaded into the wells and resolved in a Nupage 12% Bis-Tris gel. For Western blot analysis, proteins were electrotransfered onto 0.45 μm nitrocellulose membranes (Bio-Rad) using the Tris/CAPS buffer system (Bio-Rad) at 0.8 mA/cm2 for 1 hour by a TE70X semidry blotter. Immunostaining was done using a rabbit polyclonal anti-GRK2 antibody (sc-562; Santa Cruz Biotechnology) as a primary with peroxidase-conjugated affinipure F(ab′)2-fragment goat antirabbit IgG antibody (Jackson Immunoresearch) as a secondary and mouse monoclonal anti–GAPDH-peroxidase conjugate antibody (Sigma). Immunodetection was done using Lumi-Light Western Blotting Substrate (Roche) and developing by using Blue Light Autorad film (ISCBioExpress).
Statistical Methods
Paired or unpaired t testing was used to compare between cardiac and systemic time points and GC distribution levels across time.
Results
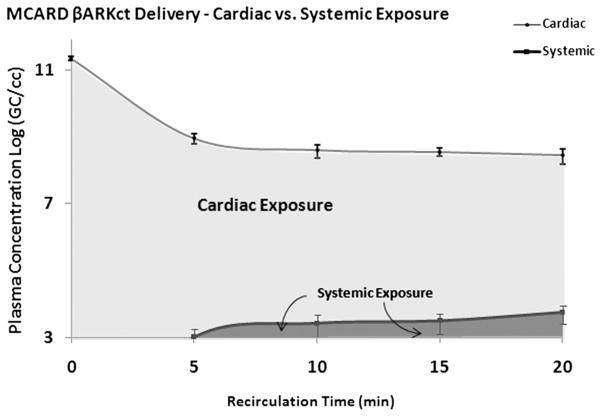
Significantly higher cardiac versus systemic [cardiac; systemic] concentrations were observed (Log GC/mL) over the time of recirculation at 5 minutes [9.16 ± 0.15; 3.21 ± 0.38], 10 minutes [8.81 ± 0.19; 3.62 ± 0.37], 15 minutes [8.75 ± 0.12; 3.69 ± 0.31], and 20 minutes [8.66 ± 0.22; 3.95 ± 0.26] (Fig. 3; P <.00001). The average initial concentration (1014 GC dose/circuit volume) was 11.55 ± 0.08 and a function of cardiac circuit start volume, which varies from subject to subject in the range of 250–400 mL.
Fig. 3.
Cardiac versus systemic circuit concentration over time, with shaded area under the curve demonstrating exposure.
The areas under the concentration-over-time receiver operating characteristic curve (AUCs), a measure of vector exposure, also is depicted in Figure 3. Clearly, the cardiac system was exposed to a much higher recirculating dose than the systemic, thus enhancing the bioavailability required for maximal transfer. Exploiting MCARD’s stable kinetics, we were able to approximate the number of GC not present in either compartment (cardiac/systemic) at the end of the 20 minute recirculation period interval. This was derived by adding the cardiac and systemic absolute GC amount derived from the PK model at 20 minutes: cardiac 11.78 ± 0.43 and systemic 9.18 ± 0.25. The average absolute amount of remaining vector in the blood as a percentage of initial dose was 0.61 ± 0.43%. This represents the dose amount that did not transfer to the cardiac interstitium.
Half-Life
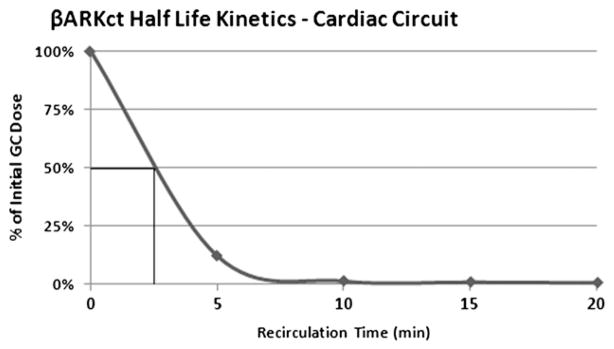
Half-life calculations derived from the PK model (Fig. 4) revealed that on average one-half of the dose (5.0 × 10¹³ GC) is transfered from the cardiac circuit volume at 2.66 ± 0.24 minutes.
Fig. 4.
Half-life of vector genome copies in MCARD per case.
Clearance
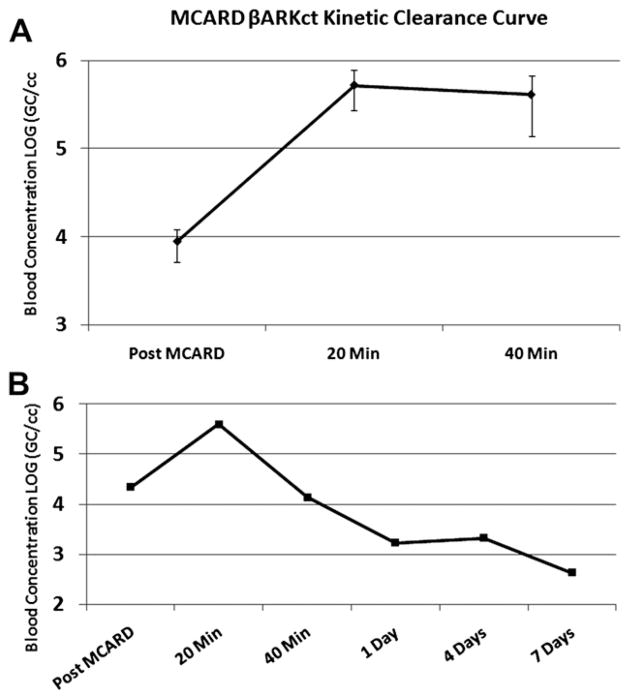
For the clearance assessment, we started with the systemic concentration (GC/mL) value at the end of the 20-minute recirculation interval (3.95 ± 0.26) just before washout and cardiac circuit breakdown. The washout step effectively removes untransfered vector at the end of recirculation, thus minimizing collateral organ exposure once normal pulsatile flow is restored. After washout and cardiac circuit breakdown, there was a slight pattern of increase in systemic concentration at 20 minutes (5.72 ± 0.28) and 40 minutes (5.61 ± 0.45) after MCARD (Fig. 5A). For a complete assessment, we followed 1 animal for 1 day, 3 days, and 7 days after delivery to assess a clearance rate from the system. Consistent with other studies, it appeared that vector is cleared within 1 week (Fig. 5B).
Fig. 5.
(A) Post-MCARD systemic concentration levels. (B) Post-MCARD clearance up to 1 week follow-up.
Biodistribution
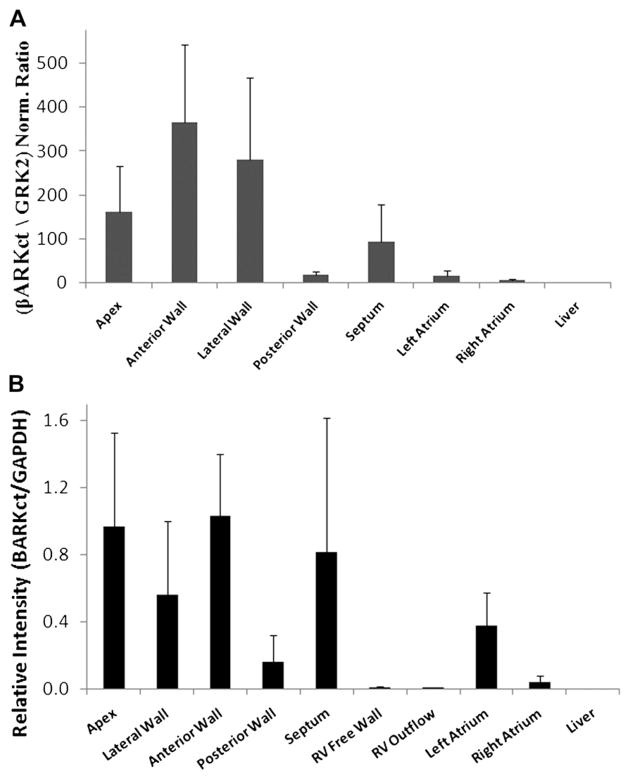
Figure 6 demonstrates MCARD’s cardiac-specific profile, with high average regional mRNA and peptide according to quantitative Western blot in the cardiac regions and none in the liver. These results are direct features of MCARD’s unique ability to provide maximal transfer to myocytes behind the endothelial barriers while at the same time limiting collateral organ exposure. It is evident that exposing the systemic circulation to <1% of the total vector dose results in no measurable gene expression.
Fig. 6.
Cardiac and global biodistribution. (A) qPCR of mRNA. (B) Western blot analysis.
Correlating MCARD Kinetics With in Vivo βARKct Transduction
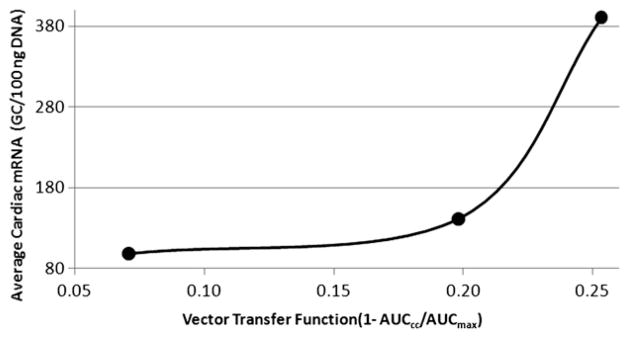
Three of the 5 animals had complete matching blood transfer kinetics data and downstream tissue transduction data (mRNA, protein) available for compilation on a case-by-case basis. Using the the AUC derived from the cardiac circuit concentration points and the average LV mRNA transduction at sacrifice, we attempted to establish a correlation between transfer kinetics and in vivo transduction. To accomplish this, we first derived a vector transfer function (ie, cardiac circuit to interstitium) on basic transport principles. First, because much less than 1% was in the systemic or waste compartments, ie, there was no loss, we assumed that the cardic circuit AUC (AUCcc) for each case could provide a reliable measure of the amount of the remaining vector in the cardiac circuit over MCARD’s 20 minute interval. Assuming no major cardiac circuit loss, the maximum possible amount of untransfered vector or (AUCmax) is simply the initial MCARD concentration times 20 minutes. Therefore, to model vector transfer, an inverse function (ie, higher AUCcc results in lower overall transfer) can be defined indicating that the overall transfer is a function of cardiac circuit AUC:
Referring back to the model in Figure 2, we think that this function is reliable by the simple fact that if no transfer occurred, coupled with negligible loss to the system, AUCcc would be measured to be very close to AUCmax.
We found a positive correlation (plotted in Fig. 7) between the average LV mRNA levels as a function of the vector transfer function. This demonstrates the possibility to establish a relationship between vector exposure at the time of treatment with desired in vivo response, where a dose range study design would be executed.
Fig. 7.
Correlating MCARD transfer kinetics with LV RT-PCR (mRNA) at 10 weeks.
Discussion
In most cases, MCARD transfers >99% of the initial dose from the cardiac circuit to the cardiac interstitium or at the cardiac endothelial barriers, based on these 2 facts: Negligible vector remains in either compartment at the end of the 20-minute recirculation period; and the cardiac and systemic timepoints at 5, 10, 15, and 20 minutes all contain much less than 1% of initial dose (Fig. 3). Our most significant finding was that, surprisingly, most transfer occurs in the first 5 minutes of recirculation. In conjunction with other supporting model data, it is most likely that vector either transfers across the endothelial barriers into the interstitium and/or adheres in capillary endothelial networks. Once vector transgresses into the interstitial compartment, it is there where the adeno-associated virus transduces cells and transfers an episomal cDNA copy into the myocyte’s nucleus for therapy. Based on the present results, we can conclude that recirculation and stable delivery offers the best possible kinetics to determine a relationship between dose and downstream transduction.
To our knowledge, there is little or no quantitative data presented in the literature that can establish a true PK analysis of cardiac gene delivery whereby a known dose-response was determined. In clinical cardiac gene therapy, delivery systems fall under 2 major categories in terms of access: 1) direct or catheter-mediated endocardial or epicardial injection via a needle; and 2) catheter-mediated infusion and or occlusion via coronary vessels. Boekstegers et al and others16,17 have established that intracoronary injection also has an upper limit where levels of expression are not improved with increased dose. Our inspiration for the present study was based on our hypothesis that MCARD uniquely allows for the investigation of the relationship between exposure time and vector concentration on transduction because concentration can be monitored and maintained via true recirculation.
The primary objective of this analysis was 2-fold: 1) to acquire PK data; and 2) to determine correlations between the transfer data and 10-week molecular results. We selected 10 weeks as our terminal endpoint based on the required postoperative recovery period after cardiac surgery, which typically ranges from 4 to 6 weeks. Regarding expression levels, it is well established in numerous studies that 2–4 weeks is required to reach peak expression after delivery.18 From the first phase regarding the PK data, we were able to conclude that with true recirculation, most transfer out of the cardiac circuit occurs on average within 3 minutes, as evidenced by consistent half-life data. MCARD’s 20-minute recirculation window was selected without any prior knowledge of the kinetics. Another key finding was that even with the same surgical configuration and an initial dose of 1 × 10¹⁴ the absolute amount transfered can vary among patients because barriers may have different permeabilities or are less responsive to vasodilating agents,19 such as vascular endothelial growth factor in the present case. This highlights another issue that will most likely limit antegrade approaches, in that most heart failure patients already present with compromised arterial and microcirculatory anatomy, ie, with additional barriers limiting the global delivery to those (ischemic) areas most in need.
The biodistribution results achieved in this cohort of animals was expected, given our previously published results with data indicating 40–100 cDNA copies per cell in the left ventricle.13 An important consideration here, and for ongoing studies is that dose selection most often coincides with acceptable levels of systemic exposure. Compared with other studies, 1 × 10¹⁴ GC is above accepted clinical safety ranges; however, we clearly demonstrate that <1% is bioavailable for systemic exposure. The results clearly illustrate this principle, in that higher doses can be administered if systemic exposure is limited. Even further support for this claim is our survival data for the delivery of this dose, which would be unacceptable given that the highest reported dose in trials is <1 × 10¹³ GC.5 We acknowledge that MCARD’s fundamental bias is based on the assumption that a large percentage of myocytes must be transduced to achieve effective heart failure rescue.
Another very important factor to consider when applying quantitative methods to evaluate myocardial expression levels after delivery is target specificity. Expression levels in the present study represented those of all cell types in the myocardial compartment, which is a limitation considering what would have been a more accurate assessment via analyzing isolated myocyte levels. Basically, a key concern here is that it is technically impossible to selectively target myocytes even with optimal delivery in a diverse population of cells. Even with restricting transfer to the cardiac anatomy, as demonstrated with MCARD, the AAV6 vector has a high tropism for several other cell types located (eg, epithelial, nerve, fibroblast)20 in the myocardial compartment. There is controversy regarding whether this may have an impact on clinical results. The primary safety concern that is often raised is that the transduction of these supporting cells may alter their normal physiologic function and cause subsequent disorder. Our survival data do not support this concern, because there was no noted edema or arrhythmias in any animal in the cohort, suggesting that βARKct transduction, if any, in nerve, endothelial, or other cell types did not alter core physiology. Also, regarding actual transfer to targeted myocytes, these compartmental cells act as passive barriers as they reduce overall bioavailability with each uptake. We speculate that this is another hidden problem with the poor reported transduction efficiencies reported with other delivery methods. We strongly consider that MCARD’s primary competitive advantage versus other methods is controlled retrograde flow, whereby the higher venous-arterial pressure profile and coadministration of vascular endothelial growth factor allows for much more favorable conditions of transport by convection (eg, relaxing tight junctions between endothelial cells) to circumvent this issue. Although MCARD ensures the most efficient transfer with its unique configuration, the required level of dose transfer is completely unknown.
An acceptable or well defined therapeutic range as measured via expression has not been clearly established. Our 3 animals in Figure 7 indicate early evidence that a relationship between the transfer kinetics and downstream myocyte transduction can be quantified. Of course, many more experiments would have to be executed to completely establish this trend. Despite the limitation of 1 dose level, we conclude that PK studies in a wide range of dose levels such as those used in phase II studies may reveal more clearly defined ranges. Therefore, the ultimate goal would be to determine an acceptable level of mRNA and resultant peptide that is required to achieve clinical benefit. It is envisioned that MCARD’s exposure data via stable concentration can elucidate a dose range at a specific recirculation interval that would offer maximal benefit. We believe the present study is the first to demonstrate the drugability concept of gene therapy, where applied pharmacologic science can establish a long-sought therapeutic window for a cardiac gene therapy product.
Acknowledgments
Funding: National Heart Lung and Blood Institute (1-R01-HL083078-01A2).
Footnotes
Disclosures
None.
References
- 1.Katz MG, Swain JD, Tomasulo CE, Sumaroka M, Fargnoli A, Bridges CR. Current strategies for myocardial gene delivery. J Mol Cell Cardiol. 2011;50:766–76. doi: 10.1016/j.yjmcc.2010.09.003. [DOI] [PMC free article] [PubMed] [Google Scholar]
- 2.Rengo G, Lymperopoulos A, Zincarelli C, Donniacuo M, Soltys S, Rabinowitz JE, Koch WJ. Myocardial adeno-associated virus serotype 6-βARKct gene therapy improves cardiac function and normalizes the neurohormonal axis in chronic heart failure. Circulation. 2009;119:89–98. doi: 10.1161/CIRCULATIONAHA.108.803999. [DOI] [PMC free article] [PubMed] [Google Scholar]
- 3.Rengo G, Lymperopoulos A, Leosco D, Koch WJ. GRK2 as a novel gene therapy target in heart failure. J Mol Cell Cardiol. 2011;50:785–92. doi: 10.1016/j.yjmcc.2010.08.014. [DOI] [PMC free article] [PubMed] [Google Scholar]
- 4.Zincarelli C, Soltys S, Rengo G, Koch WJ, Rabinowitz JE. Comparative cardiac gene delivery of adeno-associated virus serotypes 1–9 reveals that AAV6 mediates the most efficient transduction in mouse heart. Clin Transl Sci. 2010;3:81–9. doi: 10.1111/j.1752-8062.2010.00190.x. [DOI] [PMC free article] [PubMed] [Google Scholar]
- 5.Jaski BE, Jessup ML, Mancini DM, Cappola TP, Pauly DF, Greenberg BJ, et al. Calcium upregulation by percutaneous administration of gene therapy in cardiac disease (CUPID trial), a first-inhuman phase 1/2 clinical trial. J Cardiac Fail. 2009;15:171–81. doi: 10.1016/j.cardfail.2009.01.013. [DOI] [PMC free article] [PubMed] [Google Scholar]
- 6.Donahue JK, Kikkawa K, Johns DC, Marban E, Lawrence JH. Ultra-rapid, highly efficient viral gene transfer to the heart. Proc Natl Acad Sci U S A. 1997;94:4664–8. doi: 10.1073/pnas.94.9.4664. [DOI] [PMC free article] [PubMed] [Google Scholar]
- 7.Logeart D, Hatem SN, Heimburger M, Le Roux A, Michel JB, Mercadier JJ. How to optimize in vivo gene transfer to cardiac myocytes: mechanical or pharmacological procedures? Hum Gene Ther. 2001;12:1601–10. doi: 10.1089/10430340152528101. [DOI] [PubMed] [Google Scholar]
- 8.Kaplitt MG, Xiao X, Samulski RJ, Li J, Ojamaa K, Klein IL, et al. Long-term gene transfer in porcine myocardium after coronary infusion of an adeno-associated virus vector. Ann Thorac Surg. 1996;62:1669–76. doi: 10.1016/s0003-4975(96)00946-0. [DOI] [PubMed] [Google Scholar]
- 9.Raake P, Degenfeld G, Hinkel R, Vachenauer R, Sandner T, Beller S, et al. Myocardial gene transfer by selective pressure regulated-retroinfusion of coronary veins: comparison with surgical and percutaneous intramyocardial gene delivery. J Am Coll Cardiol. 2004;44:1124–9. doi: 10.1016/j.jacc.2004.05.074. [DOI] [PubMed] [Google Scholar]
- 10.Bridges CR. “Recirculating cardiac delivery” method of gene delivery should be called “nonrecirculating” method. Gene Ther. 2009;16:939–40. doi: 10.1038/gt.2009.35. [DOI] [PubMed] [Google Scholar]
- 11.Katz MG, Swain JD, Fargnoli A, Bridges CR. Gene therapy during cardiac surgery: role of surgical technique to minimize collateral organ gene expression. Interact Cardiovasc Thorac Surg. 2010;11:727–31. doi: 10.1510/icvts.2010.244301. [DOI] [PMC free article] [PubMed] [Google Scholar]
- 12.Bridges CR, Gopal K, Holt DE, Yarnall C, Cole S, Anderson RB, et al. Efficient myocyte gene delivery with complete cardiac surgical isolation in situ. J Thorac Cardiovasc Surg. 2005;130:1364.e1–e8. doi: 10.1016/j.jtcvs.2005.07.035. [DOI] [PubMed] [Google Scholar]
- 13.White JD, Thesier DM, Swain JB, Katz MG, Tomasulo C, Henderson A, et al. Myocardial gene delivery using molecular cardiac surgery with recombinant adeno-associated virus vectors in vivo. Gene Ther. 2011 Jan 13; doi: 10.1038/gt.2010.168. [Epub ahead of print] [DOI] [PMC free article] [PubMed] [Google Scholar]
- 14.Jones M, Wilson KH, Steenbergen C, Koch WJ, Milano CA. Dose dependent effects of cardiac β2 adrenoreceptor gene therapy. J Surgical Research. 2004;122:113–20. doi: 10.1016/j.jss.2004.06.009. [DOI] [PubMed] [Google Scholar]
- 15.Pleger ST, Boucher M, Most P, Koch WJ. Targeting myocardial beta-adrenergic receptor signaling and calcium cycling for heart failure gene therapy[review] J Card Fail. 2007;13:401–14. doi: 10.1016/j.cardfail.2007.01.003. [DOI] [PubMed] [Google Scholar]
- 16.Boekstegers P, von Degenfeld G, Giehrl W, Kupatt C, Franz W, Steinbeck G. Myocardial gene transfer by selective pressure-regulated retroinfusion of coronary veins. Gene Ther. 2000;7:232–40. doi: 10.1038/sj.gt.3301079. [DOI] [PubMed] [Google Scholar]
- 17.Grossman PM, Han Z, Palasis M, Barry JJ, Lederman RJ. Incomplete retention after direct myocardial injection. Catheter Cardiovasc Interv. 2002;55:392–7. doi: 10.1002/ccd.10136. [DOI] [PubMed] [Google Scholar]
- 18.Wu Z, Asokan A, Samulski RJ. Adeno-associated virus serotypes: vector toolkit for human gene therapy. Mol Ther. 2006;14:316–27. doi: 10.1016/j.ymthe.2006.05.009. [DOI] [PubMed] [Google Scholar]
- 19.Greelish JP, Su LT, Lankford EB, Burkman JM, Chen H, Konig SK, et al. Stable restoration of the sarcoglycan complex in dystrophic-muscle perfused with histamine and a recombinant adeno-associated viral vector. Nat Med. 1999;5:439–43. doi: 10.1038/7439. [DOI] [PubMed] [Google Scholar]
- 20.Halbert CL, Allen JM, Miller AD. Adeno-associated virus type 6 (AAV6) vectors mediate efficient transduction of airway epithelial cells in mouse lungs compared to that of AAV2 vectors. J Virol. 2001;75:6615–24. doi: 10.1128/JVI.75.14.6615-6624.2001. [DOI] [PMC free article] [PubMed] [Google Scholar]


