Abstract
Purpose
Flavonols, a class of polyphenols, show a variety of biological activities such as antioxidant and anticancer. However, rapid in vivo O-glucuronidation posed a challenge to develop them as therapeutic agents. The objective of this paper is to determine the regioselective glucuronidation of flavonols by UGT1A isoforms (i.e., UGT1A1, UGT1A3, UGT1A7, UGT1A8, UGT1A9 and UGT1A10).
Methods
The kinetics of UGT1A1-, 1A3- and 1A7~1A10-mediated metabolisms of four flavonols that contain 7-OH group were characterized and kinetic parameters (Km, Vmax and intrinsic clearance (CLint=Vmax/Km)) were determined.
Results
UGT1A1 and 1A3 regioselectively metabolized 7-OH, whereas UGT1A7~1A10 preferred to glucuronidate 3-OH group. UGT1A1 and UGT1A9 were the most efficient conjugating enzymes with Km of ≤1 µM and Vmax/Km of >3 ml/min/mg protein, resulting in a CLint value as high as 6 ml/min/mg protein. Additionally, the four flavonols generally strongly self-inhibited the UGT1A1-mediated glucuronidation, with Ks (substrate inhibition constant) of ≤ 5.4 µM.
Conclusion
UGT1A isoforms displayed distinct positional preferences between 3-OH and 7-OH in the glucuronidation of flavonols. The differentiated kinetics properties between 3-O- and 7-O- glucuronidation indicated that at least two distinct binding modes within the catalytic domain were responsible for the formation of these two glucuronide isomers.
Keywords: flavonols, glucuronidation, regioselectivity, UGTs, substrate inhibition
Introduction
Dietary flavonoids such as flavonols, flavones and isoflavones are linked to health benefits against ailments such as cancer and heart diseases (1,2). However, rapid glucuronidation of flavonoid in both liver and intestine leads to dominant presence of phase II conjugates such as glucuronides and sulfates rather than the parent compound in the systemic circulation (3). As a consequence, flavonoids have very poor (less than 5%) in vivo bioavailabilities in animals and humans (4,5), which limit their uses as therapeutic agents.
Glucuronidation is a major metabolic pathway either as a primary or secondary (sequential) process in the disposition of xenobiotics (6). It is catalyzed by UDP-glucuronosyltransferases (UGTs), following a SN2 mechanism (7). On the basis of amino acid sequence identity, human UGTs are classified into four families: UGT1, UGT2, UGT3, and UGT8 (8). The most important drug-conjugating UGTs belong to UGT1 and UGT2 families. The human UGT1A gene cluster, located on chromosome 2q37, spans approximately 200 kb. It contains 13 individual promoters/first exons and shared exons 2–5. Each exon 1 spliced to exons 2–5 is regarded as a unique gene which translates to the corresponding active UGT1A isoform excluding the pseudogenes (i.e., UGT1A2p, UGT1A11p, UGT1A12p and UGT1A13p). Among the UGT1A family, 1A8 and 1A10 are expressed almost exclusively in the gastrointestinal tract, 1A3, 1A4 and 1A9 are primarily present in liver, and 1A7 is mainly distributed in stomach or esophagus. In contrast, 1A1 and 1A6 are ubiquitously present in many tissues including liver and gastrointestinal tract (9,10).
Glucuronidation phenotyping using recombinant UGT isoforms had been widely applied in variety of areas: (a) determining the major metabolic pathway of a particular drug (11,12); (b) identifying the main isoform(s) responsible for glucuronidation of a drug (13); (c) correlating glucuronidation between organ and isoform levels (14,15); and (d) in silico modeling of various UGT isoforms and discovering the critical structural characteristics of the substrates that are recognized by the enzyme isoforms (16). The QSAR regression models indicated that substrate hydrophobicity was essential for glucuronidation, which agreed with the location of UGT on the luminal side of endoplasmic reticulum (17). Pharmacophore models identified two key hydrophobic regions adjacent from the site of glucuronidation as the substrate features for UGTs recognition (18).
UGT1A subfamily (except UGT1A4) was mainly responsible for glucuronidating flavonoids and the substrate specificities showed extensive overlaps (14,19). UGT1A4 exclusively metabolized amines containing compounds (20). UGTs biotransform flavonoids into their metabolic derivatives (i.e. glucuronides) by transferring glucuronic acid from the cofactor UDP-glucuronic acid (UDPGA) to the nucleophilic oxygen in the hydroxyl group of the aglycones. Mono-glucuronide isomers are often generated from single flavonoid that bears more than one conjugation site (21,22), because the aglycone-binding domain might permit multiple binding modes of the acceptor or substrate (23). Some key structural features that govern regioselectivity had also been uncovered. For example, 3′-OH group is the major determinant of the regioselectivity of flavonoid glucuronidation by UGT1A1. Flavonoids lacking a 3′-hydroxyl were glucuronidated only at position 7, while those containing 3’-OH group also formed 3′-O-glucuronides and sometimes 4′-O-glucuronides (22). Consistently, human intestine UGTs including UGT1A1and 1A8 were especially effective in conjugating the 3',4' catechol unit of flavonoids (21).
Most of flavonoids bear more than one hydroxyl groups that are available for glucuronidation, however, the chances of getting glucuronidated are varied greatly among the potential sites (24). We have shown that 3-OH and 7-OH were the active positions for UGT1A1 and 1A7~1A10 metabolism using mono- or di-hydroxyflavones (19). Additionally, flavonols were commonly poor substrates of UGT1A4 and 1A6. In this paper, we investigated the kinetics of UGT1A isoforms (UGT1A1, 1A3 and 1A7~1A10) using 4 selected flavonoids having both 3-OH and 7-OH groups. Substrate specificities and regioselectivity were evaluated for each UGT isoform on the basis of their kinetics profiles.
Methods and materials
Materials
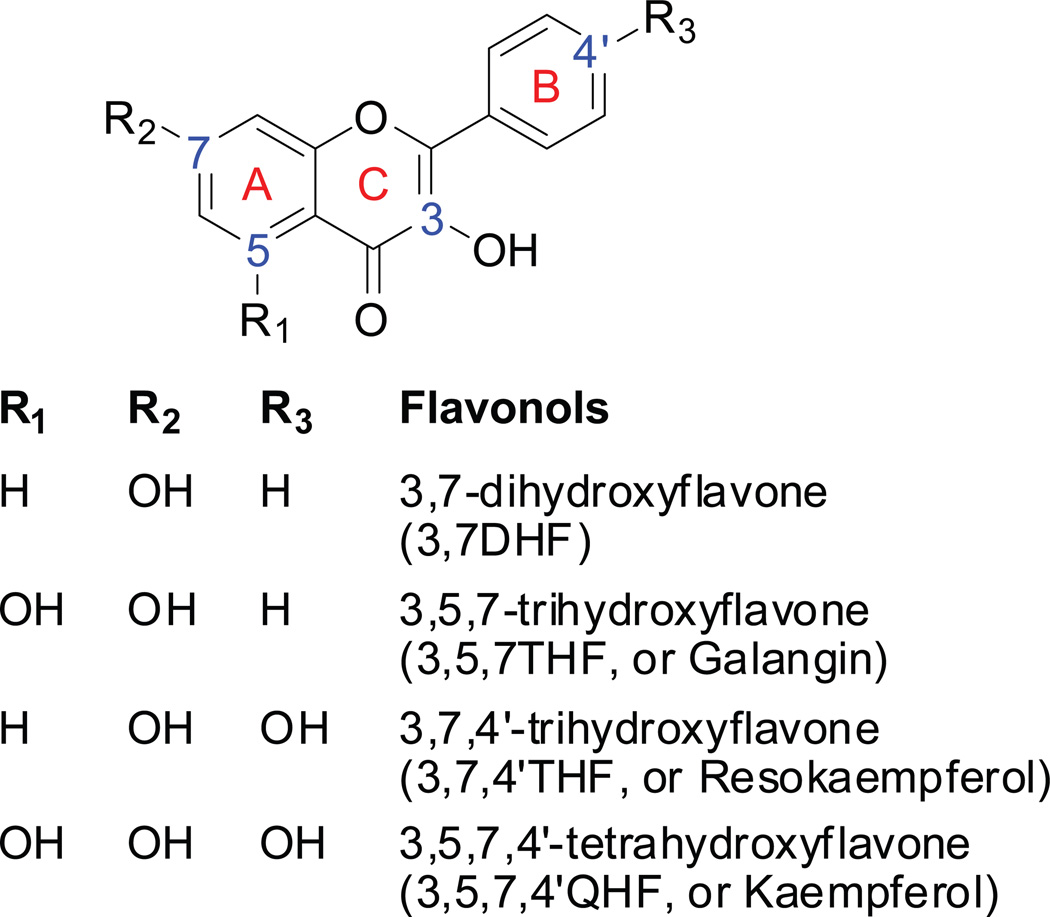
Expressed human UGT isoforms (Supersomes™, i.e., UGT1A1, 1A3, 1A7~1A10) were purchased from BD Biosciences (Woburn, MA). Uridine diphosphoglucuronic acid (UDPGA), alamethicin, D-saccharic-1,4-lactone monohydrate, and magnesium chloride were purchased from Sigma-Aldrich (St Louis, MO). Ammonium acetate was purchased from J.T. Baker (Phillipsburg, NT). Four (4) flavonols (Fig.1) containing both 3-OH and 7-OH groups (i.e., 3,7-dihydroxyflavone (3,7DHF), 3,5,7-trihydroxyflavone, (3,5,7THF) 3,7,4’-tryhydroxyflavone (3,7,4’THF), and 3,5,7,4’-tetrahydroxyflavone(3,5,7,4’QHF)) were purchased from Indofine Chemicals (Somerville, NJ). All other materials (typically analytical grade or better) were used as received.
Figure.1.
Chemical structures of the model flavonols. 3-OH of C-ring and 7-OH of A-ring are the more favored positions for glucuronidation.
UGTs kinetics
Enzyme kinetics parameters of glucuronidation by selected UGT1A isoforms (i.e., UGT1A1, 1A3, 1A7, 1A8, 1A9, and 1A10) were determined by measuring initial glucuronidation rates of flavonols at a series of concentrations. The experimental procedures of UGT assays were exactly the same as our previous publications (14,19,25). Glucuronidation rates were calculated as the amount of formed glucuronide(s) per enzyme quantity per reaction time (in unit of nmol/mg/min). The aglycone substrate concentrations in the range of 0.039–40 µM were used unless method sensitivity or substrate solubility necessitated otherwise. All experiments were performed in triplicates.
UPLC analysis of flavonols and glucuronides
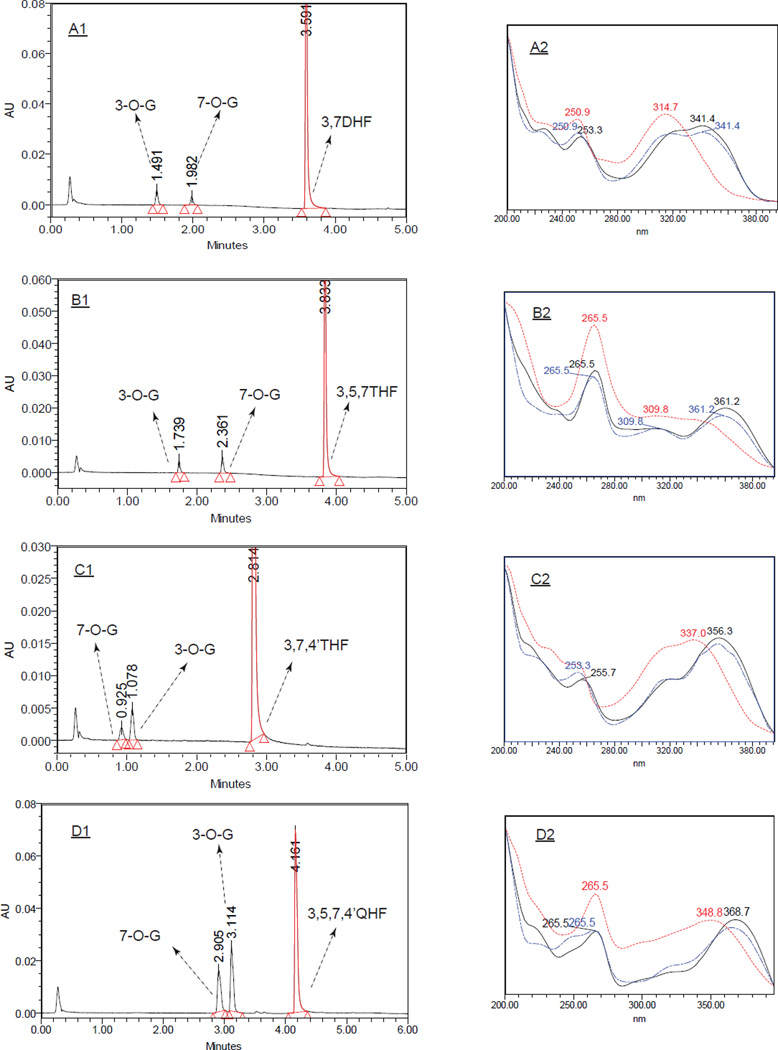
The Waters ACQUITY UPLC (Ultra performance liquid chromatography) system was used to analyze the parent compounds and the formed glucuronides. UPLC methods for each flavonol and the glucuronide(s) were essentially the same as our earlier publication (25), with slight modifications. Briefly, the mobile phase A was 2.5 mM ammonium acetate in purified water (pH=6.5). Mobile Phase B was 100% acetonitrile. The mobile phase was run 5 minutes at a flow rate of 0.45 ml/min with the pre-determined gradient (0 min, 10%B; 0 to 2 min, 10–20%B; 2 to 3 min, 20–40%B; 3 to 3.5 min 40–50%B; 3.5 to 4 min, 50%-90%B; 4 to 4.5 min, 90%B; 4.5 to 5 min, 90–10%). For 3,5,7,4’QHF (kaempferol), different mobile phase B and gradient were adopted: mobile phase B, 100% methanol; and gradient, 0 min, 10% B; 0 to 2 min, 10–20%B; 2 to 3 min, 20–40%B; 3 to 3.5 min, 40–50%B; 3.5 to 4 min, 50–70%B; 4 to 5 min, 70–90%B; 5 to 5.5 min, 90%B; and 5.5 to 6 min, 90–10%B. Quantitation of the glucuronide was based on the standard curve of the parent compound and further calibrated using the conversion factor as described earlier (25). The following is a list of the conversion factors used: 3,7DHF-3-O-Glucuronide, 1.29; 3,7DHF-7-O-Glucuronide, 0.86; 3,7,4’THF-3-O-Glucuronide, 1.10; 3,7,4’THF-7-O-Glucuronide, 0.92; 3,5,7THF-3-O-Glucuronide, 0.71; 3,5,7THF-7-O-Glucuronide, 1.41; 3,5,7,4’QHF-3-O-Glucuronide, 1.00; 3,5,7,4’QHF-7-O-Glucuronide, 0.70. Representative chromatograms and UV spectra are shown in the Fig.2.
Figure.2.
Representative UPLC chromatograms (left) and UV spectra (right) of flavonols and their 3-O- / 7-O-glucuronides. A - D panels represent 3,7DHF, 3,5,7THF, 3,7,4’THF and 3,5,7,4’-QHF and their 3-O- / 7-O-glucuronides, respectively. UPLC samples were from enzyme assays in which the respective 10 µM flaonovls were incubated with 27.5 µg/ml UGT1A9 for 10 or 60 mins. For spectra, (black) solid line denotes the flavonols; (red) dotted lines are 3-O-glucuronides; (blue) dash-dotted lines are 7-O-glucuronides. Comparing to the parent compounds, band I of 3-O-glucuronides either disappeared or resulted in large hypsochromic shifts (to shorter wavelengths) (e.g. 19.3~26.7 nm). In contrast, 7-O-glucuornides caused minimal (<2 nm) or no changes in the UV spectrum (25).
Glucuronide structure identification
Glucuronide structures were identified via a 3-step process as summarized in our earlier publication (25). First, the glucuronides were hydrolyzed by β-D-glucuronidase to the aglycones. Second, the glucuronides were identified as mono-glucuronides which showed mass of [(aglycone’s mass)+176] Da using UPLC/MS/MS, where 176 Da is the mass of the glucuronic acid. The same UPLC/MS/MS instruments and methods in our publication (25) were applied in this paper. Finally, the sites of glucuronidation were confirmed by the “UV spectrum maxima (λmax) shift method”. In general, if a 3-, 5- or 4’-hydroxyl group on the flavonol nucleus was glucuronidated, hypsochromic shifts (i.e. to shorter wavelength) were observed in either Band I (300~380nm) or Band II (240~280 nm). The shift in Band I associated with the substitution of 3-hydroxyl group was in the order of 13 ~ 30 nm. Substitution of 5-hydroxl group resulted in a 5 ~ 15 nm shift in Band II, and glucuronidation of 4’-hydroxyl group produced a 5 ~ 10 nm shift in Band I. In contrast, substitution of the hydroxyl group at position 7 had minimal (<2 nm) or no effect on the λmax of the UV spectrum.
Purification of 3,7DHF-7-O-glucuronide and its structural confirmation via NMR
A large amount of 3,7DHF-7-O-glucuronide was produced using Sprague Dawley female rat liver microsomes. The prepared glucuronide solution was firstly liquid-liquid extracted using methyleenchloride to remove the remaining aglycone. The resultant aqueous solution was then subjected to C-18 solid phase extraction using J.T. Baker Speedisk®48 Pressure Processors (Phillipsburg, NT). The column was conditioned with 4 ml of methanol followed by 2 ml of water. After loading the sample, polar impurities were removed with 2 ml water and the final elution was performed with 4 ml methanol. The methanol was evaporated and the remaining aqueous sample was made of ~4 ml with water. 3,7DHF-7-O-glucuronide was isolated by collecting the preparative column (Phenomenex, Luna C18, 5 µm particle size, 250×10 mm) effluent at its peak time using the HPLC system (1050 series, Hewlett Packard). Replicate injections were made until the entire sample was isolated. The glucuronide solution was then lyophilized to remove the mobile phase. The resulting residue was dissolved in DMSO-d6 and used for NMR spectrum acquisition. The 1H NMR spectrum was recorded on a Bruker Avance 800 MHz NMR spectrometer. Chemical shifts were represented in δ (ppm).
Kinetics analysis
Kinetic parameters (Vmax, Km and Ks (substrate inhibition constant)) were estimated by fitting the initial rate data to Michaelis-Menten and substrate inhibition rate equations by nonlinear least-squares regression. Data analysis was performed by GraphPad Prism V5 for Windows (GraphPad Software, San Diego, CA). The goodness of fit was evaluated on the basis of R2 values, RSS (residual sum of squares), RMS (root mean square) and residual plots (26).
Results
Structure confirmation of 3,7DHF-7-O-glucuronide by NMR
The structure of 3,7DHF-7-O-glucuronide was identified via UPLC/MS/MS coupling UV shift method (Fig.2). The structure was further confirmed by NMR spectra (Tab.1). The chemical shift value (δ) of 3,7DHF were 6.94 ppm for H-6 and 6.89 ppm for H-8. Glucuronidation shifted these signals downfield to 7.07 (Δδ = +0.13 ppm) and 7.30 ppm (Δδ = +0.41 ppm), respectively, which indicated 7-OH position was substituted (27).
Table.1.
1H NMR shifts / δ(DMSO-d6) for 3,7DHF and its 7-O-glucuronide
| Proton position | 3 | 5 | 6 | 7 | 8 | 2’/6’ | 3’/4’/5’ |
|---|---|---|---|---|---|---|---|
| 37DHF | OH | 7.94 | 6.94 | OH | 6.89 | 8.04 | 7.55 |
| 37DHF-7-O-glucuronide | OH | 7.98 | 7.07 | O-Glur | 7.30 | 8.30 | 7.55 |
Regioselective glucuronidation of flavonols by UGT1A1
The selected flavonols (3,7DHF, 3,5,7THF, 3,7,4’THF and 3,5,7,4’QHF) present four possible glucuronidation sites (i.e., 3-OH, 5-OH, 7-OH and 4’-OH). Only 3-O- and 7-O-glucuornides were observed at all studied concentrations for all four compounds (Fig. 3~8). This is consistent with the fact that 4’-OH and 5-OH are typically inactive positions for UGT1As, when 3-OH or 7-OH is also present (19). The kinetics parameters of 3,7,4’THF glucuronidation by 1A3, 1A7, 1A8 and 1A10 were not determined, because the compound was not found to be metabolized by these UGT isoenzymes.
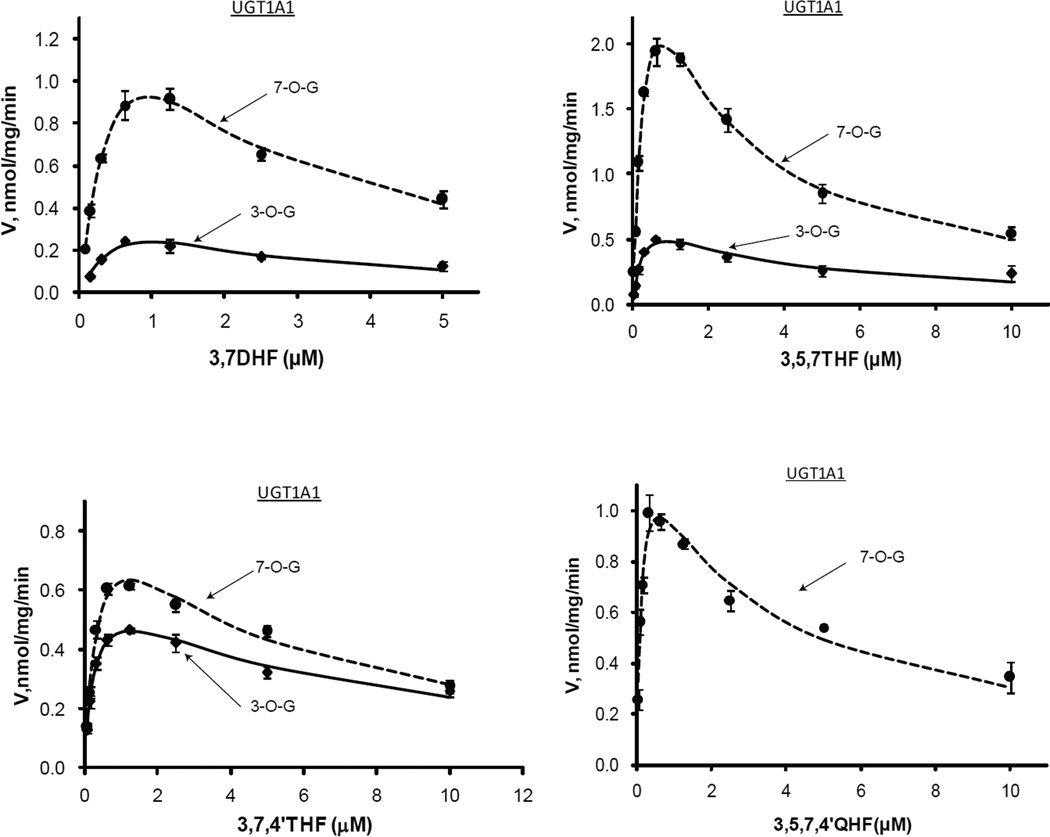
Figure.3.
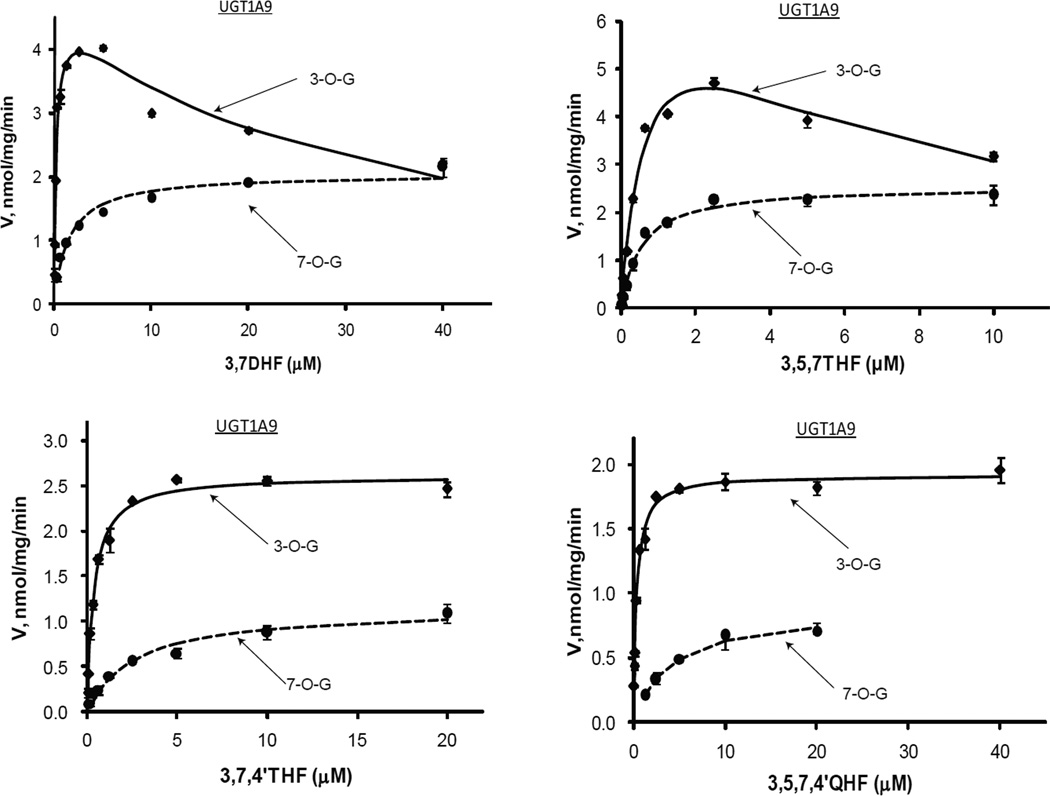
Kinetics profiles of UGT1A1 with four flavonols (3,7DHF, 3,5,7THF, 3,7,4’THF and 3,5,7,4’QHF). For Figures 3~8, solid and dashed lines denote formation rates of 3-O-glucuornides and 7-O-glucuornide of flavonols, respectively. Each data point represents the average of three replicates, and the error bars are standard deviation of the mean. Experimental details are presented under Materials and Methods. For kinetic parameters, please see Table.2 (Figs. 3~4) or Table.3 (Figs. 5~8).
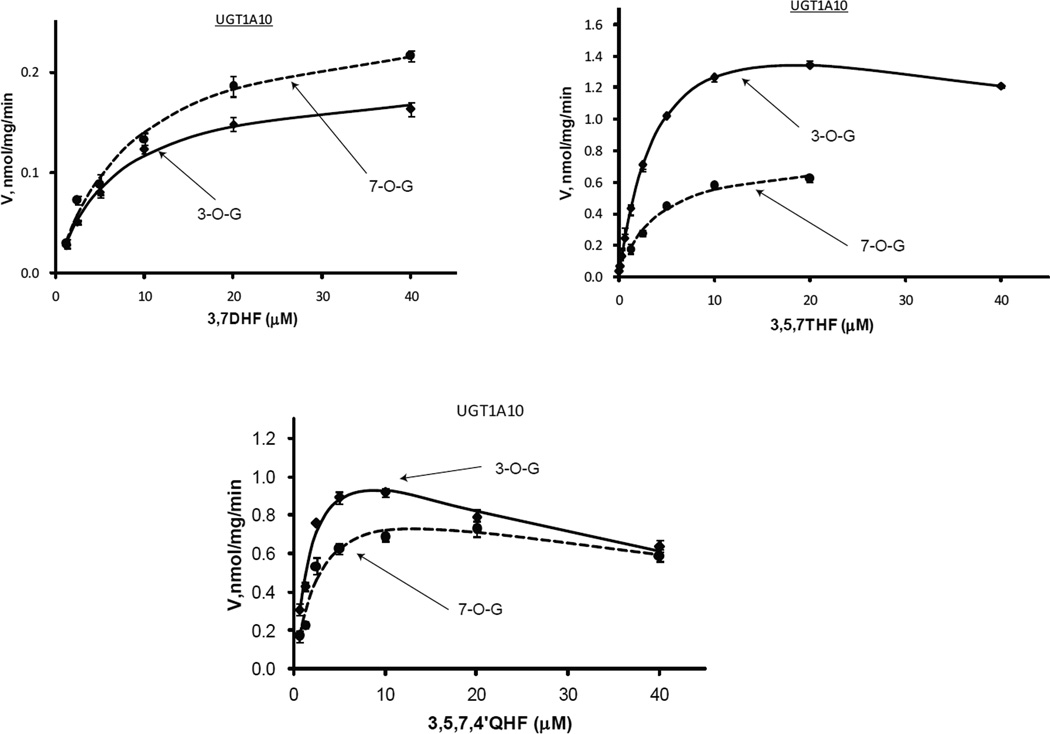
Figure.8.
Kinetics profiles of UGT1A10 with three flavonols (3,7DHF, 3,5,7THF, and 3,5,7,4’QHF).
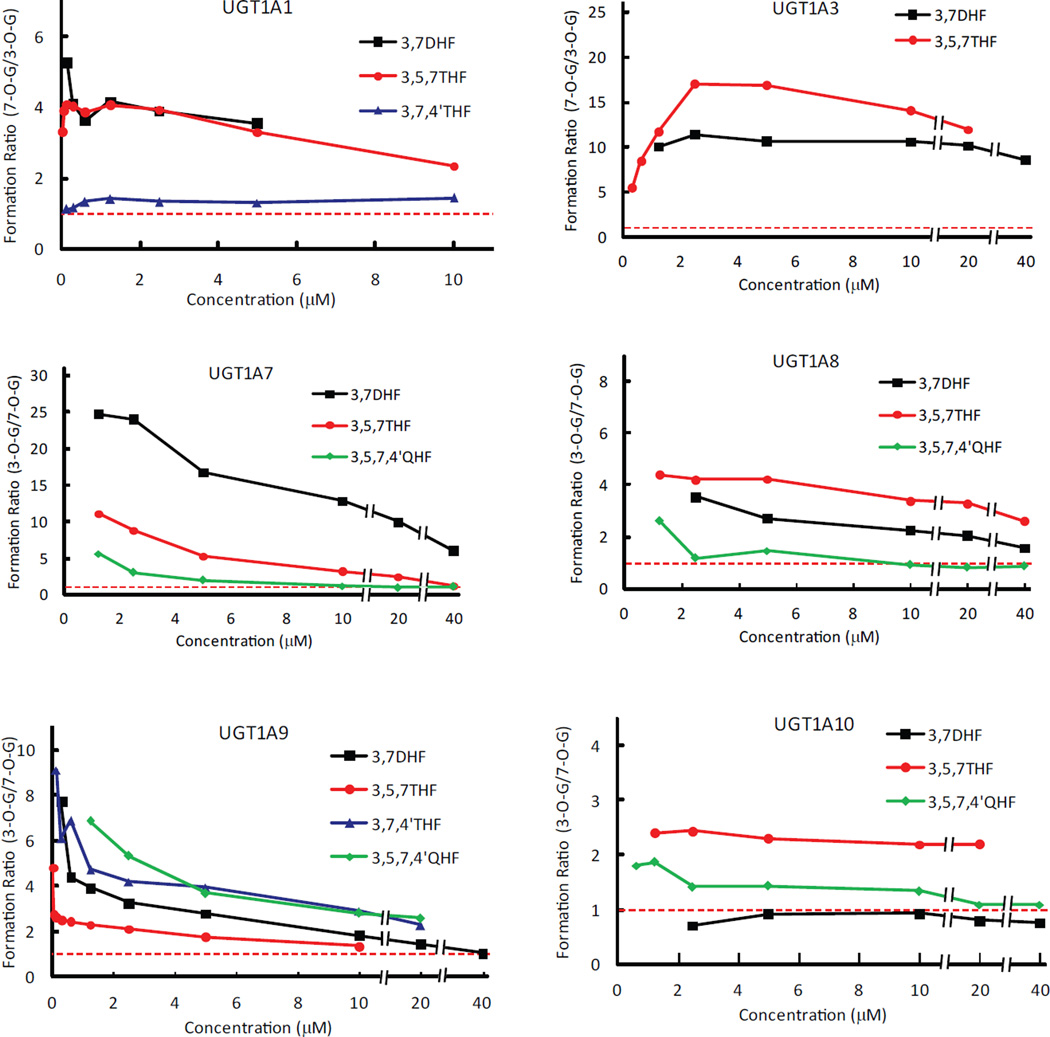
UGT1A1 consistently generated much more flavonol-7-O-glucuronides than 3-O-glucuornides over the tested concentration range for 3,7DHF, 3,5,7THF and 3,5,7,4’QHF (Fig.3). The formation ratios of 7-O-glucuronides/3-O-glucuronides fell into the narrow ranges of 3.5~5.2 and 2.3~3.3 for 3,7DHF and 3,5,7THF, respectively (Fig.9). In the cases of 3,7DHF and 3,5,7THF, Km values were similar between the formation of 3-O- and 7-O-glucuronides (1.57 vs 1.04; 0.31 vs 0.51), but the differences of Vmax values were more than 3 folds in favor of 7-O-glucuronidation (1.02 vs 3.04; 0.82 vs 4.59). Therefore, UGT1A1 had much higher catalytic efficiency (as reflected by Vmax/Km, a.k.a. Intrinsic clearance (Clint)) for 7-OH than that for 3-OH group (greater than 3.4 folds). Together with the fact that the enzyme had the highest binding affinity with 3,5,7,4’QHF but showed medium Vmax, the results suggested that higher binding affinity was not necessarily associated with higher catalytic capacity. For 3,7,4’THF, the formation rates of 7-O-glucuronide were slightly higher than those of 3-O-glucuronide (Fig.3 & 9), and the derived kinetics parameters for the positional glucuronidation were similar to each other (Tab.2).
Figure.9.
Formation rate ratios between 3-O- and 7-O-glucuronides catalyzed by UGT1A1, 1A3 and UGT1A7~1A10. For 7-OH preferred enzymes (UGT1A1 and 1A3), the ratios of 7-O- over 3-O-glucuronidation were plotted against the concentration of corresponding parent compounds, whereas the ratios of 3-O- over 7-O-glucuronidation were plotted for the 3-OH preferred enzymes (UGT1A7~1A10). Reference line of 1 is shown.
Table.2.
The enzyme kinetics parameters for UGT1A1 and 1A3 with appropriate flavonols
| Enzymes | Substrate /Product(s) |
Vmax | Km | Ks | Vmax/Km (CLint) |
|---|---|---|---|---|---|
| nmol/mg/min | µM | µM | ml/min/mg | ||
| UGT1A1 | 3,7DHF | ||||
| 3-O-glucuronide | 1.02 ± 0.54 | 1.57 ± 1.09 | 0.60 ± 0.38 | 0.65 | |
| 7-O-glucuronide | 3.04 ± 0.42 | 1.04 ± 0.19 | 1.21 ± 0.23 | 2.92 | |
| 3,5,7THF | |||||
| 3-O-glucuronide | 0.82 ± 0.14 | 0.31 ± 0.10 | 2.64 ± 0.89 | 2.65 | |
| 7-O-glucuronide | 4.59 ± 0.46 | 0.51 ± 0.08 | 1.22 ± 0.19 | 9.00 | |
| 3,7,4’THF | |||||
| 3-O-glucuronide | 0.68 ± 0.05 | 0.30 ± 0.05 | 5.41 ± 0.93 | 2.27 | |
| 7-O-glucuronide | 1.08 ± 0.13 | 0.43 ± 0.10 | 3.53 ± 0.86 | 2.52 | |
| 3,5,7,4’QHF | |||||
| 7-O-glucuronide | 1.38 ± 0.14 | 0.13 ± 0.03 | 2.81 ± 0.67 | 10.62 | |
| UGT1A3 | 3,7DHF | ||||
| 3-O-glucuronide | 0.18 ± 0.02 | 8.81 ± 2.72 | 100.05 ± 94.80 | 0.02 | |
| 7-O-glucuronide | 1.89 ± 0.36 | 7.02 ± 3.76 | 50.00 ± 80.17 | 0.27 | |
| 3,5,7THF | |||||
| 3-O-glucuronide | 0.17 ± 0.01 | 0.84 ± 0.18 | 17.86 ± 6.33 | 0.20 | |
| 7-O-glucuronide | 3.44 ± 0.84 | 2.12 ± 1.24 | 9.95 ± 9.16 | 1.62 | |
| 3,5,7,4’QHF | |||||
| 7-O-glucuronide | 0.86 ± 0.35 | 3.30 ± 3.10 | 7.52 ± 9.58 | 0.26 |
Data are means ± S.E. of three determinations.
Surprisingly, strong substrate inhibition pattern characterized by Ks values in the range of 0.60 ~ 5.41 µM was observed for both 3-O-glucuronidation and 7-O-glucuronidation (Tab.2). The Km values were in the range of 0.13~1.57 µM, which were much smaller than reported Km value (49.8 µM) for ethinylestradiol (28). UGT1A1 kinetics towards ethinylestradiol also presented substrate inhibition profile at high concentrations of UDPGA, which gave the Ks/Km ratio of 1.61. By contrast, Ks/Km ratio for 3,7DHF was much less than this number, at 0.38 and 1.16 for 3-O- and 7-O-glucuronidation, respectively.
Regioselective glucuronidation of flavonols by UGT1A3
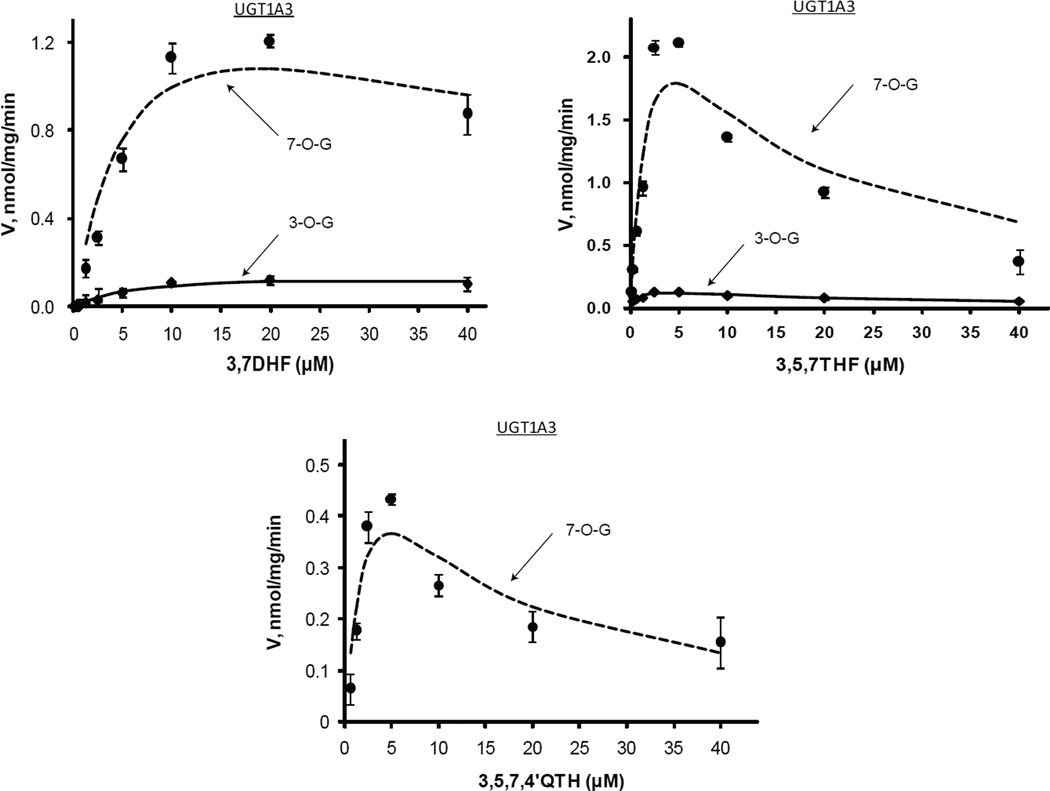
Similar to UGT1A1, UGT1A3 also produced much more flavonol 7-O-glucuronides than 3-O-glucuronides (Fig.4 & Tab.2). The formation ratios of 7-O-glucuronides/3-O-glucuronides ranged from 8.6~11.4 for 3,7DHF, whereas they spanned from 5.4 to 11.9 for 3,5,7THF (Fig.9). Likewise, UGT1A3 displayed substrate inhibition kinetics with the regiospecific metabolism (Fig.4 & Tab.2). The substrate inhibition constants (Ks) lied within 7.52~100.05 µM that are significantly larger than those of UGT1A1. Km values of the UGT1A3-flavonols interaction ranged from 0.84 to 8.81 µM. Comparing to UGT1A1, UGT1A3 seemed to have even higher preference for 7-OH metabolism, since the catalytic efficiency ratios (i.e., 7-OH over 3-OH) were up to 13.5 and 8.1 for 3,7DHF and 3,5,7THF, respectively. However, UGT1A3 was generally less efficient than UGT1A1 in glucuronidating flavonols, as evidenced by lower catalytic efficiencies for each flavonol (Tab.2). It is noted that, for 3,5,7,4’QHF, UGT1A1 and 1A3 only generated 7-O-glucuornide. These two isoenzymes were also shown to very efficiently metabolize flavones that contain 7-OH (data not shown).
Figure.4.
Kinetics profiles of UGT1A3 with three flavonols (3,7DHF, 3,5,7THF and 3,5,7,4’QHF). See Figure 3 legends for additional explanation.
Regioselective glucuronidation of flavonols by UGT1A7
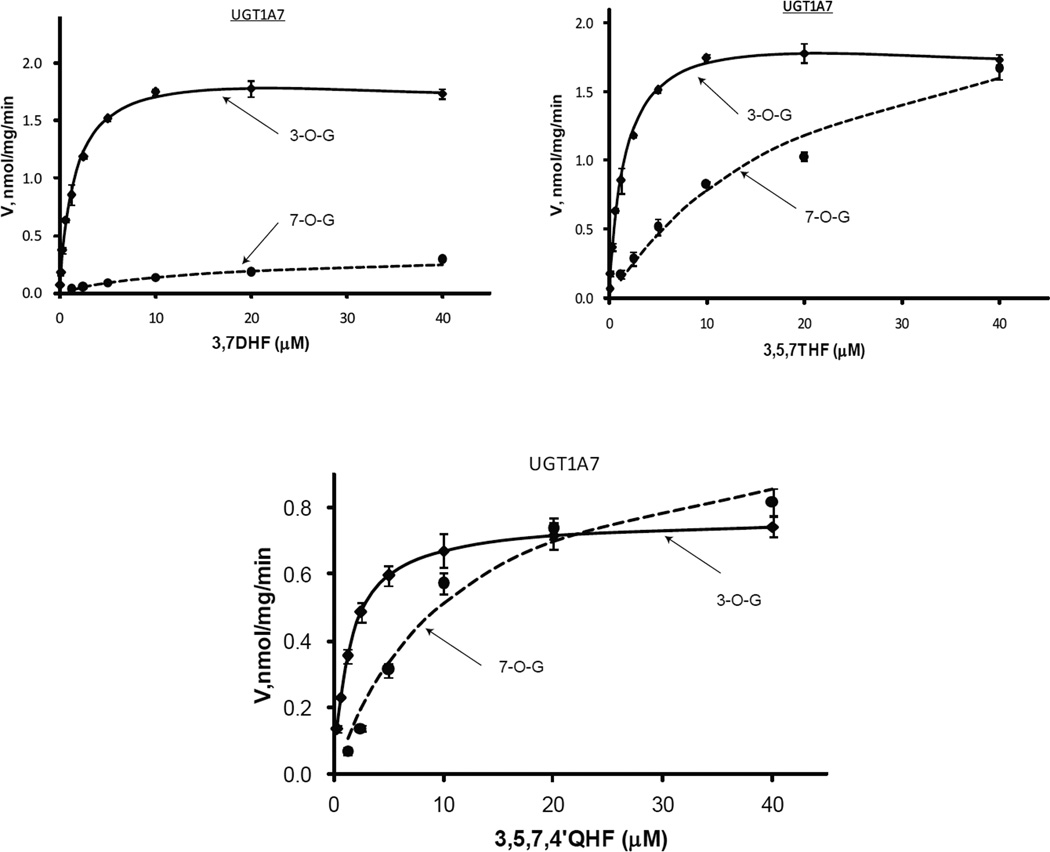
In contrast to UGT1A1 and 1A3, UGT1A7 more specifically catalyzed formation of flavonol 3-O-glucuronide (Fig.5 & Tab.3). The rate differences between 3-O- and 7-O-glucuronidation decreased dramatically with increasing concentration of flavonols (Fig.9). The formation ratios of 3-O-glucuronide over 7-O-glucuronide at 1.25 µM were 24.7, 11.0 and 5.6 for 3,7DHF, 3,5,7THF and 3,5,7,4’QHF respectively, whereas those corresponding values were 5.9, 1.1 and 1.0 at 40 µM. CLint differences between 3-O- and 7-O-glucuronidation hit 63.5-, 37.2-folds and 5.3-folds for 3,7DHF, 3,5,7THF and 3,5,74’QHF, respectively. Km values for 7-O-glcuronidation (11.56~23.17 µM) were much higher than that for 3-O-glucuronidation (0.82~1.61 µM), which suggested that UGT1A7 binding pocket might favor more the binding mode of flavonols for producing 3-O-glucuronides than that for generating 7-O-glucuronides.
Figure.5.
Kinetics profiles of UGT1A7 with three flavonols (3,7DHF, 3,5,7THF, and 3,5,7,4’QHF). See Figure 3 legends for additional explanation.
Table 3.
The enzyme kinetics parameters for UGT1A7~1A10 with appropriate flavonols
| Enzymes | Substrate /Product(s) |
Vmax | Km | Ks | Vmax/Km (CLint) |
|---|---|---|---|---|---|
| nmol/mg/min | µM | µM | ml/min/mg | ||
| UGT1A7 | 3,7DHF | ||||
| 3-O-glucuronide | 2.04 ± 0.07 | 1.61 ± 0.14 | 309.17 ± 127.39 | 1.27 | |
| 7-O-glucuronide | 0.44 ± 0.07 | 23.17 ± 6.96 | N/A | 0.02 | |
| 3,5,7THF | |||||
| 3-O-glucuronide | 3.35 ± 0.11 | 0.82 ± 0.08 | 55.75 ± 7.27 | 4.09 | |
| 7-O-glucuronide | 2.46 ± 0.34 | 21.43 ± 6.09 | N/A | 0.11 | |
| 3,5,7,4’QHF | |||||
| 3-O-glucuronide | 0.77 ± 0.04 | 1.46 ± 0.32 | N/A | 0.53 | |
| 7-O-glucuronide | 1.10 ± 0.11 | 11.56 ± 2.91 | N/A | 0.10 | |
| UGT1A8 | 3,7DHF | ||||
| 3-O-glucuronide | 0.76 ± 0.04 | 8.68 ± 1.21 | N/A | 0.09 | |
| 7-O-glucuronide | 0.65 ± 0.10 | 27.32 ± 7.50 | N/A | 0.02 | |
| 3,5,7THF | |||||
| 3-O-glucuronide | 3.89 ± 0.47 | 6.44 ± 1.28 | 37.28 ± 10.12 | 0.60 | |
| 7-O-glucuronide | 0.79 ± 0.57 | 4.88 ± 1.14 | N/A | 0.16 | |
| 3,5,7,4’QHF | |||||
| 3-O-glucuronide | 0.74 ± 0.04 | 2.39 ± 0.47 | N/A | 0.31 | |
| 7-O-glucuronide | 1.01 ± 0.09 | 6.77 ± 1.78 | N/A | 0.15 | |
| UGT1A9 | 3,7DHF | ||||
| 3-O-glucuronide | 4.60 ± 0.28 | 0.22 ± 0.04 | 30.13 ± 7.11 | 20.91 | |
| 7-O-glucuronide | 2.04 ± 0.09 | 1.50 ± 0.26 | N/A | 1.36 | |
| 3,5,7THF | |||||
| 3-O-glucuronide | 7.41 ± 0.89 | 0.68 ± 0.16 | 7.43 ± 2.12 | 10.90 | |
| 7-O-glucuronide | 2.56 ± 0.10 | 0.54 ± 0.08 | N/A | 4.74 | |
| 3,7,4’THF | |||||
| 3-O-glucuronide | 2.62 ± 0.05 | 0.36 ± 0.03 | N/A | 7.28 | |
| 7-O-glucuronide | 1.15 ± 0.08 | 2.67 ± 0.56 | N/A | 0.43 | |
| 3,5,7,4’QHF | |||||
| 3-O-glucuronide | 1.92 ± 0.03 | 0.32 ± 0.03 | N/A | 6.00 | |
| 7-O-glucuronide | 0.87 ± 0.05 | 3.87 ± 0.59 | N/A | 0.22 | |
| UGT1A10 | 3,7DHF | ||||
| 3-O-glucuronide | 0.19 ± 0.01 | 6.66 ± 0.66 | N/A | 0.03 | |
| 7-O-glucuronide | 0.26 ± 0.02 | 8.74 ± 1.37 | N/A | 0.03 | |
| 3,5,7THF | |||||
| 3-O-glucuronide | 2.01 ± 0.14 | 4.49 ± 0.61 | 73.48 ± 17.82 | 0.45 | |
| 7-O-glucuronide | 0.77 ± 0.04 | 3.96 ± 0.58 | N/A | 0.19 | |
| 3,5,7,4’QHF | |||||
| 3-O-glucuronide | 1.46 ± 0.16 | 2.44 ± 0.55 | 30.01 ± 8.00 | 0.60 | |
| 7-O-glucuronide | 1.10 ± 0.20 | 3.34 ± 1.21 | 51.37 ± 27.15 | 0.33 |
Data are means ± S.E. of three determinations. N/A means that parameter Ks was not available; this was for the cases in which data fitted better to Michaelis-Menten equation
Regioselective glucuronidation of flavonols by UGT1A8
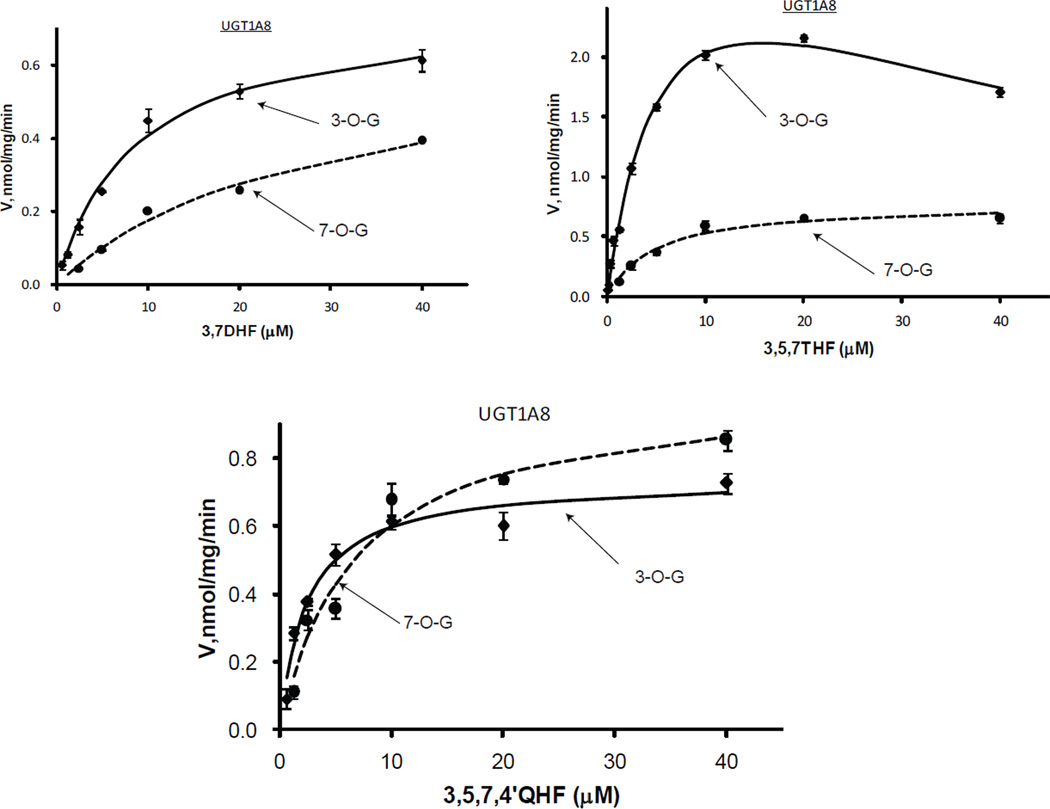
Comparison between formation of flavonol 3-O- and 7-O-glucuronides revealed that UGT1A8 recognized 3-OH better than 7-OH (Fig.6 & Tab.3). The degree of regioselectivity between 3-OH and 7-OH varied with the concentration of the parent compounds. The ranges of the glucuronidation ratios of 3-OH over 7-OH were 1.5~3.5, 2.6~4.4 and 0.81~2.59 for 3,7DHF, 3,5,7THF and 3,5,7,4’QHF, respectively. The differences in catalytic efficiency of 3-OH and 7-OH were >4-folds for 3,7DHF and 3,5,7THF, >2-folds for 3,5,7,4’QHF. 3-O-/7-O-glucuronidation were substantially enhanced (> 5.7 times) in the presence of 5-OH (3,7DHF vs 3,5,7THF), however, additional 4’-OH decreased the catalytic efficiency of 3-O-glucuronidation from 0.60 to 0.31 ml/min/mg (Tab.3). The catalytic capacities (Vmax) for 3,7DHF and 3,5,7,4’QHF were as low as 0.74~0.76 nmol/mg/min, whereas for the analog 3,5,7THF, the enzyme showed a much higher Vmax value of 3.89 nmol/mg/min (3-O-glucuornidation alone).
Figure.6.
Kinetics profiles of UGT1A8 with three flavonols (3,7DHF, 3,5,7THF, and 3,5,7,4’QHF). See Figure 3 legends for additional explanation.
Regioselective glucuronidation of flavonols by UGT1A9
UGT1A9 also preferentially glucuronidated 3-OH of flavonols (Fig.7 & Tab.3). The 3-OH preference was more obvious at lower concentrations (Fig.9). The formation ratio of 3-O- over 7-O-glucuronide was typically larger than 2 at concentrations of <2 µM. The catalytic efficiencies of UGT1A9 for 3-OH were more than 14.4-folds higher than that for 7-OH (except 3,5,7THF which showed a smaller difference of 2.3-folds). Km values of 7-O-glucuronidation were generally significantly larger than those of 3-O-glucuornidation (except 3,5,7THF that had similar Km values (0.54 vs 0.68 µM)). UGT1A9 showed the highest catalytic efficiency among the tested UGT1A isoforms, and the Clint values were no less than 6 ml/min/mg (3-O-glucuornidation alone). Interestingly, Vmax appeared negatively correlated with Km, Km values that were less than 1 µM coincided with Vmax of higher than 1.9 nmol/mg/min (except 7-O-glucruonidatin of 3,7DHF which showed Km value of 1.5 and Vmax of 2.04). Additionally, 3,7,4’THF was a good substrate for UGT1A9, a fair substrate for UGT1A1, but a non-substrate for 1A3, 1A7, 1A8 or 1A10.
Figure.7.
Kinetics profiles of UGT1A9 with four flavonols (3,7DHF, 3,5,7THF, 3,7,4THF and 3,5,7,4’QHF). See Figure 3 legends for additional explanation.
Regioselective glucuronidation of flavonols by UGT1A10
UGT1A10 was another 3-OH preferred enzyme (Fig.8 & Tab.3). This was seen from the positional glucuronidation of 3,5,7THF and 3,5,7,4’QHF (Fig.9). The ratio of 3-O- over 7-O-glucuronidation rate were ~2.3 and 1.1~1.9 for 3,5,7THF and 3,5,7,4’QHF, respectively. The CLint values for 3-O-/7-O-glucuronidation were 0.45/0.19 ml/min/mg for 3,5,7THF (2.4 times), 0.60/0.33 ml/min/mg for 3,5,7,4’QHF (1.8 times). In the absence of 5-OH, 3,7DHF was a very poor substrate of UGT1A10 having Vmax value of 0.19~0.26 nmol/mg/min and CLint value of 0.03 ml/min/mg, and 3,7,4’THF was a non-substrate of the enzyme. This indicated that 5-OH was essential for the interaction between UGT1A10 and flavonols, although this group itself was not glucuronidated. It also reflected the fact that the 4 selected flavonols bind much weaker to UGT1A10 than to UGT1A9. UGT1A10 exhibited similar Km values for 3-O-/7-O-glucuronidation, which ranges from 3.96 to 8.74 µM, and were significantly larger than the Km values of UGT1A9 (0.22~0.68 µM for 3-O-glucuronidation alone).
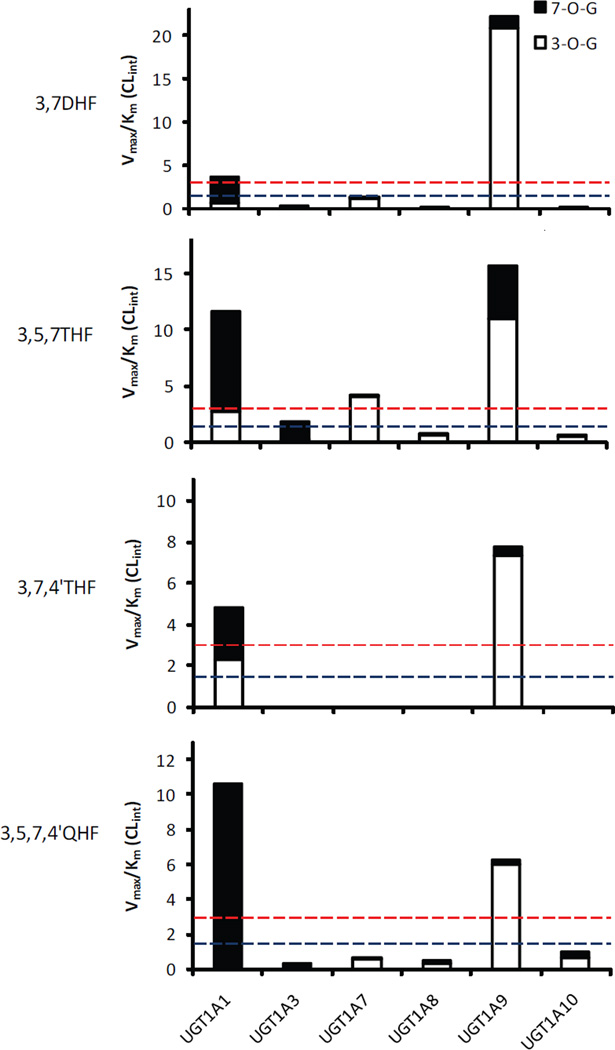
Based on protein sequence identity counting the substrate binding domain, UGT1A1 and 1A3, on average, are only approximately 50% identical to each other and to the polypeptides of UGT1A7~1A10 cluster. By contrast, the polypeptides within UGT1A7~1A10 cluster are 75–92% identical (8) (Supplementary Material Fig.S1). Interestingly, with less shared amino acids, UGT1A1 and 1A3 showed great similarity in regioselective glucuronidation of flavonols (7-OH preference), despite of the existing gaps in catalytic efficiency (CLint) (Fig.10). On the other hand, UGT1A7~1A10 cluster which share much higher sequence identities commonly preferred to metabolize 3-OH of flavonols. Nevertheless, these isoenzymes exhibited divergent catalytic efficiency towards the individual aglycones (Fig.10). UGT1A9 showed CLint of more than 6 ml/min/mg, whereas the rest of enzymes generally glucuronidated flavonols at CLint of <1.27 ml/min/mg with the exception of 3-O-glucuronidation of 3,5,7THF by UGT1A7 (~4.09 ml/min/mg).
Figure.10.
Comparison of intrinsic clearance (Vmax/Km) across UGT1A isoforms (UGT1A1,1A3 and 1A7~1A10) and four flavonols. Please also refer to Tab.2 & 3 for exact values. UGT1A1 and UGT1A9 were the most efficient conjugating enzymes with Vmax/Km of >3 ml/mg/min. Reference lines of 3 and 1.5 are shown.
Discussion
This paper for the first time elucidated regiospecific glucuronidation of 4 multi-hydroxyl flavonols by six human UGT1A isoforms via kinetics determination. The “hallmarks” (i.e., distinct regioselectivity and/or substrate selectivity) presented by UGT isoforms (Fig.10), uncovered distinctive patterns of substrate recognition between these UGT isoforms. The findings are novel and are in contrast to earlier finds which showed that substrate specificity of UGT1As towards a flavonoid are non-existent because UGTs often share extensive overlapping specificity (12,14,19). For example, 3-hydroxyflavone at 2.5 µM was metabolized rapidly by UGT1A1 (2.68 nmol/mg/min), 1A7 (8.27 nmol/mg/min), 1A8 (2.19 nmol/mg/min), 1A9 (3.03 nmol/mg/min) and 1A10 (1.37 nmol/mg/min). The results hold great promises on identifying those substrates (probe) that are exclusively metabolized by a particular UGT isoform to a regiospecific glucuronide, as the prevalence of generic variants of UGTs are become more common in the clinical settings and the need for a nontoxic probe substrate becomes ever more important. These results are highly significant for the understanding of regiospecificity of UGT isoform-mediated glucuronidation, which could be utilized to diagnose the functionality of a particular UGT isoform. On the other hand, information from current study would greatly assist in enzymatically synthesizing flavonoid glucuronides conjugated at desired position(s) for pharmaceutical purpose. Accumulating evidences from both in vitro and in vivo studies indicated flavonoids glucuronides retain biological activities and the activities are very dependent on the positions of substitution (29).
Our data clearly showed that kinetics profiling over a wide concentration range was very useful for determining substrate specificity and/or regioselectivity of UGTs. This approach is different from more frequently used method of measuring the enzyme activity at a single substrate concentration (21,22). Although the latter approach has the advantages of less cost and labor, this practice might generate erroneous conclusion, if the concentration was not properly chosen. By contrast, measurement and integration of glucuronidation rates with a spectrum of substrate concentrations provided a more complete picture of the substrate specificity and/or regioselectivity, which could avoid misinterpretation of the interaction between the substrates and an enzyme. For example, formation of 3-O-glucuronide was much faster than that of 7-O-glucuronide for 3,7DHF at concentrations of less than 20 µM for UGT1A9 (Fig.7). However, no significant regioselectivity between 3-OH and 7-OH was visible, if glucuronidation rates were just determined at a concentration of over 40 µM. The similar observations were made with UGT1A7 metabolism of 3,5,7THF, as well as glucuronidation of 3,5,7,4’QHF by UGT1A1, 1A8 and 1A10 (Fig.9).
The fact that positional (3-O- or 7-O-) glucuronidation always have different kinetics parameters lend strong support to the hypothesis that at least two distinct binding modes are required to generate the glucuronide isomers by the six (UGT1A1, 1A3 and 1A7~1A10), if not all UGT isoforms (23). The differentiated Km (binding affinity) or Vmax (reflecting turnover (Kcat)) values in production of the regiospecific glucuronides indicated that the enzymes provided two divergent interacting environments within which single flavonol oriented differently. This most likely resulted from one active site with bigger size, instead of two separate active sites, as supported by the use of UGT1A1 homology models (30,31).
The results showed strict regioselectivity for UGT-catalyzed (UGT1A1, 1A3, and 1A7~1A10) reactions, and the general order of sites to-be-glucuronidated was 3-OH or 7-OH > 4’-OH > 5-OH in the tested compounds. 5-OH and 4’-OH were the relatively inactive positions for glucuronidation. This assertion was corroborated by further studies with eight flavones with only 5 or 4’-OH available for conjugation (Supplementary materials Tab.S1). Glucuronidation of the eight flavones (i.e., 5,4'-dihydroxy-7-methoxyflavone (or 5,4’DH7MF), 5,4'-dihydroxyflavone (or 5,4’DHF), 4'-hydroxy-5-methoxyflavone (or 4’H5MF), 4'-hydroxy-6-methoxyflavone (or 4’H6MF) 4'-hydroxy-7-methoxyflavone (or 4’H7MF), 4'-hydroxyflavone (4’HF), 5-hydroxy-7-methoxyflavone (or 5H7MF) and 5-hydroxyflavone (or 5HF)) were all very slow (≤ 0.9 nmol/mg/min) across the UGT1A isoforms used. 4’-OH is the preferred position comparing to 5-OH, because only 4’-O-glucuronide was generated for 5,4’DH7MF and 5,4’DHF when 5-OH and 4’-OH are both present (Tab.S1). This rule of position preference may not be applicable to quercetin with 3’,4’ catechol unit, whose preferential site of glucuronidation was shifted to 3’-OH in the presence of UGT1A1 (21,22).
Hydroxylation at C4’ or C5 appeared to have opposite effects on glucuronidation, although both were not directly glucuronidated. Addition of 5-OH generally enhanced the UGT1A-mediated conjugation (excluding UGT1A9), as evidenced by the comparisons between 3,7DHF and 3,5,7THF, or between 3,7,4’THF and 3,5,7,4’QHF in catalytic efficiency (Fig.10). The enhancement was largely ascribed to more efficient formation of the regioselective conjugates (7-O-glucuornide for UGT1A1 and 1A3; 3-O-glucuornide for UGT1A7, 1A8 and 1A10). The effects of 5-OH on isoform-specific glucuronidation at 3-OH or 7-OH positions were also observed for flavonoids such as chrysin, wogonin, oroxylin A, and 3,5-dihydroxyflavone (15,19). On the contrary, addition of 4’-OH compromised UGT1A3-, 1A7~1A9-mediated glucuronidation by markedly reducing their corresponding regioselective glucuronidation (Fig.10). The fact that 3-O- or 7-O-glucuronidation was reduced in the presence of 4’-OH was also supported by the observation that 3-O-glucuronidation of 3,4’-dihydroxyflavone was slower than 3-hydroxyflavone at three very different concentrations (2.5, 10, and 35 µM) (19).
The generalized regioselectivity might be used to predict regioselective glucuronidation of structural related compounds. UGT1A3 is anticipated to primarily produce 7-O-glucuronide for hesperetin (4'-methoxy-3',5,7-trihydroxyflavanone), which agreed with the published observation where only 7-O-glucuronide was generated (12). UGT1A9 is reasonably predicted to metabolize 3-OH of quercetin (3,5,7,3’,4’-pentahydroxyflavone) at significantly level, which is consistent with the results of Chen et al., who found 3-O-glucuronidation was most efficient with the highest CLint value (32). The knowledge also helps to explain the discrepancies in glucuronidation determined in tissues or systems with different expression of UGTs, e.g., hepatic and intestinal fractions or Caco-2 cells. The significant amount of 3,5,7THF (galangin) 3-O-glucuornide generated by human liver microsomes, was elucidated to be mainly contributed from UGT1A9 (33), as the rest of 3-OH preferred enzymes (UGT1A7,1A8 and 1A10) was only expressed in extrahepatic tissues. In Caco-2 transport studies of both 3,5,7THF and 3,5,7,4’QHF (kaempferol), high level of 3-O- and 7-O-glucuornides were observed, with slight difference between them (34). UGT1A1 and UGT1A8 were predicted to be respectively responsible for producing the 7-O- and 3-O-glucuornides, given their outstanding expression profile in Caco-2 cells (35). However, Caco-2 cells also express UGT2Bs, whose roles in forming regiospecific glucuronide(s) are unclear, although previous studies showed that they made minor contribution toward metabolizing flavonoids (19).
All UGT1A isoforms in this paper displayed significant extents of substrate inhibition kinetics at higher flavonol concentrations. A variety of compounds such as diclofenac, probenecid, oroxylin A, acetaminophen, entacapone and 4-nitrophenol also exhibited substrate inhibition in their glucuronidation (15,28,36 ,37). Hutzler and Tracy tried to explain substrate inhibition using a hypothetical two-site binding model, in which one binding site is productive, whereas the other site is inhibitory and operable only at high substrate concentrations (38). The validity of this hypothesis remains unknown unless high resolution atomic structure of the enzyme is solved. On the other hand, one investigator group (28) proposed to use compulsory ordered bi bi (two substrates and two products) kinetic model to explain substrate inhibition of UGT1As. We used a similar approach and showed that UGT1A9 catalyzed glucuronidation of 3,7,4’-trihydroxyflavone (resokaempferol) followed the identical kinetic model (Supplementary materials Fig.S2). Therefore, one reasonable explanation of the substrate inhibition was that binding of the aglycone substrate to the enzyme-UDP complex led to a nonproductive dead-end complex that slows the completion of the catalytic cycle (39). Additional studies would be needed to clearly delineate the possible catalytic mechanisms of glucuronidation for all flavonols.
An important discovery of our research is that UGT1A1 was a very unique enzyme, unambiguously glucuronidating flavonols efficiently at their low concentrations (≤ 1.25 µM), but its activities were inhibited significantly (>2-folds) at concentrations equal to or greater than 2 µM, which can be achieved in humans in vivo (40). The phenomena may indicate the dual natures of the model flavonols interacting with UGT1A1: they were good substrates of UGT1A1 at low concentrations, but potent inhibitors at their higher concentrations. Interestingly, it was observed that 40 µM of 3,7,4’THF completely inhibited glucuronidation of 3-hydroflavone by UGT1A1 (data not shown). Although this is not directly related to the central theme of this research, it is an important one when we try to understand the physiological underpinnings that limit flavonoid bioavailability. Assuming some flavonols would severely inhibit UGT1A1-mediated metabolism of bilirubin (product of heme), approaches to increase bioavailability of flavonoids without considering this effect could be hazardous to humans. Further work in this area is desirable to build models that will be able to predict which flavonoids will not impact bilirubin metabolism, which may be useful for us to search for highly bioavailable flavonoids without toxicity.
In conclusion, kinetics characterization of UGT1A (UGT1A1, 1A3, 1A7~1A10) mediated glucuronidation of flavonols demonstrated UGT1A1 and UGT1A9 were the most efficient conjugating enzymes with smallest Km values (≤1µM) and highest intrinsic clearance (Vmax/Km of > 3 ml/min/mg). Regardless of their distinct substrate specificity towards the flavonols, UGT1A1 and 1A3 favored 7-O-glucuornidation of flavonols, whereas UGT1A7~1A10 preferred 3-O- glucuronidation. The differentiated kinetics properties between 3-O- and 7-O- glucuronidation also indicated that the at least two distinct binding modes within the catalytic domain were responsible for the formation of these two glucuronide isomers. Studies are ongoing to explore these binding modes using homology- based UGT modeling to derive additional structure-metabolism activity relationship.
Supplementary Material
Acknowledgement
This work was supported by grants from the National Institutes of Health (GM070737) to MH.
Abbreviations used
- UGTs
UDP-glucuronosyltransferases
- UDPGA
uridine diphosphoglucuronic acid
- UPLC
ultra performance liquid chromatography
- MS
mass spectroscopy
- SN2
bimolecular nucleophilic substitution
- QSAR
quantitative structure activity relationship
- DHF
dihydroxyflavone
- THF
trihydroxyflavone
- QHF
tetrahydroxyflavone
- NMR
Nuclear magnetic resonance
References
- 1.Birt DF, Hendrich S, Wang W. Dietary agents in cancer prevention: flavonoids and isoflavonoids. Pharmacol Ther. 2001;90(2–3):157–177. doi: 10.1016/s0163-7258(01)00137-1. [DOI] [PubMed] [Google Scholar]
- 2.Ross JA, Kasum CM. Dietary flavonoids: bioavailability, metabolic effects, and safety. Annu Rev Nutr. 2002;22:19–34. doi: 10.1146/annurev.nutr.22.111401.144957. [DOI] [PubMed] [Google Scholar]
- 3.Chen J, Lin H, Hu M. Metabolism of flavonoids via enteric recycling: role of intestinal disposition. J Pharmacol Exp Ther. 2003;304(3):1228–1235. doi: 10.1124/jpet.102.046409. [DOI] [PubMed] [Google Scholar]
- 4.Setchell KD, Brown NM, Desai P, Zimmer-Nechemias L, Wolfe BE, Brashear WT, Kirschner AS, Cassidy A, Heubi JE. Bioavailability of pure isoflavones in healthy humans and analysis of commercial soy isoflavone supplements. J Nutr. 2001;131(4 Suppl):1362S–1375S. doi: 10.1093/jn/131.4.1362S. [DOI] [PubMed] [Google Scholar]
- 5.Busby MG, Jeffcoat AR, Bloedon LT, Koch MA, Black T, Dix KJ, Heizer WD, Thomas BF, Hill JM, Crowell JA, Zeisel SH. Clinical characteristics and pharmacokinetics of purified soy isoflavones: single-dose administration to healthy men. Am J Clin Nutr. 2002;75(1):126–136. doi: 10.1093/ajcn/75.1.126. [DOI] [PubMed] [Google Scholar]
- 6.Tukey RH, Strassburg CP. Human UDP-glucuronosyltransferases: metabolism, expression, and disease. Annu Rev Pharmacol Toxicol. 2000;40:581–616. doi: 10.1146/annurev.pharmtox.40.1.581. [DOI] [PubMed] [Google Scholar]
- 7.Radominska-Pandya A, Ouzzine M, Fournel-Gigleux S, Magdalou J. Structure of UDP-glucuronosyltransferases in membranes. Methods Enzymol. 2005;400:116–147. doi: 10.1016/S0076-6879(05)00008-X. [DOI] [PubMed] [Google Scholar]
- 8.Mackenzie PI, Bock KW, Burchell B, Guillemette C, Ikushiro S, Iyanagi T, Miners JO, Owens IS, Nebert DW. Nomenclature update for the mammalian UDP glycosyltransferase (UGT) gene superfamily. Pharmacogenetics Genomics. 2005;15:677–685. doi: 10.1097/01.fpc.0000173483.13689.56. [DOI] [PubMed] [Google Scholar]
- 9.Fisher MB, Paine MF, Strelevitz TJ, Wrighton SA. The role of hepatic and extrahepatic UDP-glucuronosyltransferases in human drug metabolism. Drug Metab Rev. 2001;33(3–4):273–297. doi: 10.1081/dmr-120000653. [DOI] [PubMed] [Google Scholar]
- 10.Ohno S, Nakajin S. Determination of mRNA expression of human UDP-glucuronosyltransferases and application for localization in various human tissues by real-time reverse transcriptase-polymerase chain reaction. Drug Metab Dispos. 2009;37(1):32–40. doi: 10.1124/dmd.108.023598. [DOI] [PubMed] [Google Scholar]
- 11.Wong CC, Meinl W, Glatt HR, Barron D, Stalmach A, Steiling H, Crozier A, Williamson G. In vitro and in vivo conjugation of dietary hydroxycinnamic acids by UDP-glucuronosyltransferases and sulfotransferases in humans. J Nutr Biochem. 2009 doi: 10.1016/j.jnutbio.2009.09.001. [DOI] [PubMed] [Google Scholar]
- 12.Brand W, Boersma MG, Bik H, Hoek-van den Hil EF, Vervoort J, Barron D, Meinl W, Glatt H, Williamson G, van Bladeren PJ, Rietjens IM. Phase II metabolism of hesperetin by individual UDP-glucuronosyltransferases and sulfotransferases and rat and human tissue samples. Drug Metab Dispos. 2010;38(4):617–625. doi: 10.1124/dmd.109.031047. [DOI] [PubMed] [Google Scholar]
- 13.Aprile S, Del Grosso E, Grosa G. Identification of the human UDP-glucuronosyltransferases involved in the glucuronidation of combretastatin A-4. Drug Metab Dispos. 2010;38(7):1141–1146. doi: 10.1124/dmd.109.031435. [DOI] [PubMed] [Google Scholar]
- 14.Tang L, Ye L, Singh R, Wu B, Zhao J, Lv C, Liu Z, Hu M. Use of Glucuronidation Fingerprinting to Describe and Predict mono- and di- Hydroxyflavone Metabolism by Recombinant UGT Isoforms and Human Intestinal and Liver Microsomes. Mol Pharm. 2010;7(3):664–679. doi: 10.1021/mp900223c. [DOI] [PMC free article] [PubMed] [Google Scholar]
- 15.Zhou Q, Zheng Z, Xia B, Tang L, Lv C, Liu W, Liu Z, Hu M. Use of Isoform-Specific UGT Metabolism to Determine and Describe Rates and Profiles of Glucuronidation of Wogonin and Oroxylin A by Human Liver and Intestinal Microsomes. Pharm Res. 2010;27(8):1568–1583. doi: 10.1007/s11095-010-0148-0. [DOI] [PMC free article] [PubMed] [Google Scholar]
- 16.Sorich MJ, Smith PA, Miners JO, Mackenzie PI, McKinnon R. Recent advances in the in silico modelling of UDP glucuronosyltransferase substrates. Curr Drug Metab. 2008;9(1):60–69. doi: 10.2174/138920008783331167. [DOI] [PubMed] [Google Scholar]
- 17.Sorich MJ, Smith PA, McKinnon RA, Miners JO. Pharmacophore and quantitative structure activity relationship modelling of UDP-glucuronosyltransferase 1A1 (UGT1A1) substrates. Pharmacogenetics. 2002;12(8):635–645. doi: 10.1097/00008571-200211000-00008. [DOI] [PubMed] [Google Scholar]
- 18.Smith PA, Sorich MJ, McKinnon RA, Miners JO. In silico insights: chemical and structural characteristics associated with uridine diphosphate glucuronosyltransferase substrate selectivity. Clin Exp Pharmacol Physiol. 2003;30(11):836–840. doi: 10.1046/j.1440-1681.2003.03923.x. [DOI] [PubMed] [Google Scholar]
- 19.Tang L, Ye L, Singh R, Wu B, Zhao J, Lv C, Liu Z, Hu M. Use of Glucuronidation Fingerprinting to Describe and Predict mono- and di- Hydroxyflavone Metabolism by Recombinant UGT Isoforms and Human Intestinal and Liver Microsomes. Mol Pharm. 2010;7(3):664–679. doi: 10.1021/mp900223c. [DOI] [PMC free article] [PubMed] [Google Scholar]
- 20.Chohan KK, Paine SW, Waters NJ. Quantitative structure activity relationships in drug metabolism. Curr Top Med Chem. 2006;6(15):1569–1578. doi: 10.2174/156802606778108960. [DOI] [PubMed] [Google Scholar]
- 21.Boersma MG, van der Woude H, Bogaards J, Boeren S, Vervoort J, Cnubben NH, van Iersel ML, van Bladeren PJ, Rietjens IM. Regioselectivity of phase II metabolism of luteolin and quercetin by UDP-glucuronosyl transferases. Chem Res Toxicol. 2002;15(5):662–670. doi: 10.1021/tx0101705. [DOI] [PubMed] [Google Scholar]
- 22.Davis BD, Brodbelt JS. Regioselectivity of human UDP-glucuronosyl-transferase 1A1 in the synthesis of flavonoid glucuronides determined by metal complexation and tandem mass spectrometry. J Am Soc Mass Spectrom. 2008;19(2):246–256. doi: 10.1016/j.jasms.2007.11.004. [DOI] [PMC free article] [PubMed] [Google Scholar]
- 23.Miners JO, Smith PA, Sorich MJ, McKinnon RA, Mackenzie PI. Predicting human drug glucuronidation parameters: application of in vitro and in silico modeling approaches. Annu Rev Pharmacol Toxicol. 2004;44:1–25. doi: 10.1146/annurev.pharmtox.44.101802.121546. [DOI] [PubMed] [Google Scholar]
- 24.Wong YC, Zhang L, Lin G, Zuo Z. Structure-activity relationships of the glucuronidation of flavonoids by human glucuronosyltransferases. Expert Opin Drug Metab Toxicol. 2009;5(11):1399–1419. doi: 10.1517/17425250903179300. [DOI] [PubMed] [Google Scholar]
- 25.Singh R, Wu BJ, Tang L, Liu ZQ, Hu M. Identification of the Position of Mono-O-Glucuronide of Flavones and Flavonols by Analyzing Shift in Online UV Spectrum (λmax) Generated from an Online Diode-arrayed Detector. J Agric Food Chem. 2010 doi: 10.1021/jf904561e. [DOI] [PMC free article] [PubMed] [Google Scholar]
- 26.Christopoulos A, Lew MJ. Beyond eyeballing: fitting models to experimental data. Crit Rev Biochem Mol Biol. 2000;35(5):359–391. doi: 10.1080/10409230091169212. [DOI] [PubMed] [Google Scholar]
- 27.Harborne JB. The Flavonoids: advances in research since 1986. London: Chapman and Hall; 1994. [Google Scholar]
- 28.Luukkanen L, Taskinen J, Kurkela M, Kostiainen R, Hirvonen J, Finel M. Kinetic characterization of the 1A subfamily of recombinant human UDP-glucuronosyltransferases. Drug Metab Dispos. 2005;33(7):1017–1026. doi: 10.1124/dmd.105.004093. [DOI] [PubMed] [Google Scholar]
- 29.Williamson G, Barron D, Shimoi K, Terao J. In vitro biological properties of flavonoid conjugates found in vivo. Free Radic Res. 2005;39(5):457–469. doi: 10.1080/10715760500053610. [DOI] [PubMed] [Google Scholar]
- 30.Li C, Wu Q. Adaptive evolution of multiple-variable exons and structural diversity of drugmetabolizing enzymes. BMC Evol Biol. 2007;7:69. doi: 10.1186/1471-2148-7-69. [DOI] [PMC free article] [PubMed] [Google Scholar]
- 31.Laakkonen L, Finel M. A molecular model of the human UGT1A1, its membrane orientation and the interactions between different parts of the enzyme. Mol Pharmacol. 2010;77(6):931–939. doi: 10.1124/mol.109.063289. [DOI] [PubMed] [Google Scholar]
- 32.Chen YK, Chen SQ, Li X, Zeng S. Quantitative regioselectivity of glucuronidation of quercetin by recombinant UDP-glucuronosyltransferases 1A9 and 1A3 using enzymatic kinetic parameters. Xenobiotica. 2005;35(10–11):943–954. doi: 10.1080/00498250500372172. [DOI] [PubMed] [Google Scholar]
- 33.Otake Y, Hsieh F, Walle T. Glucuronidation versus oxidation of the flavonoid galangin by human liver microsomes and hepatocytes. Drug Metab Dispos. 2002;30(5):576–581. doi: 10.1124/dmd.30.5.576. See Figure 3 legends for additional explanation. [DOI] [PubMed] [Google Scholar]
- 34.Barrington R, Williamson G, Bennett RN, Davis BD, Brodbelt JS, Kroon PA. Absorption, Conjugation and Efflux of the Flavonoids, Kaempferol and Galangin, Using the Intestinal CACO-2/TC7 Cell Model. J Funct Foods. 2009;1(1):74–87. doi: 10.1016/j.jff.2008.09.011. [DOI] [PMC free article] [PubMed] [Google Scholar]
- 35.Siissalo S, Zhang H, Stilgenbauer E, Kaukonen AM, Hirvonen J, Finel M. The expression of most UDP-glucuronosyltransferases (UGTs) is increased significantly during Caco-2 cell differentiation, whereas UGT1A6 is highly expressed also in undifferentiated cells. Drug Metab Dispos. 2008;36(11):2331–2336. doi: 10.1124/dmd.108.022335. [DOI] [PubMed] [Google Scholar]
- 36.Uchaipichat V, Mackenzie PI, Guo XH, Gardner-Stephen D, Galetin A, Houston JB, Miners JO. Human udp-glucuronosyltransferases: isoform selectivity and kinetics of 4-methylumbelliferone and 1-naphthol glucuronidation, effects of organic solvents, and inhibition by diclofenac and probenecid. Drug Metab Dispos. 2004;32(4):413–423. doi: 10.1124/dmd.32.4.413. [DOI] [PubMed] [Google Scholar]
- 37.Mutlib AE, Goosen TC, Bauman JN, Williams JA, Kulkarni S, Kostrubsky S. Kinetics of acetaminophen glucuronidation by UDP-glucuronosyltransferases 1A1, 1A6, 1A9 and 2B15. Potential implications in acetaminophen-induced hepatotoxicity. Chem Res Toxicol. 2006;19(5):701–709. doi: 10.1021/tx050317i. [DOI] [PubMed] [Google Scholar]
- 38.Hutzler JM, Tracy TS. Atypical kinetic profiles in drug metabolism reactions. Drug Metab Dispos. 2002;30(4):355–362. doi: 10.1124/dmd.30.4.355. [DOI] [PubMed] [Google Scholar]
- 39.Segel IH. Enzyme kinetics: behavior and analysis of rapid equilibrium and steady state enzyme systems. New ed. New York: Wiley; 1993. [Google Scholar]
- 40.Hollman PC, Katan MB. Bioavailability and health effects of dietary flavonols in man. Arch Toxicol Suppl. 1998;20:237–248. doi: 10.1007/978-3-642-46856-8_21. [DOI] [PubMed] [Google Scholar]
Associated Data
This section collects any data citations, data availability statements, or supplementary materials included in this article.


