Summary
Objectives
This study characterizes the variations in malaria morbidity for Accra.
Methods
Both routine reporting of presumptive, clinically diagnosed malaria in out-patient clinics and results from a longitudinal household survey are used in the analysis. In the household survey, cases of suspected malaria were self-reported by patients, based on diagnoses from health centers, hospitals, pharmacies, chemical sellers or traditional healers.
Results
Although the malaria ascertainment is not based on parasitology, we see systematic and plausible patterns by season and by district associated with variations in rainfall by month and year. There are significant differences in malaria incidence by socioeconomic group, possibly linked with place, work or residence.
Conclusions
Understanding these seasonal and geographic patterns have implications for both prevention and treatment of malaria-like morbidity in both children and adults in urban settings.
Keywords: Malaria, malaria morbidity, seasonal incidence of malaria, malaria and urban agriculture
Introduction
There are a limited number of studies on malaria in Accra, although mosquito breeding and resting tendencies and parasitaemia rates have been investigated since 1911.1 Previous studies include those conducted by Colbourne, Wright and Edington in the 1950s,2,3 Chinery's studies in the 1960s and 70s, and Gardiner, et al in 1984.4 In the last decade, Klinkenberg has led two studies: one a cross sectional analysis of malaria in children,5 and the other an investigation into the effect of irrigation on malaria.6
As the population in Accra increased over the last century, the parasitaemia rate steadily decreased. Chinery sites rates of 50.26 per cent (±16.02 SE) between 1912 and 1931, 40.3 per cent (±4.5 SE) between 1953 and 1954, and 21 per cent in 1964.1
In 1984, Gardiner, et al found a parasitaemia rate of 1.4 per cent in the Ablekuma district of Accra.4 It should be noted that this prevalence rate was only calculated in one area, and is therefore not representative of an average for the entire city. Most recently, in 2006, Klinkenberg, et al found parasitaemia prevalence rates in young children that ranged from 6 to 22 per cent in various districts of Accra.5
It is widely accepted that there are three main differences between urban and rural malaria: 1) transmission rates are lower in urban areas than they are in rural regions, and transmission rates change inversely with the degree of urbanicity; 2) There are focal points of malaria within cities and the characteristics of malaria transmission at different focal points across the city may not be consistent; 3) The epidemiology of urban malaria often differs from that of rural malaria; parasitaemia rates are usually lower, and first infections and consequently immunity are often acquired at later ages in urban canters as compared to rural regions.3,7,8,9 These differences are determined by a number of factors including: degree of urbanicity, land use, municipal activities, and individual livelihood activities, etc. Additionally, various studies have shown that, similar to rural malaria, temporal variations in malaria transmission also exist within urban areas, determined mainly by climate.10,11 Malaria transmission is often quite low in urban centers, largely attributed to unsuitable breeding sites, and then increases as one travels outward towards less densely settled areas that are often located on the periphery of urban centers.12
Urban agriculture in Ghana has been shown to influence malaria transmission in both Accra and Kumasi.6,14,15 Agriculture in urban areas is often promoted as a means of improving nutrition, increasing food security and alleviating poverty.15 If such sites are well irrigated, they can also serve as a breeding ground for malaria vectors. Both Klinkenberg, et al6 and Stoler, et al.15 found 1km to be the threshold distance within which urban agriculture had a significant effect on parasitaemia levels and self reported malaria episodes. Afrane's study in Kumasi found significantly more days of work lost due to malaria, and a greater number of malarial episodes reported, in urban and peri-urban agricultural locations as compared to non-agricultural locations. 14
Temporal trends in malaria have been identified by both Colbourne2 and Chinery.1 Colbourne investigated autopsy data to analyze deaths from malaria and determined that heavy rainfall is followed by a rise in malaria deaths two months later.2 Additionally, in drier years there are fewer registered deaths from malaria than in years with greater precipitation. Chinery found that the proportion of breeding sites and mosquito density in Accra were weakly correlated with the previous month's rainfall.1 He also found a general correlation between monthly rainfall and human parasite rates.
Due to the limited number of studies on malaria in Accra, there are considerable gaps in our understanding of the seasonal and socio-economic patterns of malaria morbidity within the metropolitan area. Most studies have been cross-sectional, and the only longitudinal study on urban malaria in Ghana was conducted in Kumasi,16 which has been shown to have lower malaria prevalence than that of Accra.5 Presumptive malaria diagnoses in Accra may be complicated by the presence of other mosquito transmitted febrile diseases that could be mistaken for malaria, especially in outpatient clinics without laboratory confirmation. Given the limited prior research in this area, an initial analysis of the prevalence of presumptive malaria in outpatient clinics, combined with self-reported malaria prevalence from a community survey may lend important insights into the epidemiology and temporality of malaria in Accra, and provide directions for future research.
Data Sources
First, prospective morbidity data for this study was collected from all individuals accessing health facilities in Accra. The study is not representative of residents of Accra who do not access or utilize public health facilities. The National Malaria Control Program's (NMCP) 2007 evaluation estimates that 54 per cent of the population country-wide seeks treatment for malaria, while 62 per cent of caretakers seek treatment for children with suspected malaria. The proportion may be higher in Accra where there is greater access to health facilities.17 Individuals may also seek care from private clinics, chemical sellers and pharmacies, rather than health facilities.
Monthly morbidity data were collected on out-patient visits at each health facility by age group and sex for 61 different diseases with diagnoses by the attending medical practitioner.
Out-patient visits listed as malaria were presumed malaria, as few diagnoses were made using blood smears or rapid diagnostic tests. The 2009 Ministry of Health guidelines for case management of malaria specify a case definition for suspected malaria of history of fever, or fever on exam, with no other cause. It is presumed this case definition was in place from 2001–2006 when these data were collected. Small specialized clinics and clinics with incomplete data were eliminated from the analysis. This eliminated 7 clinics and left data from a total of 20 reporting health facilities, except for 2006 which included 19 due to missing data.
Precipitation data for Accra from 2001–2006 were obtained from the Ghana Meteorological Agency.18 Precipitation calculations were an average of measurements taken at 7 sites across the city.
Community data were obtained from the Time Use and Health Study (TUHS), a subset of the second wave of the Women's Health Study of Accra, Ghana. The TUHS involved a total of 5,484 individuals in 1,254 randomly selected households across the six sub-metro areas (administrative units) of the Accra Metropolitan Area (AMA). The Women's Health Study targets 200 out of the 1741 enumeration areas (EA) in Accra; within each of the 200 selected EAs, an average of 16 women were randomly selected; to get a more balanced age distribution, older women were over-sampled. The Accra sub-metros have since been further divided into 11 areas by legislative instrument. Each of the six sub-metros is treated more or less as an administrative district because of the size of its population and complexity of the sub-metro health system. Each of the sub-metros is served by a government polyclinic, as well as several small government clinics, quasi-governmental hospitals and numerous private clinics and hospitals. Since previous research has highlighted pronounced district and seasonal health disparities within the city of Accra, this study extended over a period of 15 months; in each month of the year, a randomly selected group of households within each of the six sub-metros of Accra were monitored.
Each TUHS interviewer followed a group of 15–25 households (depending on the size of the Sub-metro area) over a period of 13 weeks. Respondents were asked to report on their own health and the health of household members within the past week. If anyone in the household was reported ill, a detailed health module was administered to capture the relevant health information. Suspected malaria is defined here as cases of malaria as self-reported by patients, based on diagnoses patients received from health centers, hospitals, pharmacies, chemical sellers or traditional healers. Data reported on other health conditions in the household in the past week were obtained in the same fashion.
Data Analysis
Data cleaning and all graphs were done in Excel 2003. Statistical analysis was done in SPSS 16.0 and SAS V9.1. Joinpoint 3.2.0, obtained from the National Cancer Institute, was used to test for changes in morbidity and mortality trends over time.19 Proportions of health facility cases due to presumed malaria were calculated as: number of presumed malaria related out-patient visits/total number of out-patient visits (excluding follow-up visits). The PDLREG procedure in SAS was used to test for lagged correlations between rainfall and presumed malaria morbidity. Significant changes in presumed malaria morbidity over time were analyzed using linear regression. The Chi-square test for trend was used to compare the proportions of presumed malaria morbidity across age groups.
For the TUHS data, an incidence panel was created where each observation reflects a person-day observation. The average daily probability of self-reported malaria was computed and then annualized to reflect the expected number of self-reported malaria episodes per person per year. Variations in the annual risk of self-reported malaria were then analyzed by season, sub-metro, and demographic characteristics of respondents.
Results
Health Facility Data
Yearly Trends
Annual trends at the health-facility level are shown in Table 1. According to the health facility data, fevers presumptively diagnosed as malaria were responsible for almost 50 per cent of health facility visits among children under 5, and 37 per cent of health facility visits among the population aged 5 and older. This was consistent with the rest of the country: the Centre for Health Information Management reported that between 37 and 45 per cent of out-patient visits were due to presumptive malaria country-wide between 1985 and 2003.20
Table 1.
Health facility (HF) visits for all causes and clinical malaria from 2001–2006 in Accra, Ghana
| Year | Clinical malaria in Children <5 |
Total HF Visits in Children <5 |
Per cent of HF visits due to clinical malaria in children <5 |
Clinical malaria in people >5 |
Total HF visits in people >5 |
Per cent of HF visits due to clinical malaria in people >5 |
Clinical malaria in all ages |
Total HF visits in all ages |
Per cent of HF visits due to clinical malaria in all ages |
Clinical malaria in Pregnant Women |
| 2001 | 63,841 | 135,035 | 47% | 191,219 | 485,834 | 39% | 255,060 | 620,869 | 41% | N/A |
| 2002 | 68,879 | 141,754 | 49% | 205,757 | 546,905 | 38% | 274,636 | 688,659 | 40% | 4,746 |
| 2003 | 63,006 | 135,240 | 47% | 201,953 | 568,149 | 36% | 264,959 | 703,389 | 38% | 3,953 |
| 2004 | 70,379 | 155,453 | 45% | 201,250 | 577,987 | 35% | 271,629 | 733,440 | 37% | 5,523 |
| 2005 | 85,165 | 181,446 | 47% | 251,135 | 695,032 | 36% | 336,300 | 876,478 | 38% | 10,866 |
| 2006 | 64,352 | 137,339 | 47% | 203,421 | 548,295 | 37% | 267,773 | 685,634 | 39% | 6,243 |
| TOTAL | 415,622 | 886,267 | 47% | 1,254,735 | 3,422,202 | 37% | 1,670,357 | 4,308,469 | 39% | 31,331 |
| Average | 69,270 | 147,711 | 209,123 | 570.367 | 278,393 | 718,078 | 6,266 | |||
| SE | 3,401 | 7,432 | 11,900 | 35,080 | 1,212 |
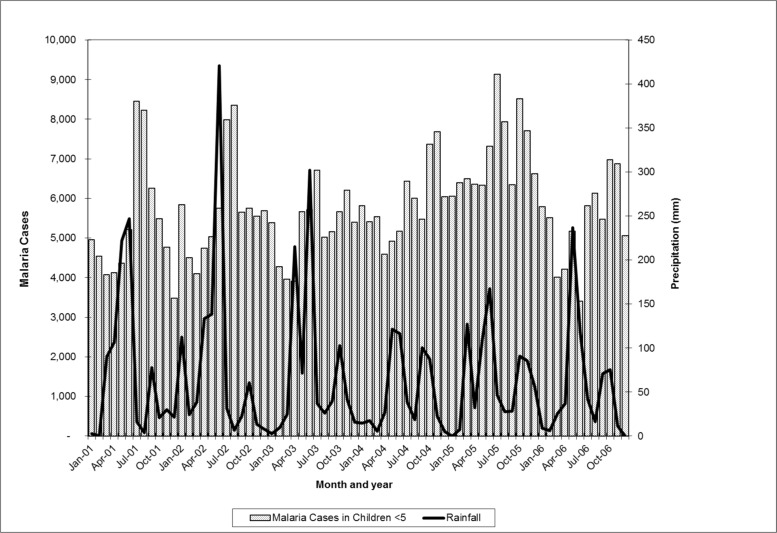
Health facility visits for malaria were significantly higher in 2005 as compared to the average over the period 2001–2006. This finding was consistent in both children under 5 and all age groups, as well as pregnant women, where the number of visits almost doubled between 2004 and 2005. The proportion of health facility visits due to presumptive malaria, however, remained relatively constant for all 6 years. This suggests that the peak in presumptive malaria morbidity is reflective of an overall increase in health facility visits in 2005. Rainfall during this period was not unusually high, and in fact the total rainfall for 2005 (778mm) was very close to the average for the 2001–2006 period of 789mm. Regression analysis of lagged rainfall and presumptive malaria morbidity showed that in both children under 5 and all ages, the amount of rainfall one and two months prior to the health clinic visit was a significant predictor of presumptive malaria morbidity (p<0.05) (Figure 2).
Figure 2.
Presumptive malaria morbidity (children <5) and rainfall (not lagged), Accra, Ghana 2001–2006
Presumptive malaria morbidity peaks every summer in July and August, following rainfall patterns. Peak rainfall generally occurs in June. Thus, morbidity from malaria peaks one and two months after rainfall. This is consistent with findings cited by Colbourne2 and patterns described by the Center for Health Information Management.14
The joinpoint analysis further highlights the influence of rainfall in certain years. In 1999, 2001 and 2002 there were significant changes in malaria morbidity trends, while in other years there were not. In 2001, the slope of malaria morbidity dipped in April and peaked in July. While in 2002, the slope dipped in March and peaked again in July. The years when significant trend changes occurred (1999, 2001, 2002) are the same years that have large variations in rainfall.
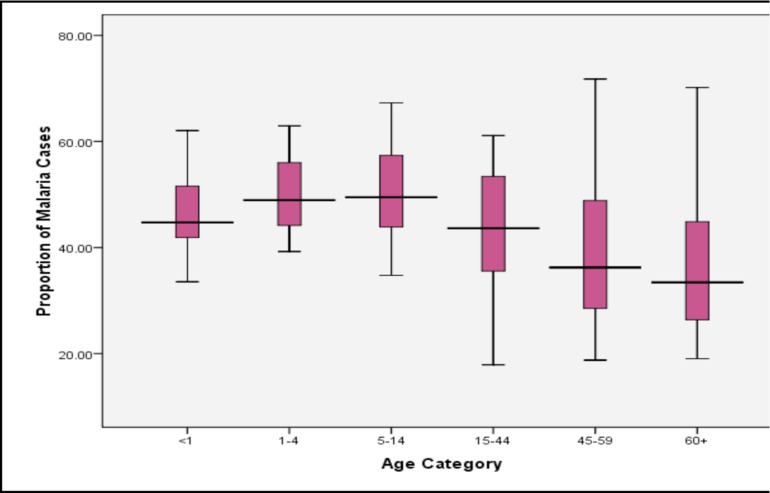
From 2001 to 2006, the proportion of health facility visits presumptively diagnosed as malaria was relatively unchanging between age groups <1 (46%), 1–4 (47%) and 5–14 (46%). In older age groups, the proportion of health facility visits presumptively diagnosed as malaria decreases with increasing age from 37% among 15–44 year olds, to 31% among 45–59 year olds, and 29% in the 60+ age category. The Chi square test for trend in proportions across all age groups is significant (p<0.0001), indicating that the proportion of malaria cases seen at health facilities between 2001 and 2006 decreased with increasing age groups. A dis-aggregated analysis of clinic visits by age reveals variation in the proportion of out-patient visits diagnosed as malaria among health facilities by age category (Figure 3). Further analysis of the health facilities that fall in the upper and lower quartiles of Figure 3 shows that TUC clinic consistently had a higher proportion of malaria cases while Korle Gonno, Ridge and Police Hospitals consistently had a lower proportion of outpatient visits due to malaria.
Figure 3.
Median, upper and lower quartile proportions of out-patient visits due to presumptive malaria amongst 20 health facilities in Accra, Ghana.
The Time-use and Health Survey data
Population characteristics
To complement the data available from out-patient attendances, we analyzed data from a community survey, the Time-Use and Health Study (TUHS), judged representative of the households with adult females in Accra.
The mean age of the study population was 29.4 years, ranging from 0 to 98 years. The sample contained a disproportionate number of females (62.5%), compared to men (37.6%) as the source of the households sampled was the frame for the Women's Health Survey of Accra. Of the 5,484 individuals in the sample, 1,193 illness episodes were reported. Some individuals reported multiple illness episodes during the course of this study, while others reported no illness episodes. The annual risk of illness was highest for individuals 60 years and over (Mean=1.21; CI95: 1.04, 1.38) and individuals under-five (Mean=1.04; CI95: 0.85, 1.23), while lowest for individuals 5–9 years (Mean=0.60; CI95: 0.48, 0.73) and 10–19 years (Mean=0.53; CI95: 0.45, 0.61).
Adult females 18–59 years exhibited a greater annual risk of illness than men (Mean=1.7; CI95: 0.98, 1.15) compared to the annual risk for the total male population in this study (Mean=0.50; CI95: 0.44, 0.55). The annual risk of illness was highest for individuals with no education (Mean=1.02; CI95: 0.90, 1.14) and lowest for individuals with higher levels of educational attainment (Mean=0.59; CI95: 0.44, 0.73). Similarly, the risk of illness for the poorest 20% of the study sample as measured by total monthly income (Mean=1.13; CI95: 0.98, 1.27) was nearly double that of the wealthiest 20% of the study sample (Mean=0.57; CI95: 0.50, 0.65).
Burden of disease
Among adults aged 18–59 years and children 0–17 years in the study population, the annual risk of disease was computed for the major disease categories (Table 2). Malaria and fever together still constitute the highest annual risk for both adults and children in this population.
Table 2.
Average Annual Risk of Illness by Disease Category
| Disease Category | Adults (18–59 Years) | Children (0–17 Years) |
| General body pains | 0.22*(0.19, 0.26) | 0.05*(0.03,0.07) |
| Malaria | 0.20* (0.17, 0.23) | 0.20*(0.16,0.24) |
| Fever | 0.12* (0.10, 0.14) | 0.14*(0.11,0.17) |
| Diarrhoea, intestinal and stomach issues | 0.11*(0.09, 0.13) | 0.09*(0.06,0.11) |
| Other health problems | 0.08*(0.06,0.10) | 0.08*(0.06,0.11) |
| Cough, cold and flu | 0.05* (0.03,0.07) | 0.06*(0.04,0.09) |
| Cardiovascular issues | 0.011* (0.004,0.018) | 0.004(−0.002,0.010) |
| Typhoid | 0.011*(0.004,0.018) | 0.004(−0.002,0.0010) |
| Hypertension | 0.006* (0.0008,0.012) | -- |
| Injuries | 0.005*(0.0001,0.0098) | 0.006(0.0008,0.0128) |
| Diabetes | -- | 0.002(−0.002,0.006) |
Note: No cases of diabetes for the adult population 18–59 years. No cases of hypertension for the child population 0–17 years.
Significant at the 95% level.
Malaria
Malaria variations by season. Three hundred and two
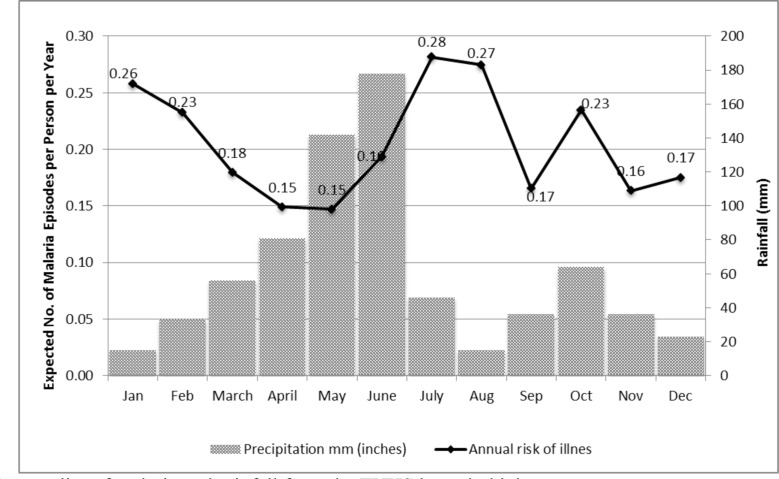
(302) illness episodes of malaria were reported in the sample. The annual risk of malaria exhibited seasonal fluctuations, with the highest risk being in July (Mean=0.28; CI95: 0.19, 0.37) and August (Mean=0.27; CI95: 0.18, 0.36). Not surprisingly, the probability of a malaria episode increased with greater levels of precipitation, and declined with lower levels of precipitation (Figure 4).
Figure 4.
Seasonality of malaria and rainfall from the TUHS household data
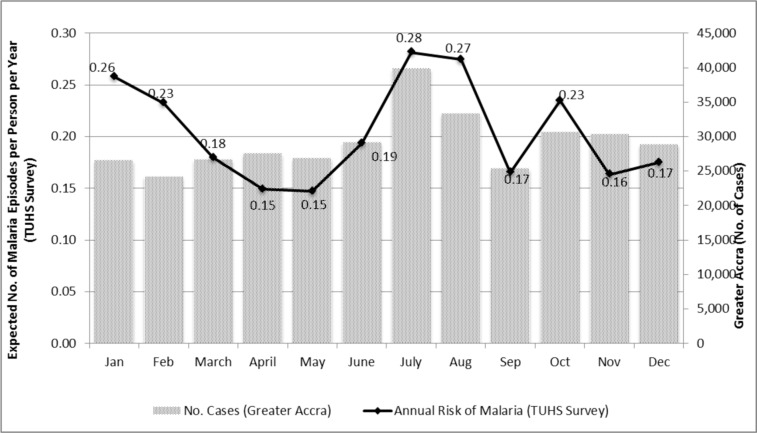
Broadly, the seasonality patterns of malaria observed in the TUHS mirror those found in the facility-based data for Greater Accra but there is a noticeable divergence particularly in March, November and December (Figure 5).
Figure 5.
Seasonality of Malaria in the TUHS Survey versus Greater Accra
Note: TUHS reflects incidence in panel data during 2008–9. The Greater Accra data are from out-patient clinics in Accra 20012006.
Malaria variations by demographic characteristics. The annual risk of malaria exhibited variations by education level of respondent. Individuals with higher levels of education (beyond secondary school) were at low risk for malaria (Mean=0.18; CI95: 0.10, 0.26). Surprisingly, individuals with only a primary level of education had a similar risk of malaria (Mean=0.17; CI95: 0.13, 0.21) relative to individuals with higher levels of education; individuals with a secondary level of education also exhibited a similar risk of malaria relative to those with higher levels of education. Individuals with no education had the highest risk of malaria (Mean=0.26; CI95: 0.20, 0.32).
The annual risk of malaria was also higher for the poorest 20% of the study sample as measured by total monthly income (Mean=0.25; CI95: 0.18, 0.32), compared to the richest 20% of the study sample (Mean=0.17; CI95: 0.13, 0.22). Risk of malaria varied by age of respondent, but only slightly, with the average annual probability of malaria ranging from 0.20 (CI95: 0.16, 0.24) for children 0–17 years, 0.20 (CI95: 0.17, 0.23) for adults 18–59 years, and 0.22 (CI95: 0.15, 0.30) for adults 60 years and over.
Malaria variations by Sub-metro. We analyzed the annual risk of malaria by Sub-metro and, correspondingly, by calendar year quarters (Table 3).
Table 3.
Malaria Patterns by Sub-metro
| Sub-metro | Q1 | Q2 | Q3 | Q4 |
| (January–March) | (April–June) | (July– September) | (October– December) | |
| Ablekuma | 0.12*(0.06,0.18) | 0.15*(0.08,0.22) | 0.21*(0.13,0.29) | 0.11*(0.05,0.17) |
| Ashiedu Keteke | 0 (−0.06,0.06) | 0.1(−0.04,0.23) | 0.22 (−0.03,0.47) | 0.16* (0.02,0.30) |
| Osu Klottey | 0.42* (0.08,0.75) | - | 0.30* (0.04,0.57) | 0.27* 0.08,0.46) |
| Kpeshie | 0.27*(0.15,0.39) | 0.18*(0.10,0.27) | 0.27*(0.16,0.38) | 0.20*(0.11,0.30) |
| Ayawaso | 0.34*(0.19,0.49) | 0.18*(0.08,0.27) | 0.24*(0.14,0.34) | 0.25*(0.14,0.35) |
| Okaikoi | 0.33*(0.16,0.51) | 0.17*(0.07,0.26) | 0.26*(0.12,0.41) | 0.24*(0.07,0.40) |
Significant at the 95% level. Confidence intervals in brackets
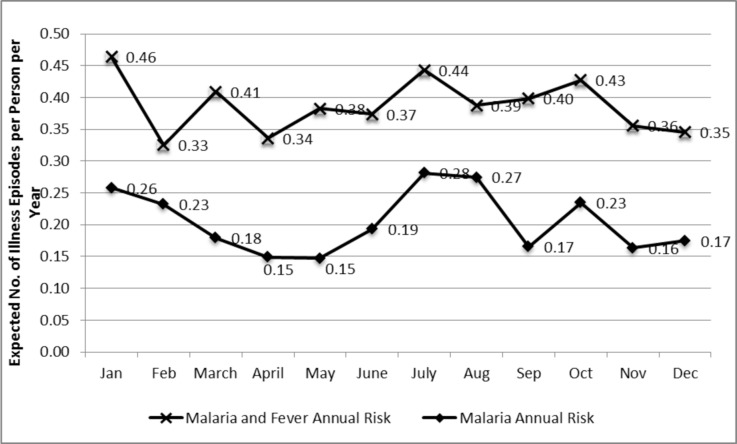
Importantly, the annual risk of malaria is distinct from the annual risk of fever. Individuals reporting both fever and malaria in this study were coded as having malaria, whereas individuals reporting fever only were coded simply as fever. Figure 6 illustrates the distinction between the expected number of illness episodes per person per year with malaria and fever combined, versus malaria alone.
Figure 6.
Annual Risk of Malaria and Fever Combined versus Malaria Alone
Discussion
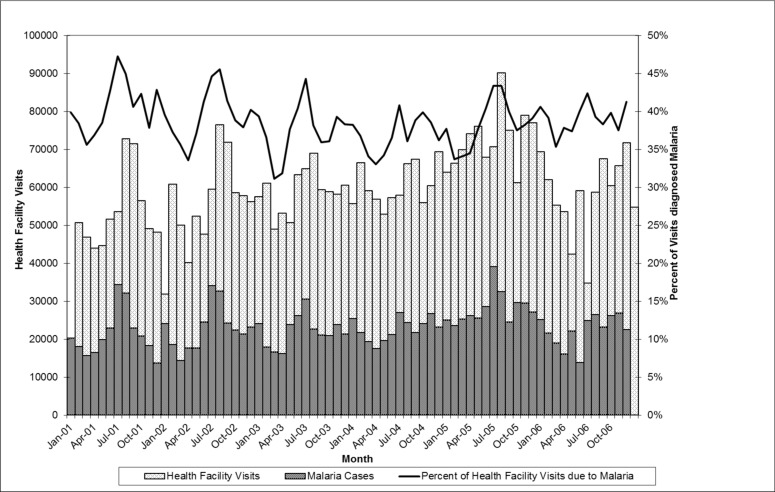
The proportion of health facility visits due to presumptive malaria fluctuated regularly over time, displaying a cyclical nature. It appears that presumptive malaria morbidity was related to the total number of health facility visits. This could be attributable to either a high burden of malaria in Accra, or a large proportion of health facility visits being diagnosed as malaria (potentially incorrectly). In the latter case, we would expect the proportion of presumptive malaria diagnoses to remain relatively stable, with the absolute number of presumptive malaria cases changing according to the absolute number of health facility visits. Considering that the proportion of monthly out-patient visits clinically diagnosed as malaria does not remain constant, but ranges from 31 to 47 per cent, and is significantly associated with rainfall, it seems reasonable that if the majority of these diagnoses are correct, the monthly fluctuations seen in out-patient visits in Accra is largely the result of monthly fluctuations in malaria morbidity.
It is unclear what might have influenced the increased number of health facility visits, both for all causes and presumptive malaria in 2005. A combination of factors, including the implementation of a national health insurance scheme, the distribution of ITNs, scaling up of IPTp, and an intensive malaria public education campaign, particularly on the then revised treatment policy may have contributed. Ghana's National Health Insurance Scheme (NHIS) was implemented in 2005, which may have prompted a larger proportion of the population to seek care in 2005 during the initial rollout. In addition, the implementation in the same year of the revised anti-malaria drug policy which recommended artemisinin-based combination therapy in preference to chloroquine might have contributed to the high utilization of the health facilities since the ACTs were initially available in the public health facilities. Following this, the number of out-patient visits decreased again in 2006. A potential hypothesis for the increased visits in 2005, and subsequent decrease in 2006 could be attributable to, firstly, individuals using health facilities consistently for the first time as a result of the NHIS and then discontinuing use of the health services in 2006 as they became dissatisfied with the system due to long wait times and lack of prescription drug coverage and secondly, to the reported adverse reactions to artesunate-amodiaquine which nearly marred the introduction of the ACTs.
We expected to see an increase in out-patient visits due to malaria in 2006, after the roll out of the NMCP's malaria education campaign in 2005. A potential explanation may bea possible fear of adverse reactions to artemisinin combination therapies (ACT). In December 2005, the Ghana Food and Drug Board announced that single tablets of artesunate-amodiaquine 200/600mg would be withdrawn from the market for additional safety testing. The withdrawal was a result of the news media and civil society expressing concern regarding the safety and efficacy of ACT in treating uncomplicated malaria.21 One hypothesis is that concern about the safety of ACT may have prompted a large segment of the population to treat malaria at home with chloroquine or other drugs, rather than attend clinics where they were likely to be given ACT. This hypothesis is supported by the NMCP's 2007 report, which shows that ACT was only used by 4.3 per cent of respondents nationwide in 2006, with the proportion dropping to 2 per cent in 2007.17
The seasonal variation of malaria indicates an opportunity for preventive action. The increase in morbidity in the under 5 population during the summer months has implications for potential intermittent preventive treatment programs in infants (IPTi) and children. IPTi is currently being tested at a number of sites in Ghana as part of a pilot program, originally funded by the Gates Foundation and UNICEF, and now sustained by PMI.23 The IPTi strategy is to provide antimalarial drugs for infants three times during the first year of life, in conjunction with routine immunizations. This strategy has been shown to be effective in rural areas of Tanzania.24 Given the delayed age at first infection generally seen in urban areas, it may be necessary to alter the course of treatment for children in urban regions. In Accra, such an alteration to the timing of IPTi should consider the higher presumptive malaria morbidity and health facility visits seen in the summer months. At a minimum, the seasonal variation of malaria in Accra should be taken into consideration when planning media campaigns, educational programs and bednet distributions. These programs should be designed to make people aware of malaria and how to prevent it prior to the increase in risk seen in July and August.
Numerous studies have shown that, due to delayed immunity and the use of anti-malarial medications, prevalence of malaria in urban settings is often higher in older children.2,7–9,22
Decreased transmission levels in urban areas result in a delayed immunity amongst children. This favours a consistent prevalence level up to the age at which immunity is acquired, when prevalence begins to decrease. In addition, treatment of all febrile episodes in children with anti-malaria drugs at early ages can essentially amount to a prophylactic treatment in young children, further preventing the acquisition of immunity.9 This could serve to explain the consistent proportion of clinic visits attributable to malaria amongst 0–14 year olds in Accra.
Differences in the age distribution of malaria could be due to varying patterns in health facility attendance by age groups in different parts of the city based on socioeconomic status and access to care. Diversity in the age distribution of malaria, and the proportion of malaria cases seen across the city could also potentially be due to true spatial trends within the city, if it is assumed that people attend clinics near their homes. Individuals in Accra are not required to attend health clinics in their neighborhood, so it is likely that the population bases their choice of health facility on numerous factors and may not necessarily attend the nearest clinic. Nonetheless, it is worth noting that variability in malaria transmission and parasitaemia prevalence is a common characteristic of urban malaria. It is unclear from this analysis whether differences in the age distribution or the proportion of clinic cases due to presumptive malaria are representative of spatial trends across the city. The differences in the age distribution and proportion of presumptive malaria cases seen at different clinics suggest that a spatial analysis of malaria incidence in Accra would be a beneficial direction for future research.
This study reveals notable differences between the lowest and richest income groups, with the annual risk of malaria greater for the poorest 20% of the study sample. A similar pattern was found with respect to education level. Individuals with no education exhibited a higher annual risk of malaria compared to individuals with a higher level of education, but a comparable risk to individuals with primary or secondary education. We observed some variations in the risk of malaria by age group as well. Seasonal patterns of malaria were also noted, with a greater risk of malaria found during periods of higher precipitation. This paper also illustrates detailed variations in the variability of the risk of malaria from year to year and by the six sub-metro areas in this study.
Although malaria risks in African cities in tropical Africa are generally seen as less important than those in rural areas, this and related studies25 point to the importance of directing more prevention and treatment efforts toward these rapidly growing urban populations.
Figure 1.
Health Facility (HF) Visits due to All Causes and Presumptive Malaria in Accra, Ghana 2001 – 2006
References
- 1.Chinery WA. Effects of ecological changes on the malaria vectors Anopheles funestus and the Anopheles gambiae complex of mosquitoes in Accra, Ghana. Journal of Tropical Medicine and Hygiene. 1984;87:75. [PubMed] [Google Scholar]
- 2.Colbourne MJ, Edington GM. Mortality from Malaria in Accra. The Journal of Tropical Medicine and Hygiene. 1954;57:203–211. [PubMed] [Google Scholar]
- 3.Colbourne MJ, Wright FN. Malaria in the Gold Coast (Part I) West AfrMedJ. 1955;4:3–17. [PubMed] [Google Scholar]
- 4.Gardiner CN, Biggar RJ, Collins W, Nkrumah F. Malaria in urban and rural areas of southern Ghana: a survey of parasitaemia and of anti-malarial practice. Journal of tropical pediatrics. 1984;30:296–299. doi: 10.1093/tropej/30.6.296. [DOI] [PubMed] [Google Scholar]
- 5.Klinkenberg E, McCall PJ, Wilson MD, Akoto AO, Amerasinghe FP, Bates I, Verhoeff FH, Barnish G, Donnelly MJ. Urban malaria and anaemia in children: a cross-sectional survey in two cities of Ghana. Tropical medicine & international health. 2006;11:578–588. doi: 10.1111/j.1365-3156.2006.01609.x. [DOI] [PubMed] [Google Scholar]
- 6.Klinkenberg E, McCall PJ, Hastings IM, Wilson MD, Amerasinghe FP, Donnelly MJ. Malaria and Irrigated Crops, Accra, Ghana. Emerging Infectious Diseases. 2005;11:1290–1293. doi: 10.3201/eid1108.041095. [DOI] [PMC free article] [PubMed] [Google Scholar]
- 7.Kazadi W, Sexton JD, Bigonsa M, W'Okanga B, Way M. Malaria in primary school children and infants in Kinshasa, Democratic Republic of the Congo: surveys from the 1980s and 2000. The American Journal of Tropical Medicine and Hygiene. 2004;71(Suppl):97–102. [PubMed] [Google Scholar]
- 8.Modiano D, Sirima BS, Sawadogo A, Sanou I, Pare J, Konate A, Pagnoni F. Severe malaria in Burkina Faso: influence of age and transmission level on clinical presentation. The American Journal of Tropical Medicine and Hygiene. 1998;59:539–542. doi: 10.4269/ajtmh.1998.59.539. [DOI] [PubMed] [Google Scholar]
- 9.Trape JF. Malaria and urbanization in Central Africa: the example of Brazzaville: Part IV. Parasitological and serological surveys in urban and surrounding rural areas. Transactions of the Royal Society of Tropical Medicine and Hygiene. 1987;81(Supplement 2):26–33. doi: 10.1016/0035-9203(87)90474-3. [DOI] [PubMed] [Google Scholar]
- 10.Robert V, Macintyre K, Keating J, Trape JF, Duchemin JB, Warren M, Beier JC. Malaria transmission in urban sub-Saharan Africa. The American Journal of Tropical Medicine and Hygiene. 2003;68:169–176. [PubMed] [Google Scholar]
- 11.Vercruysse J, Jancloes M, Van de Velden L. Epidemiology of seasonal falciparum malaria in an urban area of Senegal. Bulletin of the World Health Organization. 1983;61:821–831. [PMC free article] [PubMed] [Google Scholar]
- 12.Lines J, Harpham T, Leake C, Schofield C. Trends, priorities and policy directions in the control of vector-borne diseases in urban environments. Health policy and planning. 1994;9:113–129. doi: 10.1093/heapol/9.2.113. [DOI] [PubMed] [Google Scholar]
- 13.Mega-Cities Project: Innovations for Urban Life 2000–2007. 2008. [Homepage of The Mega-Cities Project], [Online]. Available: http://www.megacitiesproject.org/network_accra.asp. [April 2, 2008] [Google Scholar]
- 14.Afrane YA, Klinkenberg E, Drechsel P, Owusu-Daaku K, Garms R, Kruppa T. Does irrigated urban agriculture influence the transmission of malaria in the city of Kumasi, Ghana? Acta Tropica. 2004;89:125–134. doi: 10.1016/j.actatropica.2003.06.001. [DOI] [PubMed] [Google Scholar]
- 15.Stoler J, Weeks JR, Getis A, Hill AG. A Distance Threshold for the Effect of Urban Agriculture on Elevated Self-reported Malaria Prevalence in Accra, Ghana. American Journal of Tropical Medicine and Hygiene. 2009;80:547–554. [PMC free article] [PubMed] [Google Scholar]
- 16.Ronald LA, Kenny SL, Klinkenberg E, Akoto AO, Boakye I, Barnish G, Donnelly MJ. Malaria and anaemia among children in two communities of Kumasi, Ghana: a cross-sectional survey. Malaria Journal. 2006;5:105. doi: 10.1186/1475-2875-5-105. [DOI] [PMC free article] [PubMed] [Google Scholar]
- 17.Mid Term Assessment of Malaria Control Programme Activities in Ghana. National Malaria Control Programme, Ghana Health Service; 2007. [Google Scholar]
- 18.Ghana Meteorological Services Department, author. Climatology 2002. 2008. [Homepage of Ghana Meteorological Services Department], [Online]. Available: http://www.meteo.gov.gh/climatology.html. [April 7, 2008] [Google Scholar]
- 19.Kim HJ, Fay MP, Feuer EJ, Midthune DN. Permutation tests for joinpoint regression with applications to cancer rates. Statistics in Medicine. 2000;19:335–351. doi: 10.1002/(sici)1097-0258(20000215)19:3<335::aid-sim336>3.0.co;2-z. [DOI] [PubMed] [Google Scholar]
- 20.Adams I, Darko D, Ahadzie L, Cofie P, editors. Information for Action: A Digest of Current Information for Decision Makers in the Health Sector. Center for Health Information Management, Ghana Health Service; 2004. [Google Scholar]
- 21.Food and Drugs Board Takes Action on Artesunate Amodiaquine. 2005. December 19, 2005last update [Homepage of Ghana Health Service], [Online]. Available: http://www.ghanahealthservice.org/articles.php?nd=33&tt=Food+and+Drugs+Board+Takes+Action+On+Artesunate+Amodiaquine [May 10, 2008] [Google Scholar]
- 22.Wang SJ, Lengeler C, Smith TA, Vounatsou P, Cisse G, Tanner M. Rapid urban malaria appraisal (RUMA) III:Epidemiology of urban malaria in the municipality of Yopougon (Abidjan) Malar J. 2006;5:28. doi: 10.1186/1475-2875-5-28. [DOI] [PMC free article] [PubMed] [Google Scholar]
- 23.President's Malaria Initiative, Malaria Operational Plan -Year Three (FY 2010) Ghana: [Google Scholar]
- 24.Schellenberg D, Menendez C, Kahigwa E, Aponte J, Vidal J, Tanner M, Mshinda H, Alonso P. Intermittent treatment for malaria and anaemia control at time of routine vaccinations in Tanzanian infants: a randomised, placebo-controlled trial. Lancet. 2001;35:1471–1477. doi: 10.1016/S0140-6736(00)04643-2. [DOI] [PubMed] [Google Scholar]
- 25.de Castro MC, Yamagata Y, Mtasiwa D, Tanner M, Utzinger J, Keiser J, Singer BH. Integrated Urban Malaria Control: A Case Study in Dar es Salaam, Tanzania. American Journal of Tropical Medicine and Hygiene. 2004;71(Supplement 2):103–117. [PubMed] [Google Scholar]


