

Abstract
CD105 (endoglin) is an independent marker for poor prognosis in more than 10 solid tumor types. The goal of this study was to develop a CD105-specific agent for both positron emission tomography (PET) and near-infrared fluorescence (NIRF) imaging, which has potential clinical applications in the diagnosis and imaged-guided resection of solid tumors. TRC105, a chimeric anti-CD105 monoclonal antibody, was conjugated to a NIRF dye (800CW) and p-isothiocyanatobenzyl-desferrioxamine (Df-Bz-NCS) before 89Zr-labeling. Another chimeric antibody, cetuximab, was used as an isotype-matched control. FACS analysis revealed no difference in CD105 binding affinity/specificity between TRC105 and Df-TRC105-800CW. Serial PET imaging revealed that the 4T1 tumor uptake of 89Zr-Df-TRC105-800CW was 6.3 ± 1.9, 12.3 ± 1.3, and 11.4 ± 1.1 %ID/g at 4, 24, and 48 h post-injection (p.i.) respectively (n = 3), higher than all organs starting from 24 h p.i., which provided excellent tumor contrast. Tumor uptake as measured by both in vivo and ex vivo NIRF imaging had a linear correlation with the %ID/g values obtained from PET, corroborated by biodistribution studies. Blocking experiments, control studies with 89Zr-Df-cetuximab-800CW, and histology all confirmed the CD105 specificity of 89Zr-Df-TRC105-800CW. In conclusion, herein we report dual-modality PET and NIRF imaging of CD105 expression in a breast cancer model, where CD105-specific uptake of 89Zr-Df-TRC105-800CW in the tumor was observed.
Keywords: CD105/endoglin, positron emission tomography (PET), near-infrared fluorescence (NIRF), tumor angiogenesis, 89Zr, TRC105
Introduction
One of the core hallmarks of cancer is angiogenesis [1]. It is now generally recognized that angiogenesis is important not only during the rapidly growing macroscopic stage, but also in the microscopic premalignant phase of neoplastic progression. The last decade has witnessed a tremendous expansion of research on angiogenesis, particularly those involving noninvasive molecular imaging techniques [2]. Besides the two most intensively studied angiogenesis-related targets, integrin αvβ3 and vascular endothelial growth factor receptors (VEGFRs) for which several tracers have entered clinical investigation [3-8], CD105 (also called “endoglin”, a 180 kDa disulfide-linked homodimeric transmembrane protein) is another marker for tumor angiogenesis [9-11].
High CD105 expression correlates with poor prognosis in more than 10 solid tumor types [9,10]. In a study of 905 breast cancer patients, it was concluded that CD105, but not other angiogenesis markers such as VEGFR-2, is endowed with prognostic significance that can be useful for patient management, particularly for selecting node-negative patients for therapy [12]. Noninvasive imaging of CD105 is superior to histological analysis of biopsy samples, as it offers a quantitative and whole-body readout of CD105 expression level in all tumors, which can facilitate lesion detection, patient stratification, anticancer drug development, and personalized therapies. However, molecular imaging of CD105 expression is understudied to date, and the available literature reports are all based on labeled anti-CD105 antibodies [13-23].
Positron emission tomography (PET) imaging has been widely used in clinical oncology for cancer staging and monitoring the therapeutic response [24-29]. Over the last decade, PET with 89Zr-labeled monoclonal antibodies (mAbs) has gained significant interest [20,30-32]. A feasibility study to determine the optimal dosage and timing of administering 89Zr-labeled trastuzumab (a mAb recognizing the type 2 human epidermal growth factor receptor) in patients with metastatic breast cancer has been reported [33]. Excellent tumor uptake in metastatic liver, lung, bone, and even brain tumor lesions was observed. Recently, a new bifunctional chelate was reported for 89Zr labeling: p-isothiocyanatobenzyl-desferrioxamine B (Df-Bz-NCS) [34]. This agent can be used for 89Zr-labeling of mAbs through a simplified 2-step procedure.
Each molecular imaging technique has advantages and disadvantages [35-39]. PET has very high sensitivity but suffers from relatively poor resolution. Optical imaging, although convenient and relatively inexpensive, is difficult to be quantitative. PET/optical imaging, with a single contrast agent, can offer synergistic advantages over either modality alone [40]. The near-infrared (NIR; 700 - 900 nm) region is optimal for in vivo optical imaging since the absorbance spectra for all biomolecules reach minima, thus providing a clear optical window for small animal studies and limited clinical scenarios (e.g. breast imaging, endoscopy, surgical guidance, etc.) [41]. In addition to better tissue penetration of light, there is also significantly less background signal from tissue autofluorescence in the NIR window. Dual-modality PET/NIR fluorescent (NIRF) agents may be particularly useful by employing the whole-body PET scan to identify the location of tumor(s), and NIRF imaging to guide tumor resection.
TRC105, a human/murine chimeric IgG1 mAb which binds to both human and murine CD105, has a very high avidity (with a KD of 2 ng/mL) for human CD105. A multicenter Phase 1 first-in-human dose-escalation trial of TRC105 has been completed in the United States, and Phase 2 therapy trials are underway in patients with various solid tumor types [42]. In this study, we labeled TRC105 with both 89Zr and a NIRF dye, IRDye 800CW which has an emission maximum of 806 nm, and investigated 89Zr-Df-TRC105-800CW for dual-modality PET/NIRF imaging of tumor angiogenesis in a mouse model of breast cancer.
Materials and methods
Reagents
TRC105 was provided by TRACON pharmaceuticals Inc. (San Diego, CA). Cetuximab (a human/murine chimeric IgG1 mAb that binds to human epidermal growth factor receptor [EGFR] but does not cross-react with murine EGFR [19]) was from Bristol-Myers Squibb (Princeton, NJ). AlexaFluor488- and Cy3-labeled secondary antibodies were purchased from Jackson Immunoresearch Laboratories, Inc. (West Grove, CA). Df-Bz-NCS and Chelex 100 resin (50-100 mesh) were purchased from Macrocyclics, Inc. (Dallas, TX) and Sigma-Aldrich (St. Louis, MO), respectively. IRDye 800CW-NHS (NHS denotes N-hydroxysuccinimide) ester was acquired from LI-COR Biosciences Co. (Lincoln, NE). Water and all buffers were of Millipore grade and pre-treated with Chelex 100 resin to ensure that the aqueous solution was heavy metal-free. PD-10 columns were purchased from GE Healthcare (Piscataway, NJ). All other reaction buffers and chemicals were from Thermo Fisher Scientific (Fair Lawn, NJ).
Cell lines and animal model
4T1 murine breast cancer and human umbilical vein endothelial cells (HUVECs) were purchased from the American Type Culture Collection (ATCC, Manassas, VA). 4T1 cells were cultured in RPMI 1640 medium (Invitrogen, Carlsbad, CA) with 10% fetal bovine serum and incubated at 37 °C with 5% CO2. HUVECs were cultured in M-200 medium (Invitrogen, Carlsbad, CA) with 1× low serum growth supplement (Cascade Biologics, Portland, OR) at 37 °C with 5% CO2. Cells were used for in vitro and in vivo experiments when they reached ~75% confluence.
All animal studies were conducted under a protocol approved by the University of Wisconsin Institutional Animal Care and Use Committee. For the 4T1 tumor model, four- to five-week-old female Balb/c mice were purchased from Harlan (Indianapolis, IN) and tumors were established by subcutaneously injecting 2 × 10⁶ cells, suspended in 100 μL of 1:1 mixture of RPMI 1640 and Matrigel (BD Biosciences, Franklin lakes, NJ), into the front flank of mice [43]. Tumor sizes were monitored every other day and mice were used for in vivo experiments when the diameter of tumors reached 5-8 mm (typically 1-2 weeks after inoculation).
Production of 89Zr
89Zr-oxalate was produced according to the literature procedure with minor modifications [21,31]. Briefly, natural yttrium foil (250 μm, 99.9%) was irradiated with a proton beam (8-10 μA) to create 89Zr via the 89Y(p,n)89Zr reaction, using a 11.4 MeV CTI RDS 112 cyclotron. After isotope separation and purification, 89Zr-oxalate was obtained which has a specific activity of >200 MBq/μg of Zr, similar to the values reported for high specific activity 89Zr [31].
Antibody conjugation and 89Zr-labeling
TRC105 or cetuximab was mixed with Df-Bz-NCS at pH 9.0 with a molar ratio of 1:3 (Figure 1). The resulting Df-TRC105 and Df-cetuximab were purified with PD-10 size exclusion chromatography columns using a 0.25 M NaOAc solution (with 5 mg/mL of added gentisic acid) as the mobile phase. Subsequently, two molar equivalences of 800CW-NHS were used for labeling Df-TRC105 or Df-cetuximab. The pH value of the reaction mixture was adjusted to 8.5 with 0.1 M Na2CO3. After continuously stirring the reaction mixture at room temperature (RT) for 2 h, Df-TRC105-800CW and Df-cetuximab-800CW were purified with PD-10 columns.
Figure 1.

Synthesis of 89Zr-Df-TRC105-800CW. 89Zr-Df-cetuximab-800CW was prepared in a similar manner.
For radiolabeling, 74-148 MBq of 89Zr-oxalate was neutralized with a 2 M Na2CO3 solution and added to a solution of Df-TRC105-800CW or Df-cetuximab-800CW, where 0.05-0.25 mg of the mAb conjugate was used per 37 MBq of 89Zr. The total reaction volume was adjusted to 2 mL with 0.5 M HEPES buffer (pH 7.1-7.3) and the reaction mixture (pH 6.8-7.2) was incubated for 1 h at RT with constant shaking. 89Zr-Df-TRC105-800CW and 89Zr-Df-cetuximab-800CW were purified using PD-10 columns as described above. The radioactive fractions containing 89Zr-Df-TRC105-800CW or 89Zr-Df-cetuximab-800CW were collected and passed through a 0.2 μm syringe filter for in vivo experiments.
Flow cytometry
The immunoreactivities of TRC105 and Df-TRC105-800CW to HUVECs (high CD105 expression [19,44]) and 4T1 cells (CD105-negative [19]) were evaluated by fluorescence-activated cell sorting (FACS) analysis. Briefly, cells were harvested and suspended in cold phosphate-buffered saline (PBS, pH 7.4) with 2% bovine serum albumin at a concentration of 5 × 10⁶ cells/mL. The cells were incubated with various concentrations of TRC105 or Df-TRC105-800CW (1, 5, or 10 μg/mL) for 30 min at RT, washed three times with cold PBS, and centrifuged at 1,000 rpm for 5 min. The cells were then incubated with AlexaFluor488-labeled goat anti-human IgG (5 μg/mL) for 30 min at RT. Afterwards, the cells were washed and analyzed by FACS using a BD FACSCalibur 4-color analysis cytometer, which is equipped with 488 nm and 633 nm lasers (Becton-Dickinson, San Jose, CA) and FlowJo analysis software (Tree Star, Inc., Ashland, OR).
Imaging and biodistribution studies
Hair on the back of each mouse was removed before imaging studies to reduce light scattering. PET scans were performed using an Inveon microPET/microCT rodent model scanner (Siemens Medical Solutions USA, Inc.). Each 4T1 tumor-bearing mouse was intravenously injected with 5-10 MBq of the PET tracer, 89Zr-Df-TRC105-800CW or 89Zr-Df-cetuximab-800CW, adjusted to contain 300 picomoles (pmol) of 800CW using “cold” Df-TRC105-800CW or Df-cetuximab-800CW. Five-minute static PET scans were performed at various time points post-injection (p.i.). The images were reconstructed using a maximum a posteriori (MAP) algorithm, with no scatter correction. Region-of-interest (ROI) analysis of each PET scan was performed using vendor software (Inveon Research Workplace [IRW]) on decay-corrected whole-body images as described previously [19,40], to calculate the percentage injected dose per gram of tissue (%ID/g) values for the 4T1 tumor and several major organs.
Blocking studies were carried out to evaluate the CD105 specificity of 89Zr-Df-TRC105-800CW in vivo, where a group of 3 mice was each injected with 2 mg of TRC105 within 2 h before 89Zr-Df-TRC105-800CW administration. A subset of mice was also subjected to CT scans, with a voxel resolution of 210 μm. Fiducial markers were used for co-registration and images were reconstructed using the vendor software (Inveon Acquisition Workplace; Siemens). The CT and PET datasets were registered via rigid registration in IRW.
Immediately after PET scanning, mice were imaged in a Pearl Impulse scanner (LI-COR, Inc., Lincoln, NE) using the 800 nm/white channels. Longitudinal NIRF images for each mouse were normalized with common minimum and maximum values. Using vendor software, ROIs were drawn on the 4T1 tumors and the average signal intensity (presented as mean ± SD in the unit of counts/s/mm2) within the ROI was used for subsequent quantitative analysis.
After the last in vivo PET/NIRF imaging at 48 h p.i., blood, 4T1 tumor, and major organs/tissues were harvested and imaged ex vivo with both scanners to validate the in vivo findings. Biodistribution studies were also carried out to confirm that the quantitative tracer uptake values based on PET imaging truly represented the radioactivity distribution in tumor-bearing mice. Blood, 4T1 tumor, and major organs/tissues were collected and wet-weighed. The radioactivity in the tissue was measured using a gamma-counter (Perkin Elmer) and presented as %ID/g. The 4T1 tumor, liver, and spleen (i.e. tissues with significant uptake of 89Zr-Df-TRC105-800CW) were also frozen for histological analysis.
Histology
Frozen tissue slices of 5 μm thickness were fixed with cold acetone for 10 min and dried in the air for 30 min. After rinsing with PBS and blocking with 10% donkey serum for 30 min at RT, the slices were incubated with TRC105 (2 μg/mL) for 1 h at 4 °C and visualized using AlexaFluor488-labeled goat anti-human IgG. The tissue slices were also stained for endothelial marker CD31 as described previously [45,46]. After washing with PBS, the slices were incubated with rat anti-mouse CD31 antibody (2 μg/mL) for 1 h, followed by Cy3-labeled donkey antirat IgG for 30 min. All images were acquired with a Nikon Eclipse Ti microscope.
Statistical analysis
Quantitative data were expressed as mean ± SD. Means were compared using Student’s t-test. P values < 0.05 were considered statistically significant. The %ID/g values based on PET were correlated with the quantitative data obtained from in vivo/ex vivo NIRF imaging. Applying a linear fit, the correlation coefficient (R) was calculated to measure the strength of the association between the PET and in vivo/ex vivo NIRF data. P values < 0.05 were considered to indicate a statistically significant linear correlation between the two measurements.
Results
In vitro investigation of Df-TRC105-800CW
In the final conjugates (Df-TRC105-800CW or Df-cetuximab-800CW), an average of ~0.6 Df and ~0.7 800CW molecules were conjugated to each mAb, respectively. Not having more than one 800CW per mAb will avoid any self-quenching due to the close proximity of 800CW molecules, since fluorescence resonance energy transfer only occurs when two 800CW molecules are within 10 nm (about the size of an mAb). Such minimal Df/800CW conjugation of TRC105 did not alter its CD105 binding affinity, as evidenced by FACS analysis of HUVECs (which express a high level of CD105) (Figure 2). No differences were observed between TRC105 and Df-TRC105-800CW at 1 or 5 μg/mL concentrations, both at non-saturating conditions (i.e. the fluorescence signal was at ~103 but not 104 in FACS). Binding was specific, as neither TRC105 nor Df-TRC105-800CW bound to CD105-negative 4T1 cells, even at a much higher concentration of 10 μg/mL (Figure 2). Taken together, FACS analysis confirmed that Df and 800CW conjugation did not alter the antigen binding affinity or specificity of TRC105.
Figure 2.

Flow cytometry analysis of TRC105 and Df-TRC105-800CW in HUVECs (CD105-positive) and 4T1 murine breast cancer cells (CD105-negative) at different concentrations. Data from various control experiments are also shown.
89Zr-labeling
89Zr-labeling, including final purification using PD-10 columns, took 100 ± 10 min (n = 10). The decay-corrected radiochemical yield was 55 ± 10%, based on 0.05-0.25 mg of mAb conjugate (Df-TRC105-800CW or Df-cetuximab-800CW) per 37 MBq of 89Zr, and the radiochemical purity was > 95%. The specific activity of both 89Zr-Df-TRC105-800CW and 89Zr-Dfcetuximab-800CW was between 0.08 and 0.4 GBq/mg protein, assuming complete recovery of the Df-mAb-800CW conjugates following size exclusion chromatography.
Small animal PET imaging
The time points of 4, 24, and 48 h p.i. were chosen for serial PET/NIRF scans after intravenous tracer injection based on our previous study, with the first time point occurring during the initial tumor accumulation phase and the later two points within the plateau of 4T1 tumor uptake [19]. Coronal PET images that contain the 4T1 tumor are shown in Figure 3A, with the quantitative data obtained from ROI analysis and representative PET/CT fused images of a mouse at 48 h p.i. of 89Zr-Df-TRC105-800CW shown in Figure 4.
Figure 3.
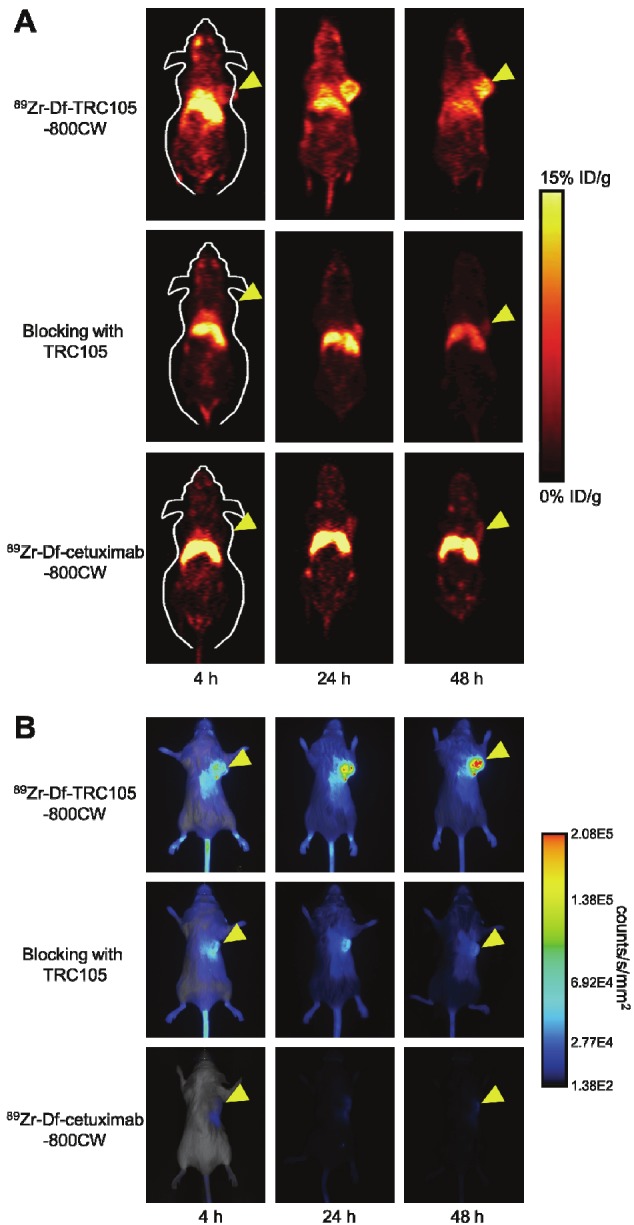
Serial in vivo PET/NIRF imaging of 4T1 tumor-bearing mice. A. Serial coronal PET images at 4, 24, and 48 h post-injection of 89Zr-Df-TRC105-800CW, 2 mg of TRC105 before 89Zr-Df-TRC105-800CW (i.e. blocking), or 89Zr-Df-cetuximab-800CW. B. Serial NIRF images of the same mice in A. The first image in each row is a merged image of the fluorescence signal and a photo of the mouse, while subsequent images in each row are fluorescence images only. For both A & B, arrowheads indicate the 4T1 tumors. Images are representative of a group of 3 mice each, all acquired under the same condition and displayed at the same scale.
Figure 4.

Quantitative ROI analysis of the PET data. A. Time-activity curves of the liver, 4T1 tumor, blood, and muscleupon intravenous injection of 89Zr-Df-TRC105-800CW into 4T1 tumor-bearing mice (n = 3). B. Time-activity curves ofthe liver, 4T1 tumor, blood, and muscle upon intravenous injection of 89Zr-Df-TRC105-800CW, after a blocking doseof TRC105, into 4T1 tumor-bearing mice (n = 3). C. Time-activity curves of the liver, 4T1 tumor, blood, and muscleupon intravenous injection of 89Zr-Df-cetuximab-800CW into 4T1 tumor-bearing mice (n = 3). D. Representative PET/CT images of a 4T1 tumor-bearing mouse at 48 h post-injection of 89Zr-Df-TRC105-800CW.
Due to the superb stability of the 89Zr-Df complex, liver uptake of 89Zr-Df-TRC105-800CW was significantly lower at all time points examined than that observed for 64Cu-DOTA-TRC105 (which may have certain degree of 64Cu-transchelation, thereby increasing radioactivity accumulation in the liver) in our previous study in the same tumor model [19]. Meanwhile, blood pool activity was prominent at early time points (due to the long circulation half-life of the antibody conjugate), which gradually declined over time. Liver uptake of 89Zr-Df-TRC105-800CW was 17.8 ± 1.5, 12.0 ± 1.1, and 9.4 ± 0.9 %ID/g at 4, 24, and 48 h p.i. respectively, while the radioactivity in the blood was 19.4 ± 3.2, 11.3 ± 1.3, and 7.9 ± 1.0 %ID/g at 4, 24, and 48 h p.i., respectively (n = 3; Figure 4A). The 4T1 tumor uptake of 89Zr-Df-TRC105-800CW was clearly visible as early as 4 h p.i. which reached a plateau at around 24 h p.i. (6.3 ± 1.9, 12.3 ± 1.3, and 11.4 ± 1.1 %ID/g at 4, 24, and 48 h p.i. respectively; n = 3; Figure 4A).
Administration of a blocking dose of TRC105 two hours prior to 89Zr-Df-TRC105-800CW injection reduced the tumor uptake to background level (P < 0.05 at 4 h p.i. and < 0.01 at 24 and 48 h p.i. when compared with mice injected with 89Zr-Df-TRC105-800CW alone; Figure 3A, 4B), which clearly indicated the CD105 specificity of the tracer in vivo. Radioactivity in the blood (11.7 ± 0.2, 4.1 ± 1.0, and 1.6 ± 0.5 %ID/g at 4, 24, and 48 h p.i. respectively; n = 3) was also much lower for the “blocking” group. Liver uptake was 13.0 ± 0.7, 11.3 ± 2.2, and 4.2 ± 0.7 %ID/g at 4, 24, and 48 h p.i. respectively (n = 3), similar to that of mice injected with 89Zr-Df-TRC105-800CW alone at 4 and 24 h p.i. but significantly lower at 48 h p.i. (P < 0.01). Together, these data suggested faster blood and hepatic clearance of 89Zr-Df-TRC105-800CW when most CD105 in the mice was already bound by pre-injected TRC105, thereby leaving no CD105 for the tracer to interact with.
To further investigate the CD105 specificity of 89Zr-Df-TRC105-800CW, 89Zr-Df-cetuximab-800CW was used as an isotype-matched control. Both TRC105 and cetuximab are human/murine chimeric IgG1 mAbs. Since cetuximab does not cross-react with murine tissues, it serves as an excellent control for investigating tracer uptake in the tumor due to passive targeting only (i.e. the enhanced permeability and retention effect). As can be seen in Figure 3A and 4C, the 4T1 tumor uptake of 89Zr-Df-cetuximab-800CW is at the background level (< 4 %ID/g) and significantly lower than that of 89Zr-Df-TRC105-800CW at all time points examined (P < 0.05 at 4 h p.i.; P < 0.01 at 24 and 48 h p.i.; n = 3), which again confirms the CD105 specificity of 89Zr-Df-TRC105-800CW in vivo.
In vivo NIRF imaging
In vivo NIRF imaging of 4T1 tumor-bearing mice was carried out at 4, 24, and 48 h p.i. immediately after the PET scans, with representative images from each group shown in Figure 3B. Excellent tumor contrast was observed for 89Zr-Df-TRC105-800CW as early as 4 h p.i. Subsequently, the tumor uptake continued to increase and plateaued at 24 h p.i., suggesting specific interaction between the antibody and its antigen. Quantitative ROI analysis yielded average tumor signal intensity of 6.65×10⁴ ± 1.70×10⁴, 1.24×10⁵ ± 3.80×10⁴, and 1.32×10⁵ ± 6.29×10⁴ counts/s/mm2 at 4, 24, and 48 h p.i., respectively (n = 3; Figure 5A). Pre-injection of 2 mg of TRC105 per mouse before 89Zr-Df-TRC105-800CW administration resulted in tumor signal intensity of 8.00×10⁴ ± 2.69×10⁴, 8.42×10⁴ ± 3.52×10⁴, and 5.19×10⁴ ± 2.41×10⁴ counts/s/mm2 at 4, 24, and 48 h p.i., respectively (n = 3; Figure 5A; P < 0.05 at 48 h p.i. when compared to 89Zr-Df-TRC105-800CW). Tumor signal intensity of 89Zr-Df-cetuximab-800CW was very low (< 5.0×10³ counts/s/mm2) at all time points examined. Taken together, the NIRF imaging results corroborated the PET findings, confirming CD105 specificity of 89Zr-Df-TRC105-800CW in vivo.
Figure 5.

Quantification of the NIRF signal intensity and correlation with PET data. A. Signal intensity of the 4T1 tumor in the 3 groups of mice, based on in vivo NIRF imaging. B. Correlation of the serial in vivo NIRF signal intensity in all 4T1 tumor-bearing mice with the %ID/g values based on ROI analysis of the PET data. C. Ex vivo NIRF and PET imaging of the 4T1 tumor and major organs at 48 h post-injection of each tracer. Images are representative of 3 mice per group. T: 4T1 tumor, L1: liver, B1: blood, H: heart, K: kidney, B2: bone, L2: lung, S: spleen, M: muscle. D. Signal intensity of the 4T1 tumor and major organs in the 3 groups of mice, based on ex vivo NIRF imaging at 48 h post-injection. E. Correlation of the ex vivo NIRF signal intensity in the 4T1 tumor with the %ID/g values based on ROI analysis of the PET data, at 48 h post-injection.
To compare the accuracy in quantification for in vivo PET and NIRF imaging, a total of 27 data points (3 groups of 3 mice/group each scanned at 3 time points) were used to evaluate the linear correlation between the fluorescence signal intensity (obtained from ROI analysis of the in vivo NIRF images) and the %ID/g values (obtained from ROI analysis of the PET data) of the 4T1 tumor. A statistically significant (P =6.97×10⁻⁵) linear correlation was observed, with a correlation coefficient of 0.69 (Figure 5B). Since radioactivity quantification with PET is generally considered to be accurate, such a high linear correlation indicated that noninvasive imaging in the NIR window can provide relatively accurate quantification of tracer uptake in superficial tumors.
Ex vivo imaging and biodistribution studies
All mice were euthanized after the last PET scans at 48 h p.i. Major organs were subjected to both NIRF and PET imaging ex vivo (Figure 5C), which corroborated the in vivo analyses and high degree of correlation between the two imaging modalities. Quantitative data from ROI analysis of major tissues, based on ex vivo NIRF imaging, are shown in Figure 5D. Excellent tumor contrast was observed in mice injected with 89Zr-Df-TRC105-800CW, but not the other two groups. Fluorescence signal intensity in the 4T1 tumor based on in vivo NIRF imaging (1.32×10⁵ ± 6.29×10⁴ counts/s/mm2 at 48 h p.i.; Figure 5A) was only slightly lower than that based on ex vivo NIRF imaging (2.00×10⁵ ± 4.97×10⁴ counts/s/mm2 at 48 h p.i.; Figure 5D), which confirmed that imaging in the NIR window was suitable for superficial tissues/tumors. Linear correlation between the ex vivo NIRF data and PET %ID/g values, using a total of 9 data points (4T1 tumor uptake at 48 h p.i. for all three groups of mice), gave a statistically significant (P = 0.0012) linear correlation with an correlation coefficient of 0.89 (Figure 5E). Although the number of data points is smaller than that used for in vivo correlation (9 vs. 27), a significantly higher correlation coefficient suggests that ex vivo quantification of NIRF signal is more accurate than non-invasive quantification, due to lack of mouse skin autofluorescence and absorption/scattering of the fluorescence signal.
Biodistribution data at 48 h p.i. showed that 4T1 tumor uptake of 89Zr-Df-TRC105-800CW was higher than that of all organs in mice, thereby providing excellent contrast with a tumor/muscle ratio of 28.7 ± 4.2 (n = 3). Pre-injection of a blocking dose of TRC105 led to a significant decrease in 4T1 tumor uptake of 89Zr-Df-TRC105-800CW (P < 0.05; n = 3; Figure 6A), corroborating the in vivo PET findings. A comparison of the biodistribution data between the two tracers revealed that uptake of 89Zr-Df-cetuximab-800CW was higher than or similar to 89Zr-Df-TRC105-800CW in most organs except the 4T1 tumor (Figure 6B), where significantly higher uptake was observed for 89Zr-Df-TRC105-800CW due to CD105 binding (P < 0.05; n = 3). Overall, the quantification results obtained from biodistribution studies and PET scans matched very well, confirming that quantitative ROI analysis of non-invasive PET scans reflected tracer distribution in vivo.
Figure 6.
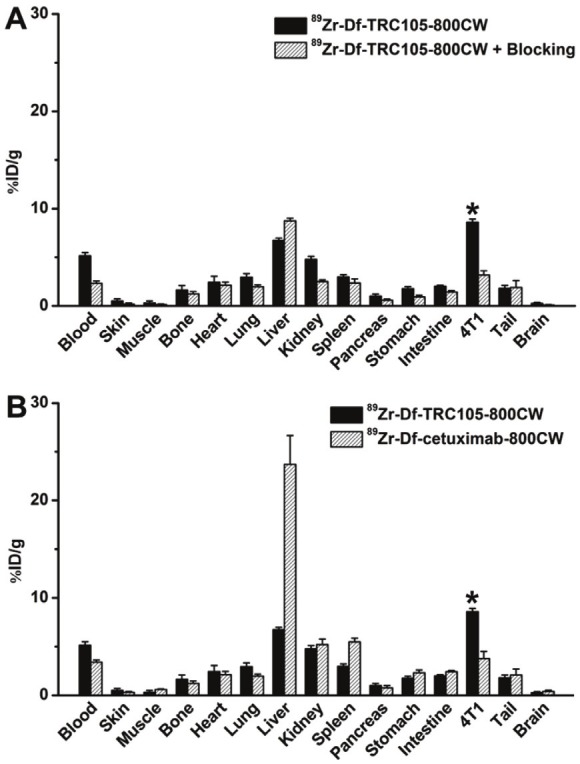
Biodistribution data at 48 h post-injection of each tracer. *: P < 0.05 (n = 3).
Histology
CD105/CD31 co-staining of various tissues revealed that CD105 expression in the 4T1 tumor was primarily on the tumor vasculature, as evidenced by excellent co-localization of CD105 and CD31 staining and little to no observable signal on the 4T1 tumor cells (Figure 7). CD105 is only expressed on actively proliferating endothelial cells, thus mature vessels (arrowheads in Figure 7) have significantly lower CD105 expression than the neovasculature in breast tumors. Since tumor vasculature is more actively proliferating in the peripheral region that in the center, tumor uptake of 89Zr-Df-TRC105-800CW is higher in the peripheral region than the tumor center (Figure 3A).
Figure 7.

Immunofluorescence CD105/CD31 double-staining of the 4T1 tumor, liver, and spleen tissue sections. TRC105 and AlexaFluor488-labeled goat anti-human IgG were used for CD105 staining (green). Afterwards, the tissue slices were stained with rat anti-mouse CD31 antibody and Cy3-labeled donkey anti-rat IgG (red). CD105 expression was high on newly formed blood vessels but not on mature vessels in the tumor, which exhibited predominantly CD31 staining (arrowheads). CD105 expression levels in the liver and spleen are much lower than in the tumor vessels. All images were acquired under the same condition and displayed at the same scale. Magnification: 200×.
CD105 staining of mouse liver and spleen both revealed very low signals, indicating that these tissues do not express significant CD105. Thus, uptake of 89Zr-Df-TRC105-800CW in the liver was largely unrelated to CD105 binding and more likely attributed to non-specific capture by the reticuloendothelial system (RES) and hepatic clearance of the tracer. Taken together, the ex vivo findings corroborated the in vivo data of 89Zr-Df-TRC105-800CW, warranting further investigation and applications of this tracer.
Discussion
The goal of this study was to develop a CD105-specific agent for both PET and NIRF imaging, which not only can provide complementary information through the two imaging techniques, but also have potential clinical applications in many scenarios including the diagnosis and imaged-guided surgery of breast cancer. The currently accepted standard method for quantifying angiogenesis is to assess microvessel density (MVD) by performing CD105 immunohistochemistry on tumor tissue, which is an independent prognostic factor for survival in patients with many types of solid tumors [10,11]. Based on this, a non-invasive whole-body measurement of MVD by PET imaging of CD105 expression has tremendous clinical potential in disease diagnosis, anti-angiogenic drug development, clinical trials, and ultimately in the day-to-day management of cancer patients.
We have achieved our goal of demonstrating prominent tracer uptake in angiogenic tumor vessels. Two cell lines were used: HUVECs (high CD105 expression) and 4T1 murine breast cancer cells (CD105-negative). Both cells were used for in vitro characterization of Df-TRC105-800CW to confirm its CD105-binding specificity/affinity. The 4T1 tumor grows rapidly when inoculated into host mice and thus has a highly angiogenic tumor vasculature suitable for imaging studies (Figure 7). Since the tumor volume nearly doubled at 72 h p.i., we chose to investigate the tracer in vivo until 48 h p.i to minimize the interference in tumor uptake from significant tumor size increases.
One limitation of this 4T1 breast cancer model is that the tumor vasculature is of murine origin. TRC105 has significantly higher affinity to human CD105 than its murine homolog [47]. Thus, the 4T1 tumor model is not optimal for testing TRC105. When compared with other antibody-based PET tracers [45,48], tumor uptake in this study is relatively low (~12 %ID/g at the peak). Also, it is noteworthy that 89Zr-Df-TRC105-800CW targets the tumor vasculature only and not the 4T1 tumor cells. There are significantly fewer tumor vascular endothelial cells than tumor cells in a tumor mass, and tumor cells are the targets of most antibodies used for cancer imaging.
89Zr-labeling of mAbs was usually achieved through various types of chelators, with Df been the most widely used [49,50]. However, the multi-step procedure reported in early studies of 89Zr-labeled mAbs is quite complicated and time-consuming, which makes it challenging to produce 89Zr-labeled mAbs in compliance with current Good Manufacturing Practice (cGMP) for potential clinical investigation. The recent commercial availability of Df-Bz-NCS has significant facilitated the development of 89Zr-based PET tracers, which only requires a simple 2-step procedure [34]. Df has been safely used as a chelator in the clinic for many years. In the past and ongoing clinical studies, neither adverse reactions nor significant changes in blood and urine values were observed after injection of Df-containing conjugates [20,30]. In addition, no antibody responses directed against the Df chelate were observed, indicating that its immunogenicity is very low [51].
One key challenge in antibody labeling is to minimize the potential interference with its antigen binding affinity/specificity. There is only one lysine residue in each of the complementarity determining regions (CDRs) of TRC105 [11], which has a total of ~1400 amino acid residues and ~70 lysines, thus the possibility of Df or 800CW conjugation at the lysine residue within the CDR is extremely low. The conjugation of less than 1 Df and 800CW per TRC105 molecule adequately avoided alteration of the immunoreactivity (and pharmacokinetics) of TRC105, which was confirmed by FACS analysis at serial non-antigen-saturating conditions (Figure 2). To confirm that the tumor uptake of 89Zr-Df-TRC105-800CW visualized by non-invasive PET/NIRF imaging was indeed CD105 specific, various control experiments (e.g. blocking study and the use of cetuximab as an isotype-matched control), in vitro/ex vivo studies (e.g. FACS and histological studies), as well as ex vivo PET/NIRF imaging were all performed for validation purposes.
The experimental setup in this study represents the “best-case scenario” for optical imaging in that: 1) the emission maximum of 800CW is 806 nm, which is in the optically clear NIR window; 2) the tumors were subcutaneously inoculated, thus tissue penetration is not a major issue; 3) the use of laser excitation gives stronger signal than other excitation sources; and 4) mouse hair was removed before NIRF imaging and the skin color of the mouse is very light. The statistically significant correlation between the in vivo/ex vivo NIRF signal and PET-based %ID/g values indicated that imaging in the NIR window can provide (semi-)quantitative information for subcutaneous tumors/tissues of light color, with ex vivo quantification of the NIRF signal being more accurate than in vivo quantification (Figure 5B, E). The accuracy of quantification was much lower for deeper tissues of darker color, as was seen for the liver in both in vivo and ex vivo NIRF imaging. (i.e. only weak fluorescence signal was observed in the liver even in the NIR window, despite that liver uptake of 89Zr-Df-TRC105-800CW and 89Zr-Df-cetuximab-800CW were both prominent based on PET; Figure 3, 5C). In clinical settings, NIRF imaging can be used for imaging tissues close to the surface of the skin (e.g. breast imaging), tissues accessible by endoscopy (such as within the esophagus and colon), and intraoperative visualization (typically image-guided surgery).
For future investigation, the following strategies may be adopted to better mimic the clinical situation and further improve the tumor uptake/contrast: use of transgenic mice whose vasculature expresses human CD105, or use of a mAb that binds murine CD105 with high affinity. In addition, studies have shown that tumor uptake of certain antibody-based PET tracers increased significantly when the specific activity of the tracer increases [52]. Therefore, with further improvement in the specific activity of 89Zr and optimization of the radiochemistry, tumor uptake of 89Zr-Df-TRC105-800CW in the 4T1 model may be further improved in future studies. Nevertheless, excellent tumor contrast was achieved in this study, and it is expected that this tracer will perform better in cancer patients (who express human CD105 in the tumor vasculature) than in the murine model used here.
Conclusion
Herein we report dual-modality PET and NIRF imaging of CD105 expression during tumor angiogenesis in a breast cancer model by labeling TRC105 with both 89Zr and a NIRF dye. In vivo and ex vivo PET/NIRF imaging revealed rapid, persistent, and CD105-specific uptake of 89Zr-Df-TRC105-800CW in the 4T1 tumor, which was further validated by various in vitro, in vivo, and ex vivo experiments. Tumor uptake based on ROI analysis of in vivo and ex vivo NIRF images both exhibited a linear correlation with the tumor %ID/g values obtained with PET, confirming that imaging in the NIR window in small animal models can give semi-quantitative to quantitative information in superficial (tumor) tissue of light color. Upon further optimization and development, such dual-labeled PET/NIRF agents can be translated into the clinic for both disease diagnosis and image-guided surgery, not only in breast cancer but also other solid tumors types.
Acknowledgments
This work is supported, in part, by the University of Wisconsin Carbone Cancer Center, the Department of Defense (W81XWH-11-1-0644 and W81XWH-11-1-0648), NCRR 1UL1RR025011, and the NIH through the UW Radiological Sciences Training Program 5 T32 CA009206-32.
References
- 1.Hanahan D, Weinberg RA. Hallmarks of cancer: the next generation. Cell. 2011;144:646–674. doi: 10.1016/j.cell.2011.02.013. [DOI] [PubMed] [Google Scholar]
- 2.Cai W, Chen X. Multimodality molecular imaging of tumor angiogenesis. J Nucl Med. 2008;49(Suppl 2):113S–128S. doi: 10.2967/jnumed.107.045922. [DOI] [PubMed] [Google Scholar]
- 3.Beer AJ, Schwaiger M. Imaging of integrin avb3 expression. Cancer Metastasis Rev. 2008;27:631–644. doi: 10.1007/s10555-008-9158-3. [DOI] [PubMed] [Google Scholar]
- 4.Cai W, Chen X. Multimodality imaging of vascular endothelial growth factor and vascular endothelial growth factor receptor expression. Front Biosci. 2007;12:4267–4279. doi: 10.2741/2386. [DOI] [PubMed] [Google Scholar]
- 5.Cai W, Niu G, Chen X. Imaging of integrins as biomarkers for tumor angiogenesis. Curr Pharm Des. 2008;14:2943–2973. doi: 10.2174/138161208786404308. [DOI] [PubMed] [Google Scholar]
- 6.Dijkgraaf I, Boerman OC. Radionuclide imaging of tumor angiogenesis. Cancer Biother Radiopharm. 2009;24:637–647. doi: 10.1089/cbr.2009.0694. [DOI] [PubMed] [Google Scholar]
- 7.Cai W, Hong H. Peptoid and positron emission tomography: an appealing combination. Am J Nucl Med Mol Imaging. 2011;1:76–79. [PMC free article] [PubMed] [Google Scholar]
- 8.Hao G, Hajibeigi A, De León-Rodríguez LM, Öz OK, Sun X. Peptoid-based PET imaging of vascular endothelial growth factor receptor (VEGFR) expression. Am J Nucl Med Mol Imaging. 2011;1:65–75. [PMC free article] [PubMed] [Google Scholar]
- 9.Dallas NA, Samuel S, Xia L, Fan F, Gray MJ, Lim SJ, Ellis LM. Endoglin (CD105): a marker of tumor vasculature and potential target for therapy. Clin Cancer Res. 2008;14:1931–1937. doi: 10.1158/1078-0432.CCR-07-4478. [DOI] [PubMed] [Google Scholar]
- 10.Fonsatti E, Nicolay HJ, Altomonte M, Covre A, Maio M. Targeting cancer vasculature via endoglin/CD105: a novel antibody-based diagnostic and therapeutic strategy in solid tumours. Cardiovasc Res. 2010;86:12–19. doi: 10.1093/cvr/cvp332. [DOI] [PubMed] [Google Scholar]
- 11.Seon BK, Haba A, Matsuno F, Takahashi N, Tsujie M, She X, Harada N, Uneda S, Tsujie T, Toi H, Tsai H, Haruta Y. Endoglin-targeted cancer therapy. Curr Drug Deliv. 2011;8:135–143. doi: 10.2174/156720111793663570. [DOI] [PMC free article] [PubMed] [Google Scholar]
- 12.Dales JP, Garcia S, Carpentier S, Andrac L, Ramuz O, Lavaut MN, Allasia C, Bonnier P, Taranger-Charpin C. Prediction of metastasis risk (11 year follow-up) using VEGF-R1, VEGF-R2, Tie-2/Tek and CD105 expression in breast cancer (n=905) Br J Cancer. 2004;90:1216–1221. doi: 10.1038/sj.bjc.6601452. [DOI] [PMC free article] [PubMed] [Google Scholar]
- 13.Zhang D, Feng XY, Henning TD, Wen L, Lu WY, Pan H, Wu X, Zou LG. MR imaging of tumor angiogenesis using sterically stabilized Gd-DTPA liposomes targeted to CD105. Eur J Radiol. 2009;70:180–189. doi: 10.1016/j.ejrad.2008.04.022. [DOI] [PubMed] [Google Scholar]
- 14.Bredow S, Lewin M, Hofmann B, Marecos E, Weissleder R. Imaging of tumour neovasculature by targeting the TGF-beta binding receptor endoglin. Eur J Cancer. 2000;36:675–681. doi: 10.1016/s0959-8049(99)00335-4. [DOI] [PubMed] [Google Scholar]
- 15.Costello B, Li C, Duff S, Butterworth D, Khan A, Perkins M, Owens S, Al-Mowallad AF, O'Dwyer S, Kumar S. Perfusion of 99mTc-labeled CD105 Mab into kidneys from patients with renal carcinoma suggests that CD105 is a promising vascular target. Int J Cancer. 2004;109:436–441. doi: 10.1002/ijc.11699. [DOI] [PubMed] [Google Scholar]
- 16.Fonsatti E, Jekunen AP, Kairemo KJ, Coral S, Snellman M, Nicotra MR, Natali PG, Altomonte M, Maio M. Endoglin is a suitable target for efficient imaging of solid tumors: in vivo evidence in a canine mammary carcinoma model. Clin Cancer Res. 2000;6:2037–2043. [PubMed] [Google Scholar]
- 17.Korpanty G, Carbon JG, Grayburn PA, Fleming JB, Brekken RA. Monitoring response to anticancer therapy by targeting microbubbles to tumor vasculature. Clin Cancer Res. 2007;13:323–330. doi: 10.1158/1078-0432.CCR-06-1313. [DOI] [PubMed] [Google Scholar]
- 18.Korpanty G, Grayburn PA, Shohet RV, Brekken RA. Targeting vascular endothelium with avidin microbubbles. Ultrasound Med Biol. 2005;31:1279–1283. doi: 10.1016/j.ultrasmedbio.2005.06.001. [DOI] [PubMed] [Google Scholar]
- 19.Hong H, Yang Y, Zhang Y, Engle JW, Barnhart TE, Nickles RJ, Leigh BR, Cai W. Positron emission tomography imaging of CD105 expression during tumor angiogenesis. Eur J Nucl Med Mol Imaging. 2011;38:1335–1343. doi: 10.1007/s00259-011-1765-5. [DOI] [PMC free article] [PubMed] [Google Scholar]
- 20.Zhang Y, Hong H, Cai W. PET tracers based on Zirconium-89. Curr Radiopharm. 2011;4:131–139. doi: 10.2174/1874471011104020131. [DOI] [PMC free article] [PubMed] [Google Scholar]
- 21.Hong H, Severin GW, Yang Y, Engle JW, Zhang Y, Barnhart TE, Liu G, Leigh BR, Nickles RJ, Cai W. Positron emission tomography imaging of CD105 expression with 89Zr-Df-TRC105. Eur J Nucl Med Mol Imaging. 2012;39:138–148. doi: 10.1007/s00259-011-1930-x. [DOI] [PMC free article] [PubMed] [Google Scholar]
- 22.Zhang Y, Hong H, Engle JW, Bean J, Yang Y, Leigh BR, Barnhart TE, Cai W. Positron emission tomography imaging of CD105 expression with a 64Cu-labeled monoclonal antibody: NOTA is superior to DOTA. PLoS One. 2011;6:e28005. doi: 10.1371/journal.pone.0028005. [DOI] [PMC free article] [PubMed] [Google Scholar]
- 23.Yang Y, Zhang Y, Hong H, Liu G, Leigh BR, Cai W. In vivo near-infrared fluorescence imaging of CD105 expression. Eur J Nucl Med Mol Imaging. 2011;38:2066–2076. doi: 10.1007/s00259-011-1886-x. [DOI] [PMC free article] [PubMed] [Google Scholar]
- 24.Eary JF, Hawkins DS, Rodler ET, Conrad EUI. 18F-FDG PET in sarcoma treatment response imaging. Am J Nucl Med Mol Imaging. 2011;1:47–53. [PMC free article] [PubMed] [Google Scholar]
- 25.Gambhir SS, Czernin J, Schwimmer J, Silverman DH, Coleman RE, Phelps ME. A tabulated summary of the FDG PET literature. J Nucl Med. 2001;42:1S–93S. [PubMed] [Google Scholar]
- 26.Iagaru A. 18F-FDG PET/CT: timing for evaluation of response to therapy remains a clinical challenge. Am J Nucl Med Mol Imaging. 2011;1:63–64. [PMC free article] [PubMed] [Google Scholar]
- 27.Grassi I, Nanni C, Allegri V, Morigi JJ, Montini GC, Castellucci P, Fanti S. The clinical use of PET with 11C-acetate. Am J Nucl Med Mol Imaging. 2012;2:33–47. [PMC free article] [PubMed] [Google Scholar]
- 28.Alauddin MM. Positron emission tomography (PET) imaging with 18F-based radiotracers. Am J Nucl Med Mol Imaging. 2012;2:55–76. [PMC free article] [PubMed] [Google Scholar]
- 29.Vach W, Høilund-Carlsen PF, Fischer BM, Gerke O, Weber W. How to study optimal timing of PET/CT for monitoring of cancer treatment. Am J Nucl Med Mol Imaging. 2011;1:54–62. [PMC free article] [PubMed] [Google Scholar]
- 30.van Dongen GA, Vosjan MJ. Immuno-positron emission tomography: shedding light on clinical antibody therapy. Cancer Biother Radiopharm. 2010;25:375–385. doi: 10.1089/cbr.2010.0812. [DOI] [PubMed] [Google Scholar]
- 31.Holland JP, Sheh Y, Lewis JS. Standardized methods for the production of high specific-activity zirconium-89. Nucl Med Biol. 2009;36:729–739. doi: 10.1016/j.nucmedbio.2009.05.007. [DOI] [PMC free article] [PubMed] [Google Scholar]
- 32.Wadas TJ, Wong EH, Weisman GR, Anderson CJ. Coordinating radiometals of copper, gallium, indium, yttrium, and zirconium for PET and SPECT imaging of disease. Chem Rev. 2010;110:2858–2902. doi: 10.1021/cr900325h. [DOI] [PMC free article] [PubMed] [Google Scholar]
- 33.Dijkers EC, Oude Munnink TH, Kosterink JG, Brouwers AH, Jager PL, de Jong JR, van Dongen GA, Schroder CP, Lub-de Hooge MN, de Vries EG. Biodistribution of 89Zr-trastuzumab and PET imaging of HER2-positive lesions in patients with metastatic breast cancer. Clin Pharmacol Ther. 2010;87:586–592. doi: 10.1038/clpt.2010.12. [DOI] [PubMed] [Google Scholar]
- 34.Perk LR, Vosjan MJ, Visser GW, Budde M, Jurek P, Kiefer GE, van Dongen GA. p-Isothiocyanatobenzyl-desferrioxamine: a new bifunctional chelate for facile radiolabeling of monoclonal antibodies with zirconium-89 for immuno-PET imaging. Eur J Nucl Med Mol Imaging. 2010;37:250–259. doi: 10.1007/s00259-009-1263-1. [DOI] [PMC free article] [PubMed] [Google Scholar]
- 35.James ML, Gambhir SS. A molecular imaging primer: modalities, imaging agents, and applications. Physiol Rev. 2012;92:897–965. doi: 10.1152/physrev.00049.2010. [DOI] [PubMed] [Google Scholar]
- 36.Cai W, Hong H. In a “nutshell”: intrinsically radio-labeled quantum dots. Am J Nucl Med Mol Imaging. 2012;2:136–140. [PMC free article] [PubMed] [Google Scholar]
- 37.Thorek DLJ, Robertson R, Bacchus WA, Hahn J, Rothberg J, Beattie BJ, Grimm J. Cerenkov imaging - a new modality for molecular imaging. Am J Nucl Med Mol Imaging. 2012;2:163–173. [PMC free article] [PubMed] [Google Scholar]
- 38.Zeman MN, Scott PJH. Current imaging strategies in rheumatoid arthritis. Am J Nucl Med Mol Imaging. 2012;2:174–220. [PMC free article] [PubMed] [Google Scholar]
- 39.Zhang Y, Cai W. Molecular imaging of insulin-like growth factor 1 receptor in cancer. Am J Nucl Med Mol Imaging. 2012;2:248–259. [PMC free article] [PubMed] [Google Scholar]
- 40.Zhang Y, Hong H, Engle JW, Yang Y, Barnhart TE, Cai W. Positron emission tomography and near-infrared fluorescence imaging of vascular endothelial growth factor with dual-labeled bevacizumab. Am J Nucl Med Mol Imaging. 2012;2:1–13. [PMC free article] [PubMed] [Google Scholar]
- 41.Cai W, Hsu AR, Li ZB, Chen X. Are quantum dots ready for in vivo imaging in human subjects? Nanoscale Res Lett. 2007;2:265–281. doi: 10.1007/s11671-007-9061-9. [DOI] [PMC free article] [PubMed] [Google Scholar]
- 42.Mendelson DS, Gordon MS, Rosen LS, Hurwitz H, Wong MK, Adams BJ, Alvarez D, Seon BK, Theuer CP, Leigh BR. Phase I study of TRC105 (anti-CD105 [endoglin] antibody) therapy in patients with advanced refractory cancer. J. Clin. Oncol. 2010;28:15s. [Google Scholar]
- 43.Wang H, Cai W, Chen K, Li ZB, Kashefi A, He L, Chen X. A new PET tracer specific for vascular endothelial growth factor receptor 2. Eur J Nucl Med Mol Imaging. 2007;34:2001–2010. doi: 10.1007/s00259-007-0524-0. [DOI] [PubMed] [Google Scholar]
- 44.Takahashi N, Haba A, Matsuno F, Seon BK. Antiangiogenic therapy of established tumors in human skin/severe combined immunodeficiency mouse chimeras by anti-endoglin (CD105) monoclonal antibodies, and synergy between anti-endoglin antibody and cyclophosphamide. Cancer Res. 2001;61:7846–7854. [PubMed] [Google Scholar]
- 45.Cai W, Wu Y, Chen K, Cao Q, Tice DA, Chen X. In vitro and in vivo characterization of 64Cu-labeled AbegrinTM, a humanized monoclonal antibody against integrin avb3 . Cancer Res. 2006;66:9673–9681. doi: 10.1158/0008-5472.CAN-06-1480. [DOI] [PubMed] [Google Scholar]
- 46.Cai W, Chen K, Mohamedali KA, Cao Q, Gambhir SS, Rosenblum MG, Chen X. PET of vascular endothelial growth factor receptor expression. J Nucl Med. 2006;47:2048–2056. [PubMed] [Google Scholar]
- 47.Matsuno F, Haruta Y, Kondo M, Tsai H, Barcos M, Seon BK. Induction of lasting complete regression of preformed distinct solid tumors by targeting the tumor vasculature using two new anti-endoglin monoclonal antibodies. Clin Cancer Res. 1999;5:371–382. [PubMed] [Google Scholar]
- 48.Cai W, Ebrahimnejad A, Chen K, Cao Q, Li ZB, Tice DA, Chen X. Quantitative radioimmunoPET imaging of EphA2 in tumor-bearing mice. Eur J Nucl Med Mol Imaging. 2007;34:2024–2036. doi: 10.1007/s00259-007-0503-5. [DOI] [PubMed] [Google Scholar]
- 49.Meijs WE, Herscheid JDM, Haisma HJ, Pinedo HM. Evaluation of desferal as a bifunctional chelating agent for labeling antibodies with Zr-89. Int J Radiat Appl Instrum, A, Appl Radiat Isot. 1992;43:1443–1447. doi: 10.1016/0883-2889(92)90170-j. [DOI] [PubMed] [Google Scholar]
- 50.Vosjan MJ, Perk LR, Visser GW, Budde M, Jurek P, Kiefer GE, van Dongen GA. Conjugation and radiolabeling of monoclonal antibodies with zirconium-89 for PET imaging using the bifunctional chelate p-isothiocyanatobenzyl-desferrioxamine. Nat Protoc. 2010;5:739–743. doi: 10.1038/nprot.2010.13. [DOI] [PubMed] [Google Scholar]
- 51.Borjesson PK, Jauw YW, Boellaard R, de Bree R, Comans EF, Roos JC, Castelijns JA, Vosjan MJ, Kummer JA, Leemans CR, Lammertsma AA, van Dongen GA. Performance of immuno-positron emission tomography with zirconium-89-labeled chimeric monoclonal antibody U36 in the detection of lymph node metastases in head and neck cancer patients. Clin Cancer Res. 2006;12:2133–2140. doi: 10.1158/1078-0432.CCR-05-2137. [DOI] [PubMed] [Google Scholar]
- 52.Heskamp S, van Laarhoven HW, Molkenboer-Kuenen JD, Franssen GM, Versleijen-Jonkers YM, Oyen WJ, van der Graaf WT, Boerman OC. ImmunoSPECT and immunoPET of IGF-1R expression with the radiolabeled antibody R1507 in a triple-negative breast cancer model. J Nucl Med. 2010;51:1565–1572. doi: 10.2967/jnumed.110.075648. [DOI] [PubMed] [Google Scholar]