

Abstract
Difficulty interpreting facial expressions has been reported in autism spectrum disorders (ASD) and is thought to be associated with amygdala abnormalities. To further explore the neural basis of abnormal emotional face processing in ASD, we conducted an fMRI study of emotional face matching in high-functioning adults with ASD and age, IQ, and gender matched controls. In addition, we investigated whether there was a relationship between self-reported social anxiety and fMRI activation. During fMRI scanning, study participants were instructed to match facial expressions depicting fear or anger. The control condition was a comparable shape - matching task. The control group evidenced significantly increased left prefrontal activation and decreased activation in the occipital lobes compared to the ASD group during emotional face matching. Further, within the ASD group, greater social anxiety was associated with increased activation in right amygdala and left middle temporal gyrus, and decreased activation in the fusiform face area. These results indicate that level of social anxiety mediates the neural response to emotional face perception in ASD.
Keywords: Autism, Asperger’s disorder, amygdala, anxiety, emotional face processing, fusiform face area
The social motivation theory of autism (Dawson, Webb, & McPartland, 2005) posits that social dysfunction stems from a failure of individuals with autism to find faces rewarding, resulting in a lack of experience with faces during critical developmental periods. The etiological mechanism for this reduced drive to interact with people or look at faces is poorly understood. However, several lines of evidence suggest that the amygdala may be critically involved in the pathophysiology of autism, based upon observations of the amygdala’s role in social behavior and structural and functional abnormalities of the amygdala in ASD (Baron-Cohen et al., 2000). One component of social dysfunction in ASD is atypical processing of emotions associated with facial expressions (Ashwin, Chapman, Colle, & Baron-Cohen, 2006). Functional imaging studies have identified links between these emotional processing deficits in ASD and the underlying neural defects. For example, abnormal amygdala activation has been reported in response to emotional face processing (Ashwin, Baron-Cohen, Wheelwright, O’Riordan, & Bullmore, 2006; Critchley et al., 2000; Monk et al., 2010), emotional discrimination (Dalton et al., 2005), and emotional attribution (Wang, Dapretto, Hariri, Sigman, & Bookheimer, 2004). However, both abnormally increased and decreased amygdala activation has been found.
These opposing imaging findings may indicate that social dysfunction in ASD may be related to different underlying clinical characteristics. Schultz (2005) and others have proposed that the degree to which faces are “emotionally salient” may help explain the social deficits seen in individuals with ASD. In considering these conflicting findings, it is possible that social dysfunction may develop through different internal experiences. Specifically, for some individuals, faces may lack sufficient emotional salience resulting in apathy towards social interaction, while for others, faces may be overstimulating, causing overarousal and possibly an aversive reaction. The former case could potentially be associated with amygdala hypoarousal and the latter with amygdala hyperarousal.
The current study builds upon previous work which found that amygdala activation was related to amount of time fixating on the eyes in ASD (Dalton et al., 2005) and increased amygdala activation was theoretically linked to heighten emotional arousal in response to faces. However, the relationship between fMRI amygdala activation and psychological or physiological measures has not been tested. We focused on anxiety as an index of emotional arousal because anxiety is common in children with ASD (White, Oswald, Ollendick, & Scahill, 2009), with social anxiety disorder present in approximately 29% of ASD patients (Simonoff et al., 2008). ASD participants with higher levels of social anxiety were predicted to exhibit higher levels of amygdala activation based on previous reports increased amygdala activation in individuals with anxiety disorders (Shin & Liberzon, 2009). Group-differences in emotional face matching were also tested to facilitate comparisons to previous studies (Piggot et al., 2004; Wang et al., 2004). We predicted that the ASD group would exhibit reduced activation in the prefrontal cortex based on previous reports of structural and functional abnormalities in the frontal lobes (see e.g., Bookheimer, Wang, Scott, Sigman, & Dapretto, 2008; Casanova, Buxhoeveden, Switala, & Roy, 2002; Kleinhans, Schweinsburg, Cohen, Muller, & Courchesne, 2007; Vargas, Nascimbene, Krishnan, Zimmerman, & Pardo, 2005; Zilbovicius et al., 1995) and increased activation in the occipital lobes (Belmonte & Yurgelun-Todd, 2003; Gaffrey et al., 2007; Hubl et al., 2003; Koshino et al., 2005; Muller, Kleinhans, Kemmotsu, Pierce, & Courchesne, 2003), but no significant difference in amygdala activation (see e.g., Kleinhans et al., 2008; Piggot et al., 2004; Wang et al., 2004). Further, we did not predict any significant group differences in the fusiform or temporal lobes because our task ensured that participants were attending to the stimuli and our previous study of neutral face processing in ASD did not find any differences in these brain regions (Kleinhans et al., 2008). Although reduced fusiform face area (FFA) activation has been attributed to reduced sensitivity and/or reduced experience with faces in ASD, it is important to note that atypical eye-gaze patterns result in reduced fusiform activation in non-affected individuals as well (Morris, Pelphrey, & McCarthy, 2007). Thus, our hypothesis is consistent with work by Hadjikhani et al (2004; 2006) and others who emphasize that reduced fusiform activation in ASD may be secondary to differences in visual attention to face stimuli, and that it appears possible to elicit normal levels of fusiform activation in individuals with ASD through experimental manipulations (Hadjikhani et al., 2004; Hadjikhani et al., 2006; Pierce, Haist, Sedaghat, & Courchesne, 2004; Pierce & Redcay, 2008).
METHODS
Participants
Thirty-one adults with ASD (2 women, 29 men) and 25 (2 women, 23 men) controls participated. Two individuals with ASD were excluded for excessive motion. All had FSIQ and VIQ ≥ 80. Diagnoses were confirmed with the Autism Diagnostic Interview-Revised (ADI-R, Lord, Rutter, & Le Couteur, 1994), the Autism Diagnostic Observation Schedule (ADOS, Lord et al., 2000), and DSM-IV criteria. The ASD and control groups did not significantly differ on age or IQ. One ASD participant and 4 control participants were left-handed. All other participants were right-handed. Handedness was determined by self-report. All participants completed the Social Avoidance and Distress Scale (SADS, Watson & Friend, 1969). Clinical and demographic information is reported in Table 1. Control participants were excluded for current and past psychiatric disorders, history of a developmental learning disability, and contraindications to MR imaging.
Table 1.
Participant charateristics
| ASD (n=29) | Control (n = 25) | p value | |||
|---|---|---|---|---|---|
| Mean | (SD) | Mean | (SD) | ||
| Age | 23.57 | (6.60) | 23.32 | (5.15) | .90 |
| Full scale IQ | 111.03 | (16.05) | 112.92 | (12.29) | .63 |
| Verbal IQ | 110.52 | (16.41) | 111.64 | (11.61) | .78 |
| Performance IQ | 108.93 | (16.48) | 111.16 | (14.10) | .60 |
| SADS | 15.83 | (7.44) | 2.52 | (4.17) | .00 |
| ADOS subscales | |||||
| Communication | 3.66 | (1.29) | |||
| Social | 8.59 | (2.80) | |||
| ADI-R subscales | |||||
| Communication | 13.79 | (5.11) | |||
| Social | 17.14 | (5.44) | |||
| Repetitive behavior | 5.62 | (2.78) | |||
Note. SADS = Social Avoidance and Distress Scale, ADOS = Autism Diagnostic Observation Schedule ADI-R = Autism Diagnostic Interview - Revised
This study was approved by the University of Washington Human Subjects Institutional Review Board. Informed written consent was obtained from all study participants.
fMRI Data Acquisition
Scanning was performed on a 1.5T Signa MR imaging system (General Electric, Waukesha). The fMRI echo-planar pulse sequence was (TR/TE 3000/30msec, 21 slices; 6mm thick with 1mm gap, 64×64 matrix, 68 volumes total). An MPRAGE scan was also collected (TR= 33 milliseconds, TE= minimum, flip angle =30°, field of view =24 cm, 256 × 256 matrix, scan thickness =1.5 mm, acquisition plane= coronal plane).
fMRI task
The participants viewed pictures of emotional faces and geometric shapes in a block-design format. Face stimuli were 24 men and women depicting anger or fear (Ekman, Friesen, & 1976). Shape stimuli were various round objects. Each block contained six images presented for 4.5 s with a 500 ms interstimulus interval. The experiment included emotional face (E) blocks, shape blocks (S), and instruction blocks (I). The experimental paradigm was: ISIEISIEISIE. The instruction blocks stated either “match shapes” or “match emotions.” In the emotional face blocks, a target face (angry or fearful) was presented at the top of the screen and two faces, one angry and one fearful, were positioned next to each other at the bottom of the screen. The participants were instructed to press the button that corresponded to matching face. The instructions were identical for the shape blocks.
fMRI Processing and Statistical Analysis
Data were analyzed using the FMRIB Software Library version 3.3 (FSL; http://www.fmrib.ox.ac.uk/fsl/). The following steps were applied: first three volumes were discarded; volumes were registered with MCFLIRT; nonbrain structures were removed using BET; data were spatially smoothed at FWHM 5 mm and temporally smoothed using a high-pass filter sigma = 60 s. Time series analyses were conducted using FMRIB’s Improved Linear Model. FMRI data were registered to the SPGR then warped to the MNI152 standard image using FMRIB’s Linear Image Registration Tool.
Group-wise effects were tested using FMRIB’s Local Analysis of Mixed Effects. Nine a-priori regions of interest (ROI) were tested separately for the contrast emotion matching > shape matching. The brain regions included R/L amygdala; R/L lateral fusiform gyrus; R/L inferior frontal gyrus; R/L temporal lobe (superior and middle gyri) and the occipital lobe. The relationship between emotional face processing and social anxiety was tested by entering the SADS as a variable. Corrections for multiple comparisons were conducted using cluster-thresholding based on Markov Chain Monte Carlo sampling for each ROI. The occipital cortex, inferior frontal gyrus, and temporal lobe ROIs were defined by Anatomical Automatic Labeling atlas, an in-house package made by Neurofunctional Imaging Group (GIN, UMR6095, CYCERON, Caen, France). The amygdala and fusiform gyrus were hand drawn on the standard template within our laboratory based on atlas images.
RESULTS
fMRI Behavioral Performance
Between-group differences on the fMRI behavioral task were tested using independent samples t-tests. There were no significant between group differences in performance (see Table 2).
Table 2.
fMRI behavioral performance
| ASD (n = 28)* | Control (n = 25) | t value | |||
|---|---|---|---|---|---|
| Mean | (SD) | Mean | (SD) | ||
| Emotion Matching | |||||
| # of errors | 2.29 | 1.536 | 1.88 | 1.054 | 1.11 |
| reaction time (ms) | 2387 | 351 | 2365 | 561 | 0.175 |
| Shape Matching | |||||
| # of errors | 0.36 | 0.62 | 0.20 | 0.58 | 0.95 |
| reaction time (ms) | 1100 | 164 | 1087 | 227 | 0.241 |
one participant’s data were lost due to technical difficulties
fMRI Results
Emotional Faces > Shapes
Both groups showed significant activation in the occipital lobe, bilateral fusiform gyrus, bilateral amygdala, bilateral inferior frontal lobe, and right temporal lobe. The ASD group had significantly increased activation in the occipital lobe and significantly reduced left inferior frontal activation compared to controls (See Table 3).
Table 3.
fMRI activation loci
| p value | No. of voxels | max z | MNI coordinates | |||
|---|---|---|---|---|---|---|
| x (mm) | y (mm) | z (mm) | ||||
| Emotional face matching > shape matching | ||||||
| ASD (N=29) | ||||||
| Occipital (BAs 17,18,19) | .000 | 7843 | 8.03 | −28 | −92 | −6 |
| R fusiform | .000 | 862 | 6.47 | 34 | −70 | −16 |
| L fusiform | .000 | 970 | 6.67 | −36 | −62 | −18 |
| R amygdala | .020 | 48 | 3.4 | 24 | 0 | −16 |
| L amygdala | .011 | 73 | 3.82 | −20 | −6 | −16 |
| R inferior frontal (BAs 9, 46) | .000 | 1883 | 5.62 | 44 | 20 | 22 |
| L inferior frontal (BAs 9, 46) | .000 | 1053 | 5.25 | −38 | 6 | 28 |
| R temporal lobe (BAs 19, 22, 37, 39) | .001 | 475 | 4.07 | 40 | −62 | 18 |
| Control (N=25) | ||||||
| Occipital (BAs 18,19) | .000 | 5712 | 7.76 | 22 | −92 | −10 |
| R fusiform | .000 | 1077 | 6.8 | −40 | −60 | −14 |
| L fusiform | .000 | 953 | 7 | 38 | −52 | −22 |
| R amygdala | .020 | 48 | 3.42 | 18 | −10 | −12 |
| L amygdala | .032 | 30 | 3.88 | −18 | −8 | −14 |
| R inferior frontal (BAs 9, 46, 47) | .000 | 2229 | 6.63 | 52 | 24 | 26 |
| L inferior frontal (BAs 9, 46, 47) | .000 | 2152 | 6.21 | −44 | 20 | 24 |
| R temporal lobe (BAs 19, 22, 37, 39) | .002 | 369 | 3.85 | 52 | −44 | 10 |
| ASD> Control | ||||||
| Occipital (BAs 17, 18, 19) | .000 | 805 | 3.64 | −16 | −64 | 12 |
| Control> ASD | ||||||
| L inferior frontal (BA 46) | .004 | 296 | 3.51 | −44 | 20 | 20 |
| Correlation between emotional face activation and social anxiety | ||||||
| ASD (N=29) | ||||||
| R fusiform (negative) | .049 | 42 | 3.07 | 48 | −48 | −18 |
| R amygdala (positive) | .011 | 8 | 2.75 | 22 | −2 | −16 |
| L temporal lobe (positive; BAs 20, 21) | .011 | 239 | 3.35 | −58 | −32 | −2 |
Note. Data were analyzed using mixed effects and cluster threshold corrected (p < .05, corrected for multiple comparisons).
BA = Brodmann’s area, L = left, R = right, MNI = Montreal Neurological Institute
Correlation between social anxiety and emotional face activation
An inverse correlation was found between the SADS total score and activation in the right FFA in the ASD group. Note that the cluster location is almost identical to the FFA (46,−42,−22) reported in a previous study by our group (Kleinhans et al., 2008). In addition, ASD individuals with higher levels of anxiety showed significantly increased amygdala and left temporal lobe activation to emotional faces (see Table 3 and Figure 2). No significant correlations were found in the control group.
Figure 2.
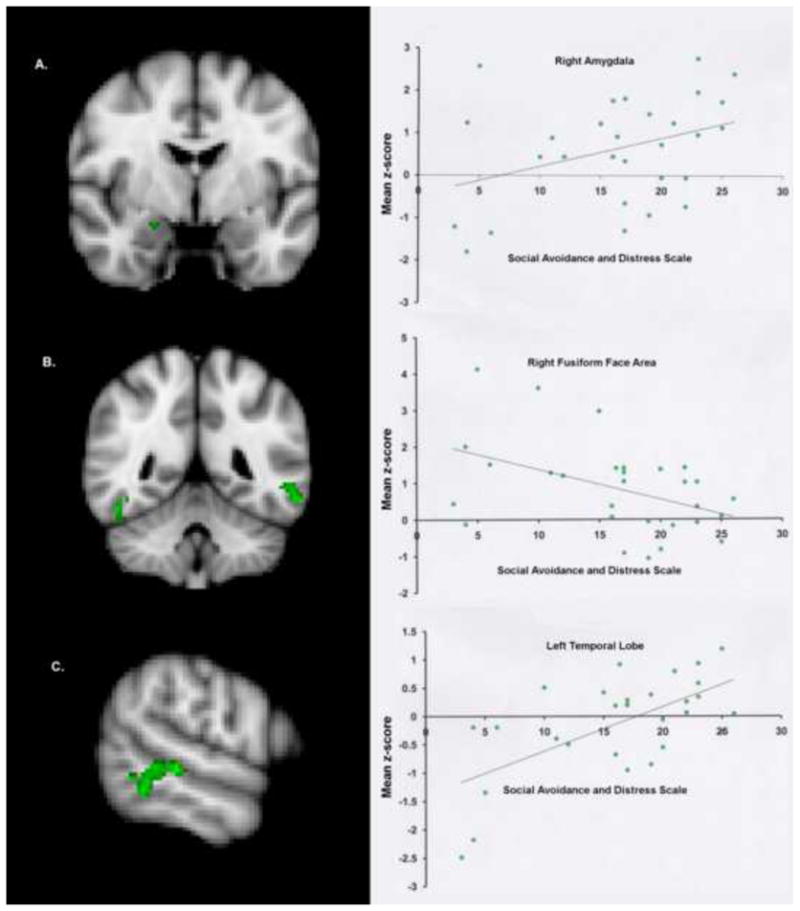
Green clusters signify brain regions showing a significant (p < .05, corrected) correlation between the total score on the Social Anxiety and Distress Scale and activation during the emotional face matching task for the ASD group. Scatter plots are provided for descriptive purposes. For each subject, a mean z-score was obtained by averaging the z-score of all voxels for that participant within the mask, which was defined by significant activation on the group map. Row “A” is the right amygdala cluster (r = .364), row “B” is the right FFA cluster (r = −.450), and row “C” is the left middle temporal gyrus cluster (r = .630). Additional statistical information is provided in Table 3.
DISCUSSION
We investigated the relationship between social anxiety and brain activation during emotional face perception in individuals with ASD using a well validated paradigm of emotion perception matching developed by Hariri et al (2000). The task relies on the ability to match faces according to perceptual features such as a furrowed brow, without requiring explicit judgment or interpretation of facial expressions. The limited demands of this task allowed us to investigate the integrity of the neural circuitry associated with emotional face processing without confounding the results with performance differences.
Previous reports of increased amygdala activation in ASD are suggested to reflect hyperarousal of the brain circuitry involved in processing social stimuli (Dalton et al., 2005) and reduced habituation (Kleinhans et al., 2009). Enhanced amygdala activation is also widely reported in studies of individuals with affective disorders (see, e.g. Beesdo et al., 2009). Given current research indicating high prevalence rates of co-morbid affective disorders in ASD (Mazefsky, Folstein, & Lainhart, 2008), particularly in those individuals with high levels of cognitive functioning (Sterling, Dawson, Estes, & Greenson, 2008), we investigated the relationship between amygdala activation and social anxiety as measured by the SADS (Watson & Friend, 1969). No relationship between social anxiety and brain activation was found in the comparison group. These null findings may be related to the insensitivity of the SADS to anxiety in non-clinical populations, resulting in a restricted range of scores in the control sample. However, as hypothesized, higher levels of social anxiety were associated with greater amygdala activation in the ASD group. This suggests that more anxious ASD individuals have increased sensitivity to emotional faces, which may render interpreting and responding to emotional information from the face more challenging, and result in greater levels of avoidance. Notably, previous studies of social anxiety have observed relationships between fusiform and amygdala activation and anxiety (Pujol et al., 2009), suggesting that this relationship is not specific to autism.
Two additional, unexpected relationships between social anxiety and brain activation were observed. First, like the amygdala, left temporal lobe activation was directly correlated to social anxiety. This laterality effect is notable in that neither group exhibited significant activation in the left temporal lobes; activation at the group-level was lateralized to the right. The temporal lobes are involved in eye and gaze processing (Johnson, 2005). Thus, these results may indicate that individuals with higher levels of anxiety have less lateralized activation in response to viewing facial expressions, which may be an effect of heightened arousal.
Second, individuals with ASD and higher levels of anxiety were found to have lower levels of activation in the FFA. Although we did not predict this finding, these results are provocative in light of the debate over whether individuals with ASD have reduced neural sensitivity to faces or abnormally localized regions of face sensitivity. Several investigators have hypothesized that the FFA is underdeveloped in autism because of limited of experience with faces. Thus, the relationship between high levels of anxiety and hypoactivation of the fusiform could be seen as consistent with the theory that higher anxiety is associated with less experience with faces throughout development, and consequently less robust fusiform face activation. Alternatively, this finding may indicate that individuals with higher levels of anxiety exhibit gaze scan patterns consistent with avoidance (Pujol et al., 2009). Because we did not include eye-tracking in this experiment, that interpretation cannot be ruled out. FFA activation is sensitive to eye scan patterns (Morris et al., 2007) such that reduced fixations on the eyes and mouth result in decreased FFA. Additionally, “normalized” FFA activation has been found in autism when participants were explicitly instructed to scan the eyes and mouth (Perlman et al., In Press). Given the lack of between group differences in the FFA in our study, the nature of our task, which could not be accurately performed without looking at the eyes and mouth, and evidence FFA activation can be normalized by experimental manipulations, we think that it is unlikely that our results are driven by behavioral differences in eye gaze patterns. However, ongoing studies by our group that are employing eye-tracking will be able to more thoroughly address this issue in future studies.
Our secondary aim was to investigate the neural correlates of emotional face matching in ASD, in order to compare our study to previous reports in the literature. The ASD group demonstrated significantly reduced activation in the left inferior frontal lobe and significantly increased activation in the occipital lobe (cuneus, lingual gyrus). This pattern of activation, indicating a reduction in the relative engagement of higher order brain regions coupled with enhanced activation in sensory areas, is consistent with the theory that behavioral abnormalities in autism may result from reduced long distance cortical-cortical connections and a failure of the frontal lobes to effectively integrate information and provide feedback to primary sensory regions (Courchesne & Pierce, 2005). Accordingly, we suggest that our results may reflect the utilization of a more perceptually based strategy to perform tasks than is utilized by typically developing individuals, related to frontal lobe dysfunction. However, it is important to note that few studies of face processing have reported this effect; therefore further replication is needed.
As hypothesized, no significant group-differences in amygdala activation were found. The literature on amygdala activation to faces in ASD is inconsistent, with reports of amygdala hypoactivation, hyperactivation, and no difference from the comparative sample. Task demands appear to be a factor in determining whether amygdala hypoactivation is observed. For example, Wang et al observed that amygdala activation in the ASD group was not modulated by whether the participant was performing a perceptual matching task or a verbal labeling task (Wang et al., 2004) whereas in the comparison group, verbal labeling was associated with increased amygdala activation. Similarly, in Pelphrey et al’s study (2007), amygdala activation in the ASD group was not modulated by viewing dynamic facial expressions compared to static facial expressions, while dynamic emotions were associated with relatively increased activation compared to static faces in the control group. Thus, when task demands were low (perception matching, viewing static faces), individuals with ASD did not show significantly reduced activation in the amygdala relative to the comparison group. However, given the relationship between amygdala activation and anxiety in ASD found in our experiment, a lack of group differences may not signify that amygdala function in response to emotional face processing is normal. To understand amygdala dysfunction in ASD, further study of the interaction between task demands and the clinical characteristics of the study participants would be useful.
Figure 1.

Between group differences in fMRI activation for the contrast emotional face matching > shape matching. The control group evidenced significantly greater activation in the left prefrontal cortex (blue cluster) whereas the ASD group had significantly greater activation in the occipital lobes (red cluster). All contrasts were corrected for multiple comparisons using cluster threshold correction.
Acknowledgments
This work was supported by the NICHD (U19HD34565, P30HD002274), and NIMH (U54MH066399).
Footnotes
Publisher's Disclaimer: This is a PDF file of an unedited manuscript that has been accepted for publication. As a service to our customers we are providing this early version of the manuscript. The manuscript will undergo copyediting, typesetting, and review of the resulting proof before it is published in its final citable form. Please note that during the production process errors may be discovered which could affect the content, and all legal disclaimers that apply to the journal pertain.
References
- Ashwin C, Baron-Cohen S, Wheelwright S, O’Riordan M, Bullmore ET. Differential activation of the amygdala and the ‘social brain’ during fearful face-processing in Asperger Syndrome. Neuropsychologia. 2006 doi: 10.1016/j.neuropsychologia.2006.04.014. [DOI] [PubMed] [Google Scholar]
- Ashwin C, Chapman E, Colle L, Baron-Cohen S. Impaired recognition of negative basic emotions in autism: a test of the amygdala theory. Soc Neurosci. 2006;1(3–4):349–363. doi: 10.1080/17470910601040772. [DOI] [PubMed] [Google Scholar]
- Baron-Cohen S, Ring HA, Bullmore ET, Wheelwright S, Ashwin C, Williams SC. The amygdala theory of autism. Neurosci Biobehav Rev. 2000;24(3):355–364. doi: 10.1016/s0149-7634(00)00011-7. [DOI] [PubMed] [Google Scholar]
- Beesdo K, Lau J, Guyer A, McClure-Tone E, Monk C, Nelson E, et al. Common and distinct amygdala-function perturbations in depressed vs anxious adolescents. Arch Gen Psychiatry. 2009;66(3):275–285. doi: 10.1001/archgenpsychiatry.2008.545. [DOI] [PMC free article] [PubMed] [Google Scholar]
- Belmonte MK, Yurgelun-Todd DA. Functional anatomy of impaired selective attention and compensatory processing in autism. Brain Res Cogn Brain Res. 2003;17(3):651–664. doi: 10.1016/s0926-6410(03)00189-7. [DOI] [PubMed] [Google Scholar]
- Bookheimer SY, Wang AT, Scott A, Sigman M, Dapretto M. Frontal contributions to face processing differences in autism: evidence from fMRI of inverted face processing. J Int Neuropsychol Soc. 2008;14(6):922–932. doi: 10.1017/S135561770808140X. [DOI] [PMC free article] [PubMed] [Google Scholar]
- Casanova MF, Buxhoeveden DP, Switala AE, Roy E. Minicolumnar pathology in autism. Neurology. 2002;58(3):428–432. doi: 10.1212/wnl.58.3.428. [DOI] [PubMed] [Google Scholar]
- Courchesne E, Pierce K. Why the frontal cortex in autism might be talking only to itself: local over-connectivity but long-distance disconnection. Curr Opin Neurobiol. 2005;15(2):225–230. doi: 10.1016/j.conb.2005.03.001. [DOI] [PubMed] [Google Scholar]
- Critchley HD, Daly EM, Bullmore ET, Williams SC, Van Amelsvoort T, Robertson DM, et al. The functional neuroanatomy of social behaviour: changes in cerebral blood flow when people with autistic disorder process facial expressions. Brain. 2000;123(Pt 11):2203–2212. doi: 10.1093/brain/123.11.2203. [DOI] [PubMed] [Google Scholar]
- Dalton KM, Nacewicz BM, Johnstone T, Schaefer HS, Gernsbacher MA, Goldsmith HH, et al. Gaze fixation and the neural circuitry of face processing in autism. Nat Neurosci. 2005;8(4):519–526. doi: 10.1038/nn1421. [DOI] [PMC free article] [PubMed] [Google Scholar]
- Dawson G, Webb SJ, McPartland J. Understanding the nature of face processing impairment in autism: insights from behavioral and electrophysiological studies. Dev Neuropsychol. 2005;27(3):403–424. doi: 10.1207/s15326942dn2703_6. [DOI] [PubMed] [Google Scholar]
- Ekman P, Friesen WV. Pictures of Facial Affect. 1976. (Artist) [Google Scholar]
- Gaffrey MS, Kleinhans NM, Haist F, Akshoomoff N, Campbell A, Courchesne E, et al. Atypical [corrected] participation of visual cortex during word processing in autism: an fMRI study of semantic decision. Neuropsychologia. 2007;45(8):1672–1684. doi: 10.1016/j.neuropsychologia.2007.01.008. [DOI] [PMC free article] [PubMed] [Google Scholar]
- Hadjikhani N, Joseph RM, Snyder J, Chabris CF, Clark J, Steele S, et al. Activation of the fusiform gyrus when individuals with autism spectrum disorder view faces. Neuroimage. 2004;22(3):1141–1150. doi: 10.1016/j.neuroimage.2004.03.025. [DOI] [PubMed] [Google Scholar]
- Hadjikhani N, Joseph RM, Snyder J, Tager-Flusberg H. Abnormal activation of the social brain during face perception in autism. Hum Brain Mapp. 2006 doi: 10.1002/hbm.20283. [DOI] [PMC free article] [PubMed] [Google Scholar]
- Hariri A, Bookheimer S, Mazziotta J. Modulating emotional responses: effects of a neocortical network on the limbic system. Neuroreport. 2000;11(1):43–48. doi: 10.1097/00001756-200001170-00009. [DOI] [PubMed] [Google Scholar]
- Hubl D, Bolte S, Feineis-Matthews S, Lanfermann H, Federspiel A, Strik W, et al. Functional imbalance of visual pathways indicates alternative face processing strategies in autism. Neurology. 2003;61(9):1232–1237. doi: 10.1212/01.wnl.0000091862.22033.1a. [DOI] [PubMed] [Google Scholar]
- Johnson MH. Subcortical face processing. Nat Rev Neurosci. 2005;6(10):766–774. doi: 10.1038/nrn1766. [DOI] [PubMed] [Google Scholar]
- Kleinhans NM, Johnson LC, Richards T, Mahurin R, Greenson J, Dawson G, et al. Reduced neural habituation in the amygdala and social impairments in autism spectrum disorders. Am J Psychiatry. 2009;166(4):467–475. doi: 10.1176/appi.ajp.2008.07101681. [DOI] [PubMed] [Google Scholar]
- Kleinhans NM, Richards T, Sterling L, Stegbauer KC, Mahurin R, Johnson LC, et al. Abnormal functional connectivity in autism spectrum disorders during face processing. Brain. 2008;131(Pt 4):1000–1012. doi: 10.1093/brain/awm334. [DOI] [PubMed] [Google Scholar]
- Kleinhans NM, Schweinsburg BC, Cohen DN, Muller RA, Courchesne E. N-acetyl aspartate in autism spectrum disorders: regional effects and relationship to fMRI activation. Brain Res. 2007;1162:85–97. doi: 10.1016/j.brainres.2007.04.081. [DOI] [PMC free article] [PubMed] [Google Scholar]
- Koshino H, Carpenter PA, Minshew NJ, Cherkassky VL, Keller TA, Just MA. Functional connectivity in an fMRI working memory task in high-functioning autism. Neuroimage. 2005;24(3):810–821. doi: 10.1016/j.neuroimage.2004.09.028. [DOI] [PubMed] [Google Scholar]
- Lord C, Risi S, Lambrecht L, Cook E, Leventhal B, DiLavore P, et al. The Autism Diagnostic Observation Schedule--Generic: A standard measure of social and communication deficits associated with the spectrum of autism. Journal of Autism & Developmental Disorders. 2000;30(3):205–223. [PubMed] [Google Scholar]
- Lord C, Rutter M, Le Couteur A. Autism Diagnostic Interview-Revised: a revised version of a diagnostic interview for caregivers of individuals with possible pervasive developmental disorders. Journal of Autism and Developmental Disorders. 1994;24(5):659–685. doi: 10.1007/BF02172145. [DOI] [PubMed] [Google Scholar]
- Mazefsky CA, Folstein SE, Lainhart JE. Overrepresentation of mood and anxiety disorders in adults with autism and their first-degree relatives: what does it mean? Autism Res. 2008;1(3):193–197. doi: 10.1002/aur.23. [DOI] [PMC free article] [PubMed] [Google Scholar]
- Monk CS, Weng SJ, Wiggins JL, Kurapati N, Louro HM, Carrasco M, et al. Neural circuitry of emotional face processing in autism spectrum disorders. J Psychiatry Neurosci. 2010;35(2):105–114. doi: 10.1503/jpn.090085. [DOI] [PMC free article] [PubMed] [Google Scholar]
- Morris JP, Pelphrey KA, McCarthy G. Controlled scanpath variation alters fusiform face activation. 2007;2:31–38. doi: 10.1093/scan/nsl023. [DOI] [PMC free article] [PubMed] [Google Scholar]
- Muller RA, Kleinhans N, Kemmotsu N, Pierce K, Courchesne E. Abnormal variability and distribution of functional maps in autism: an FMRI study of visuomotor learning. Am J Psychiatry. 2003;160(10):1847–1862. doi: 10.1176/appi.ajp.160.10.1847. [DOI] [PubMed] [Google Scholar]
- Pelphrey KA, Morris JP, McCarthy G, Labar KS. Perception of dynamic changes in facial affect and identity in autism. Soc Cogn Affect Neurosci. 2007;2(2):140–149. doi: 10.1093/scan/nsm010. [DOI] [PMC free article] [PubMed] [Google Scholar]
- Perlman SB, Hudac CM, Pegors T, Minshew NJ, Pelphrey KA. Experimental manipulation of face-evoked activity in the fusiform gyrus of individuals with autism. Soc Neurosci. :1–9. doi: 10.1080/17470911003683185. (In Press) [DOI] [PMC free article] [PubMed] [Google Scholar]
- Pierce K, Haist F, Sedaghat F, Courchesne E. The brain response to personally familiar faces in autism: findings of fusiform activity and beyond. Brain. 2004;127(Pt 12):2703–2716. doi: 10.1093/brain/awh289. [DOI] [PubMed] [Google Scholar]
- Pierce K, Redcay E. Fusiform function in children with an autism spectrum disorder is a matter of “who”. Biol Psychiatry. 2008;64(7):552–560. doi: 10.1016/j.biopsych.2008.05.013. [DOI] [PMC free article] [PubMed] [Google Scholar]
- Piggot J, Kwon H, Mobbs D, Blasey C, Lotspeich L, Menon V, et al. Emotional attribution in high-functioning individuals with autistic spectrum disorder: a functional imaging study. J Am Acad Child Adolesc Psychiatry. 2004;43(4):473–480. doi: 10.1097/00004583-200404000-00014. [DOI] [PubMed] [Google Scholar]
- Pujol J, Harrison BJ, Ortiz H, Deus J, Soriano-Mas C, Lopez-Sola M, et al. Influence of the fusiform gyrus on amygdala response to emotional faces in the non-clinical range of social anxiety. Psychol Med. 2009;39(7):1177–1187. doi: 10.1017/S003329170800500X. [DOI] [PubMed] [Google Scholar]
- Schultz RT. Developmental deficits in social perception in autism: the role of the amygdala and fusiform face area. Int J Dev Neurosci. 2005;23(2–3):125–141. doi: 10.1016/j.ijdevneu.2004.12.012. [DOI] [PubMed] [Google Scholar]
- Shin L, Liberzon I. The Neurocircuitry of Fear, Stress, and Anxiety Disorders. Neuropsychopharmacology. 2009 doi: 10.1038/npp.2009.83. [DOI] [PMC free article] [PubMed] [Google Scholar]
- Simonoff E, Pickles A, Charman T, Chandler S, Loucas T, Baird G. Psychiatric disorders in children with autism spectrum disorders: prevalence, comorbidity, and associated factors in a population-derived sample. J Am Acad Child Adolesc Psychiatry. 2008;47(8):921–929. doi: 10.1097/CHI.0b013e318179964f. [DOI] [PubMed] [Google Scholar]
- Sterling L, Dawson G, Estes A, Greenson J. Characteristics associated with presence of depressive symptoms in adults with autism spectrum disorder. J Autism Dev Disord. 2008;38(6):1011–1018. doi: 10.1007/s10803-007-0477-y. [DOI] [PubMed] [Google Scholar]
- Vargas DL, Nascimbene C, Krishnan C, Zimmerman AW, Pardo CA. Neuroglial activation and neuroinflammation in the brain of patients with autism. Ann Neurol. 2005;57(1):67–81. doi: 10.1002/ana.20315. [DOI] [PubMed] [Google Scholar]
- Wang AT, Dapretto M, Hariri AR, Sigman M, Bookheimer SY. Neural correlates of facial affect processing in children and adolescents with autism spectrum disorder. J Am Acad Child Adolesc Psychiatry. 2004;43(4):481–490. doi: 10.1097/00004583-200404000-00015. [DOI] [PubMed] [Google Scholar]
- Watson D, Friend R. Measurement of social-evaluative anxiety. J Consult Clin Psychol. 1969;33(4):448–457. doi: 10.1037/h0027806. [DOI] [PubMed] [Google Scholar]
- White SW, Oswald D, Ollendick T, Scahill L. Anxiety in children and adolescents with autism spectrum disorders. Clin Psychol Rev. 2009;29(3):216–229. doi: 10.1016/j.cpr.2009.01.003. [DOI] [PMC free article] [PubMed] [Google Scholar]
- Zilbovicius M, Garreau B, Samson Y, Remy P, Barthelemy C, Syrota A, et al. Delayed maturation of the frontal cortex in childhood autism. Am J Psychiatry. 1995;152(2):248–252. doi: 10.1176/ajp.152.2.248. [DOI] [PubMed] [Google Scholar]