

In many ways circular DNA is unique among biological macromolecules. Its properties are unusual and interesting because they are affected greatly by the topology of the molecule. The properties of circular DNA are not only an object of study, but provide an important tool for the investigation of the double helix and its interactions with ligands and proteins. The specific features of circular DNA were used to determine the bending and torsional rigidities of the double helix (1–7), its effective diameter (8–9), helical repeat of DNA in solution (10–12), and the unwinding of the double helix by bound ligands (see references in reviews in refs. 13 and 14). All of these applications are based on the measurement of the linking number difference of closed circular DNA, which can be accomplished with remarkable accuracy and with very simple equipment. Therefore it seems hardly possible to find a new application for these well-understood properties. However, the paper by Zeman et al. (15) published in this issue of the Proceedings proved the contrary. They have developed a new method to study DNA-ligand complexes.
Using circular DNA to measure the degree of unwinding of the double helix caused by ligand binding was one of the first applications of the specific properties of circular DNA. The approach is conceptually simple. Consider a nicked circular DNA of N base pairs that is bound to molecules of a ligand so that the ratio of bound ligands to base pairs is equal to ν. If φ is the angle of unwinding of the double helix by one bound ligand, the change of the equilibrium twist of the DNA, ΔTw, is given by the equation
 |
1 |
It is easy to measure ΔTw by using the topological properties of circular DNA. All that is needed is to ligate the nick in a circular DNA, with and without bound ligands, to generate the closed circular form. The ligation converts the Tw of the nicked circular DNA into the linking number, Lk, of the complementary strands of the closed form. The latter is a topological characteristic of the molecule that maintains its value as long as the strands remain intact. After removal of the ligands the value of Lk2 − Lk1 = ΔTw can be measured by gel electrophoresis as discussed below (the same Lk1 and Lk2 values can be obtained by relaxation of the closed circular molecules by a DNA topoisomerase in the presence and absence of ligand). Because ΔTw and N are now known, we can calculate the product φν from Eq. 1. To determine φ we need to know the value of ν. Usually spectroscopic methods are used to find the association constant, KA, for binding ligands with DNA. If we know KA, we can calculate ν. Zeman et al. (15) instead determined KA by the same measurements of ΔTw by using various DNA and ligand concentrations, CN and CL, and then extrapolating the data to infinite DNA concentration (15). For each set of CN and CL, the apparent unwinding angle, φap, is calculated assuming that all ligands are bound to DNA. As DNA concentration increases, φap approaches φ. The extrapolation procedure suggested by Zeman et al. (15) is based on the ligand binding isotherm and is specified by the equation
 |
2 |
where n is the number of base pairs covered by one molecule of bound ligand. The value of φap is a linear function of φap/[CN − (2n − 1)CL] and the intercept with the ordinate yields φ. The advance is that the fit of the experimental data to Eq. 2 gives the value of KA as well. The method was tested for two ligands, ethidium bromide (EtBr) and daunorubicin, with well-known values of φ and KA. Good agreement with previous results was obtained. For example, Zeman et al. (15) found φ = 28.7 ± 2.9° for EtBr and the value of 26° is considered canonical for this ligand.
It is interesting to note that the experimental data are consistent with Eq. 2 beyond the range of conditions for which this equation was derived, namely
 |
3 |
 |
4 |
Conditions 3 and 4 mean that nearly all ligand molecules are bound to DNA at equilibrium. The experimental data of Zeman et al. for binding of ethidium bromide followed Eq. 2 even when only 20% of the ligand was bound with DNA (15). As a result one can use a wider range of conditions for the measurements and this makes the method more practical. Condition 4 should be satisfied, however, at least for the highest DNA concentration used to obtain the value of φ with good accuracy. Condition 3 defines the lower limit of the unwinding angles φ that can be evaluated by the method. Zeman et al. showed that the method works well for angles as small as 5° (15).
If condition 3 is satisfied, then, in many cases, the term (2n − 1)CL in Eq. 2 can be neglected. In such cases we do not need to know n, the number of excluded binding sites per ligand molecule. Only when n > 2 can the term (2n − 1)CL be essential. In that case, n affects the slope of the line described by Eq. 2 and thus the value of KA determined from a fit of the data to Eq. 2. Zeman et al., however, showed that the values of φ deduced from this approach are independent of n even when n > 2 (15).
There is one more restriction of the new method, in comparison with the approach based on optical measurements. It is convenient for the analysis to have all ligand molecules bound to DNA. This can be achieved by increasing the DNA concentration. For reliable measurements of ΔTw, however, the ratio CL/CN has to be above a limit that depends on φ. Optical methods are free from this restriction if the absorption range for ligand and DNA are different. In some cases this restriction is critical.
On the other hand, there are important advantages associated with this method. It does not require any expensive equipment and can be used for ligands that exhibit no change in optical properties resulting from the binding with DNA. It appears that the method has good accuracy, at least for the determination of φ. This accuracy comes from the remarkable sensitivity of the topological analysis of DNA unwinding, ΔTw. The general principle of the topological analysis can be described as follows.
When nicked circular DNA molecules are converted into the closed circular form, a mixture of topoisomers is obtained with different values of Lk. The value of Lk can be defined as the number of the double helical turns assuming that the helix lies on a flat surface without self-intersections (see ref. 16 for further details). The values of Lk adopt integer values that are distributed around the average value, Lk0, according to the equation
 |
5 |
where A and α are parameters (1, 2). This distribution is the result of torsional and bending fluctuations. The value of Lk0 is not an integer, it is just the equilibrium value of DNA twist, Tw, under the conditions of cyclization. Thus the values of Lk0 for DNA molecules cyclized in the presence and absence of a ligand will be different and this difference, ΔTw, is what we need to find. The two distributions of topoisomers will be shifted relative to one another by ΔTw. When the ligands are removed from the solution and the DNA, the topoisomer distributions and the shift will not change because of the invariance of Lk. To measure the shift, the topoisomers of two DNA samples are separated by gel electrophoresis. It is important that we can transfer our molecules to any conditions to get optimal resolution of the topoisomers. The difference between the distributions will not change, even though the value of Lk0 will, because it is defined by solution conditions. Traditionally, a small amount of chloroquine is added into the solution to resolve all topoisomers. A typical pattern of the bands is shown in Fig. 1. Fitting the distributions of the band intensities to Eq. 5 allows us to determine the value of ΔTw with a high degree of accuracy. Zeman et al. used two-dimensional gel electrophoresis to obtain the shift ΔTw (15). In the context of this method, the advantage of two-dimensional electrophoresis is that it nearly doubles the number of topoisomers that can be separated.
Figure 1.
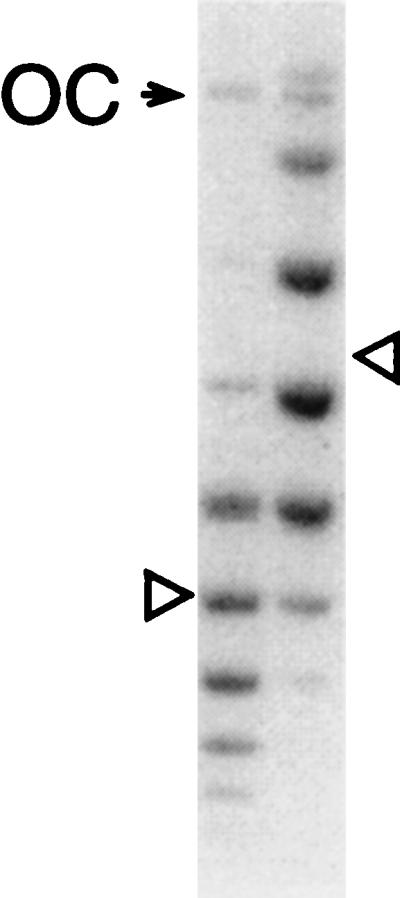
Measuring the shift between the two distributions of topoisomers of circular DNA. Typical results of agarose gel electrophoresis showing the separation of topoisomers of pUC19 DNA. The two distributions were obtained at different concentrations of bound ligands (ethidium bromide). The centers of the distributions, shown by the triangles, differ by 2.3. Both lanes contain the band of open circular DNA (OC). (Illustration provided by M. Vologodskaia, New York University.)
References
- 1.Depew R E, Wang J C. Proc Natl Acad Sci USA. 1975;72:4275–4279. doi: 10.1073/pnas.72.11.4275. [DOI] [PMC free article] [PubMed] [Google Scholar]
- 2.Pulleyblank D E, Shure M, Tang D, Vinograd J, Vosberg H P. Proc Natl Acad Sci USA. 1975;72:4280–4284. doi: 10.1073/pnas.72.11.4280. [DOI] [PMC free article] [PubMed] [Google Scholar]
- 3.Vologodskii A V, Anshelevich V V, Lukashin A V, Frank-Kamenetskii M D. Nature (London) 1979;280:294–298. doi: 10.1038/280294a0. [DOI] [PubMed] [Google Scholar]
- 4.Shore D, Baldwin R L. J Mol Biol. 1983;170:983–1007. doi: 10.1016/s0022-2836(83)80199-5. [DOI] [PubMed] [Google Scholar]
- 5.Horowitz D S, Wang J C. J Mol Biol. 1984;173:75–91. doi: 10.1016/0022-2836(84)90404-2. [DOI] [PubMed] [Google Scholar]
- 6.Frank-Kamenetskii M D, Lukashin A V, Anshelevich V V, Vologodskii A V. J Biomol Struct Dyn. 1985;2:1005–1012. doi: 10.1080/07391102.1985.10507616. [DOI] [PubMed] [Google Scholar]
- 7.Levene S D, Crothers D M. J Mol Biol. 1986;189:73–83. doi: 10.1016/0022-2836(86)90382-7. [DOI] [PubMed] [Google Scholar]
- 8.Rybenkov V V, Cozzarelli N R, Vologodskii A V. Proc Natl Acad Sci USA. 1993;90:5307–5311. doi: 10.1073/pnas.90.11.5307. [DOI] [PMC free article] [PubMed] [Google Scholar]
- 9.Shaw S Y, Wang J C. Science. 1993;260:533–536. doi: 10.1126/science.8475384. [DOI] [PubMed] [Google Scholar]
- 10.Wang J C. Proc Natl Acad Sci USA. 1979;76:200–203. [Google Scholar]
- 11.Peck L J, Wang J C. Nature (London) 1981;292:375–378. doi: 10.1038/292375a0. [DOI] [PubMed] [Google Scholar]
- 12.Duguet M. Nucleic Acids Res. 1993;21:463–468. doi: 10.1093/nar/21.3.463. [DOI] [PMC free article] [PubMed] [Google Scholar]
- 13.Waring M J. Annu Rev Biochem. 1981;50:159–192. doi: 10.1146/annurev.bi.50.070181.001111. [DOI] [PubMed] [Google Scholar]
- 14.Chaires J B. Anti-Cancer Drug Des. 1996;11:569–580. [PubMed] [Google Scholar]
- 15.Zeman S M, Depew K M, Danishefsky S J, Crothers D M. Proc Natl Acad Sci USA. 1998;95:4327–4332. doi: 10.1073/pnas.95.8.4327. [DOI] [PMC free article] [PubMed] [Google Scholar]
- 16.Vologodskii A V. Topology and Physics of Circular DNA. Boca Roton, FL: CRC; 1992. [Google Scholar]