

Abstract
Background
Guidelines recommend detection of early chronic obstructive pulmonary disease (COPD), but evidence on the diagnostic work-up for COPD only concerns advanced and established COPD.
Aim
To quantify the accuracy of symptoms and signs for early COPD, and the added value of C-reactive protein (CRP), in primary care patients presenting with cough.
Design and setting
Cross-sectional diagnostic study of 73 primary care practices in the Netherlands
Method
Four hundred primary care patients (182 males, mean age 63 years) older than 50 years, presenting with persistent cough (>14 days) without established COPD participated, of whom 382 completed the study. They underwent a systematic diagnostic work-up of symptoms, signs, conventional laboratory CRP level, and hospital lung functions tests, including body plethysmography, and an expert panel decided whether COPD was present (reference test). The independent value of all items was estimated by multivariable logistic regression analysis.
Results
According to the expert panel, 118 patients had COPD (30%). Symptoms and signs with independent diagnostic value were age, sex, current smoking, smoking more than 20 pack-years, cardiovascular comorbidity, wheezing complaints, diminished breath sounds, and wheezing on auscultation. Combining these items resulted in an area under the receiver operating characteristic curve (ROC area) of 0.79 (95% confidence interval = 0.74 to 0.83) after internal validation. The proportion of subjects with elevated CRP was higher in those with early COPD, but CRP added no relevant diagnostic information above symptoms and signs.
Conclusion
In subjects presenting with persistent cough, the CRP level has no added value for detection of early COPD.
Keywords: chronic obstructive pulmonary disease, C-reactive protein, diagnosis, general practice
INTRODUCTION
Guidelines recommend seeking early chronic obstructive pulmonary disease (COPD) in patients presenting with cough. Cough is the main early symptom of COPD and among the most frequent reasons to seek primary health care, and early detection of COPD could enhance adequate treatment of many affected subjects, and improve their symptoms and quality of life.1 Moreover, early COPD detection could prevent unnecessary tests and treatments for unexplained cough, including unnecessary use of antibiotics.
Nonetheless, diagnostic work-up for early COPD is complex and most cases are not detected until they have developed to a more severe stage,2 often with accompanying complaints of breathlessness and severe airway obstruction. The diagnostic assessment of early COPD requires judgement of symptoms, signs, and spirometry results combined, while spirometry abnormalities are often subtle.3 Moreover, the diagnostic value of symptoms and signs for early COPD are not well known. Several studies have found particular characteristics related to COPD, for example age, sex, smoking, wheezing, and reduced breath sounds, and that no item could diagnose or exclude COPD on its own.4,5 However most studies analysed established and more advanced COPD in secondary care, and the generalisability to detecting early COPD in primary care patients with cough may be limited. To the authors’ knowledge, only one study has evaluated symptoms and signs in patients presenting with cough in primary care6 but the resulting evidence was limited as only 14 subjects had COPD.
Moreover, several studies found that the level of C-reactive protein (CRP) was higher in patients with stable COPD than in comparable subjects without COPD, and this has been attributed to ongoing systemic inflammation.7–9 CRP measurement is relatively cheap and often performed in primary care, and could be useful in the diagnostic work-up for COPD, but it is not known to what extent CRP adds diagnostic value above symptoms and signs.
The aim of this study was to quantify the diagnostic value of standard history taking and physical examination for early COPD in patients presenting with cough, and the added diagnostic value of CRP.
METHOD
Study population
From January 2006 to May 2009, 73 Dutch GPs who were trained for the study invited patients aged over 50 years presenting with persistent cough (>14 days) to participate. Exclusion criteria were physician-diagnosed COPD, severe psychiatric symptoms, terminal illness, and suspected pneumonia; smoking was not an eligibility criterion. Initially 50 GPs participated, but because fewer patients than planned were included, more physicians were recruited in 2006 to include the planned 400 patients. The GPs only registered data on patients willing to participate, and not on all subjects presenting with cough. The study protocol has been described in detail previously, except that patients with ‘diagnosed asthma’ were excluded in a previous analysis,10 while they were included in the present analysis.
How this fits in
Previous studies have shown that symptoms and signs help to estimate the diagnostic risk of chronic obstructive pulmonary disease (COPD) and that the level of C-reactive protein is increased in patients with stable COPD. These studies were only performed in severe and established cases of COPD. The present study in primary care patients presenting with cough without previously diagnosed COPD found that symptoms and signs had diagnostic value for early COPD, but, when combined, showed low sensitivity. CRP was higher in subjects with early COPD but added no diagnostic information above symptoms and signs.
Signs, symptoms, and C-reactive protein
On the day of presentation, participants underwent systematic history taking (symptoms) and physical examination (signs) by their GP. Based on the literature,11 and clinical reasoning, the following symptoms and signs with potential value to detect early COPD were evaluated: age,12 sex,1,6 current smoking,1 long smoking history, defined as >20 pack-years of smoking,13,14 dyspnoea,1 phlegm,1 complaints of wheezing,6,15 daily cough during the last 3 months,1 cardiovascular disease,16 allergy for pollen, house dust mites, cats, or dogs,6 diminished breath sounds,17 and wheezing on auscultation.14
On the same day, the CRP level in venous blood was measured by the nearest hospital laboratory, using a conventional immunoturbidimetric assay (lower limit of detection 3 mg/l).
Reference test (diagnostic outcome)
All patients underwent extensive lung function tests in one of the eight participating hospitals, according to European Respiratory Society (ERS)/American Thoracic Society (ATS) criteria.18 This was done at day 90, to allow for measurements in a stable phase. Participants were instructed not to use inhaled medication on the measurement day. Measurements included the forced vital capacity (FVC), the forced expiratory volume in 1 second (FEV1), and the FEV1/FVC ratio before and at least 15 min after bronchodilation with 400 μg of salbutamol inhaled from a valved spacer device. The best of a minimum of three acceptable flow volumes was retained to determine the post-bronchodilator FEV1/FVC ratio. Body plethysmography and measurement of diffusion of the lung for carbon monoxide (DLCO) by the single-breath method were also performed, to enhance optimal classification of the presence or absence of COPD. Post-bronchodilator results were expressed as percentages of predicted according to age, sex, and height.19
As no single objective reference standard is available, the presence or absence of COPD was defined by a panel of two experts, a GP special interest in COPD, and one of the eight participating lung physicians, within 3 months after lung function assessment.20 The panel made their decisions in consensus during a meeting where all available patient information was provided, except the CRP results. Conforming to guidelines, a COPD diagnosis required at least recurrent respiratory complaints (≥2 episodes of cough, wheezing, or dyspnoea in the previous 12 months), as well as a post-bronchodilator lowered FEV1/FVC ratio in the hospital lung function results. A FEV1/FVC ratio <0.7 was perceived as ‘low’ according to guidelines, without automatically implying a diagnosis of COPD,1 because the ratio physiologically decreases with age.1,21 A history of smoking was supportive of a diagnosis but not obligatory. COPD severity was defined according to the Global Initiative for Obstructive Pulmonary Disease (GOLD). Other diagnoses were determined if possible, which could also be based on the follow-up information provided by the patients’ GPs, who supplied usual care throughout study. The reproducibility of the findings of the expert panel for COPD was estimated by repeating the procedure after more than a year, in a random sample of 41 participants (10%), blinding the panel for the original diagnosis, resulting in a Cohen’s kappa of 0.94.22
In practice, as well as in previous studies, COPD is often defined by obstructive spirometry results (low FEV1/FVC) only. Therefore, in this study, COPD was also defined accordingly, by two commonly used thresholds for low FEV1/FVC (irrespective of other characteristics): <0.70 (fixed) and below the lower limit of normal (LLN) according to age and sex, defining the lowest fifth percentile as abnormal.19 LLN was calculated by the following formulae:
males: LLN = –0.18*age + 87.21 – (1.64*7.17)
females: LLN = –0.19*age + 89.10 – (1.64*6.51).
All analyses were performed three times, using the three different definitions of COPD: (1) the expert panel diagnosis (‘COPD panel’); (2) FEV1/FVC below 0.7 (‘COPD <0.7’); and (3) FEV1/FVC below LLN (‘COPD <LLN’).
Data analysis
The association of the diagnostic variables (symptoms, signs, and CRP) with COPD according to the three definitions was assessed using univariable logistic regression analysis, after checking the linearity of the relationship between continuous age and CRP and the presence or absence of COPD using cubic splines.11 Next, all 12 symptoms and signs were entered into a single multivariable logistic regression model, and consecutively excluded using the log likelihood ratio test (LLR test) at a P-value of 0.10, resulting in a reduced model of symptoms and signs.11
The added value of CRP above the reduced model of symptoms and signs was evaluated using the LLR test and analysis of the area under the receiver operating characteristic curve (ROC area). CRP was analysed continuously and dichotomised at two common low thresholds (>10 mg/l and >20 mg/l).23 The resulting significant diagnostic combinations were adjusted for sampling errors by bootstrapping techniques, to improve generalisability.11 Calibration was assessed by the Hosmer and Lemeshow (HL) statistic. A natural log transform was applied to the odds ratios (ORs) of the relevant variables and, by the resulting linear predictors, the diagnostic risk of COPD was calculated for all subjects. Risk stratification by the relevant models was expressed as low (<20%), intermediate (20–80%), and high (>80%) diagnostic risk for COPD. There is no consensus or literature on suitable thresholds for low and high probability for COPD, and a relatively high (20%) and low (80%) value respectively were chosen, considering that falsely diagnosing or excluding early COPD is not life threatening and treatment costs are limited.
As excluding cases with missing data often induces bias,24 missing values were imputed using single regression techniques. Analyses were performed in R, version 2.8.1.25
RESULTS
Diagnostic outcome
Four hundred primary care patients (182 males, mean age 63 years) participated. On average, there were 6% missing values on the diagnostic variables. In 18 participants (4.5%), there were insufficient lung function results (Figure 1). The mean duration of cough was 102 days (median 40 days, interquartile range [IQR] 21–90 days). According to the panel diagnosis, 118 participants had COPD (30%), of whom 83 were mild (FEV1 >80% predicted), 32 moderate (FEV1 50–80% predicted), and three severe (FEV1 <50% predicted). The mean FEV1/FVC ratio was 0.62 (standard deviation [SD] = 0.1) and 0.77 (SD = 0.1) in patients with and without COPD, respectively. Other panel diagnoses were asthma in 57 (in 37 this was newly detected), including 20 subjects with both COPD and asthma, heart failure in four, pneumonia in one, and lung cancer in one subject.
Figure 1.
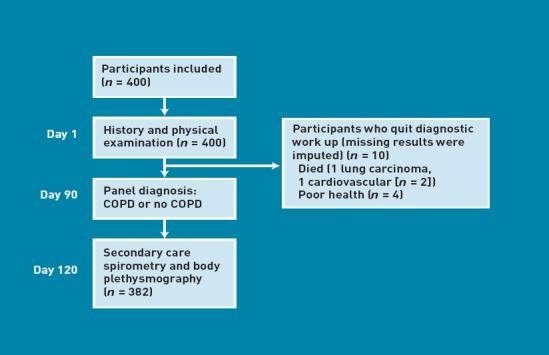
Flowchart of included patients
Defining COPD solely by low FEV1/FVC ratio resulted in 134 COPD <0.7 cases and 83 COPD <LLN cases.
Symptoms and signs
Univariable associations between patient characteristics and COPD are shown in Table 1.
Table 1.
Univariable association of diagnostic variables with COPD defined by expert panel, FEV1/FVC <0.7 and FEV1/FVC <LLN
| Diagnostic variable | Missing, % | Total, n = 400 | COPD panel, n = 118 | OR (95% CI) | COPD <0.7, n = 134 | OR (95% CI) | COPD LLN, n = 83 | OR (95% CI) |
|---|---|---|---|---|---|---|---|---|
| Symptoms and signs | ||||||||
| Age in years, mean (SD) | 0 | 63 (9) | 66 (10) | 1.3 (1.1 to 1.4)a | 66(10) | 1.3 (1.2 to 1.5)a | 64 (10) | 1.1 (0.9 to 1.2)a |
| Male sex | 0 | 182 (46) | 73 (62) | 2.6 (1.7 to 4.0) | 74(55) | 1.8 (1.2 to 2.7) | 42 (51) | 1.3 (0.8 to 2.1) |
| Current smoking | 6 | 111 (28) | 56 (48) | 3.7 (2.3 to 5.9) | 50(37) | 2.0 (1.3 to 3.1) | 34 (41) | 2.2 (1.3 to 3.6) |
| Cardiovascular diseaseb | 0 | 78 (20) | 39 (33) | 3.1 (1.8 to 5.1) | 40(30) | 2.9 (1.7 to 4.9) | 23 (28) | 2.0 (1.1 to 3.5) |
| Phlegm | 2 | 301 (75) | 98 (83) | 1.9 (1.1 to 3.3) | 109(81) | 1.7 (1.0 to 2.8) | 71 (86) | 2.2 (1.2 to 4.3) |
| Wheezing (symptom) | 4 | 197 (49) | 76 (64) | 2.4 (1.5 to 3.8) | 82(61) | 2.1 (1.4 to 3.2) | 53 (64) | 2.1 (1.3 to 3.5) |
| Dyspnoea | 2 | 218 (55) | 68 (58) | 1.2 (0.8 to 1.8) | 76(57) | 1.1 (0.8 to 1.7) | 47 (57) | 1.1 (0.7 to 1.8) |
| >20 pack-years of smoking | 6 | 131 (33) | 63 (53) | 3.6 (2.3 to 5.7) | 62(46) | 2.5 (1.6 to 3.8) | 39 (47) | 2.2 (1.3 to 3.6) |
| Daily cough last 3 months | 6 | 282 (71) | 86 (73) | 1.2 (0.7 to 1.9) | 96(72) | 1.1 (0.7 to 1.7) | 56 (68) | 0.8 (0.5 to 1.4) |
| Dyspnoea MRC score >3c | 6 | 116 (29) | 37 (31) | 1.2 (0.7 to 1.9) | 39(29) | 1.0 (0.6 to 1.6) | 25 (30) | 1.1 (0.6 to 1.8) |
| Allergyb,d | 7 | 51 (13) | 12 (10) | 0.7 (0.4 to 1.4) | 16(12) | 0.9 (0.5 to 1.7) | 10 (12) | 0.9 (0.4 to 1.9) |
| Wheezing (auscultation) | 3 | 54 (14) | 27 (23) | 2.8 (1.6 to 5.0) | 26(19) | 2.0 (1.1 to 3.7) | 16 (19) | 1.8 (0.9 to 3.3) |
| Diminished breath sounds | 3 | 46 (12) | 25 (21) | 3.3 (1.8 to 6.3) | 21(16) | 1.8 (1.0 to 3.3) | 13 (16) | 1.6 (0.8 to 3.2) |
| CRP | ||||||||
| Mean level in mg/l (SD) | 9 | 9.8 (18.2) | 12.1 (17.5) | 1.03 (0.99 to 1.07)e | 10.8 (15.9) | 1.01 (0.98 to 1.05)e | 12.7 (18.7) | 1.03 (0.99 to 1.06)e |
| >10 mg/l | 9 | 84 (21) | 28 (24) | 1.3 (0.8 to 2.1) | 32 (24) | 1.3 (0.8 to 2.1) | 23 (28) | 1.6 (0.9 to 2.8) |
| >20 mg/l | 9 | 47 (12) | 19 (16) | 1.7 (0.9 to 3.3) | 22 (16) | 1.9 (1.0 to 3.5) | 15 (18) | 1.9 (1.0 to 3.8) |
Values are numbers (percentages) unless mentioned otherwise. COPD = chronic obstructive pulmonary disease. FEV1 = forced expiratory volume in 1 s. FVC = forced vital capacity. LLN = lower limit of normal. OR = univariable odds ratio. SD = standard deviation.
Per 5 years.
Diagnosed before the study, according to medical file of GP.
Medical Research Council (MRC) score, situations in which the subject is dyspnoeic: 1, never; 2, only during strenuous exercise; 3, walking fast or uphill; 4, walking with people of the same age; 5, walking flat; 6, in rest.
Pollen, house dust mite, cats or dogs.
Per 5 mg/L CRP increase.
Eight items showed independent (multivariable) diagnostic value for COPD defined as panel diagnosis, and six and five for COPD <0.7 and COPD <LLN respectively (Table 2). The relevant symptoms and signs combined resulted in a ROC area of 0.79 (95% confidence interval [CI] = 0.74 to 0.83) for COPD as panel diagnosis, 0.71 (95% CI = 0.66 to 0.76) for COPD <0.7, and 0.67 (95% CI = 0.61 to 0.73) for COPD <LLN (Table 2). Overlapping items in the three combinations were current smoking, >20 pack-years’ smoking, cardiovascular disease, and wheezing (symptom). Table 3 shows that the three regression models (linear predictors) estimated a high diagnostic risk of COPD in a minority of COPD cases (10/118 [8%], 4/134 [3%] and 0%) regarding COPD panel, COPD <0.7 and COPD <LLN respectively. The HL statistic for the three combinations yielded a P-value of 0.70, 0.58, and 0.97, respectively, suggesting no lack of fit.
Table 2.
Independent diagnostic items combined for COPD defined by panel (a), FEV1/FVC <0.7 (b), and FEV1/FVC < lower limit of normal (c) in 400 patients presenting with persistent cough
| Diagnostic item | ORa (95% CI) | P-value | beta |
|---|---|---|---|
| (a) COPD panel diagnosis | |||
| Age (per 5 years) | 1.3 (1.2 to 1.4) | <0.001 | 0.2 |
| Male sex | 1.9 (1.1 to 3.1) | 0.005 | 0.6 |
| Current smoking | 2.7 (1.5 to 4.8) | <0.001 | 1.0 |
| >20 pack-years smoking | 2.1 (1.2 to 3.6) | 0.003 | 0.7 |
| Cardiovascular disease | 1.7 (0.9 to 3.2) | 0.04 | 0.6 |
| Wheezing (symptom) | 1.9 (1.1 to 3.2) | 0.004 | 0.6 |
| Wheezing on auscultation | 2.0 (1.0 to 4.0) | 0.02 | 0.7 |
| Diminished breath sounds | 2.0 (1.0 to 4.1) | 0.02 | 0.7 |
| Constant | –5.6 | ||
| ROC areaa (95% CI) | 0.79 (0.74 to 0.83) | ||
| (b) COPD FEV1/FVC < 0.7 | |||
| Age (per 5 years) | 1.3 (1.2 to 1.4) | <0.001 | 0.3 |
| Phlegm | 1.7 (1.0 to 2.3) | 0.07 | 0.5 |
| Current smoking | 1.7 (1.0 to 2.9) | 0.05 | 0.5 |
| >20 pack-years smoking | 2.2 (1.3 to 3.8) | 0.003 | 0.8 |
| Cardiovascular disease | 2.0 (1.1 to 3.6) | 0.02 | 0.7 |
| Wheezing (symptom) | 1.9 (1.2 to 3.1) | 0.004 | 0.6 |
| Constant | –6.0 | ||
| ROC areaa (95% CI) | 0.71 (0.66 to 0.76) | ||
| (c) COPD FEV1/FVC < LLN | |||
| Phlegm | 2.1 (1.0 to 4.2) | 0.03 | 0.7 |
| Current smoking | 1.7 (0.9 to 3.0) | 0.08 | 0.5 |
| >20 pack-years smoking | 1.6 (0.9 to 2.8) | 0.10 | 0.5 |
| Cardiovascular disease | 2.0 (1.1 to 3.6) | 0.02 | 0.7 |
| Wheezing (symptom) | 1.9 (1.1 to 3.2) | 0.01 | 0.7 |
| Constant | –2.7 | ||
| ROC areaa (95% CI) | 0.67 (0.61 to 0.73) | ||
COPD = chronic obstructive pulmonary disease. FEV1 = forced expiratory volume in 1 s. FVC = forced vital capacity. LLN = lower limit of normal. OR = multivariable odds ratio.
ORs and ROC areas adjusted for over-optimism. Example linear predictor from (a): estimated risk of COPD as panel diagnosis = 1/(1 + exp –(–5.6 + 0.2*every 5 years above 50 + 0.6*male sex + 1.0*current smoking + 0.7*>20 pack-years + 0.6*cardiovascular disease + 0.6*wheezing symptom + 0.7*wheezing on auscultation + 0.7*diminished breath sounds)).
Table 3.
Diagnostic risk classification of COPD by symptoms and signs for COPD defined as panel diagnosis, FEV1/FVC < 0.7, and FEV1/FVC < LLN, in 400 patients with persistent cough
| COPD panel diagnosis | COPD FEV1/FVC < 0.7 | COPD FEV1/FVC < LLN | ||||
|---|---|---|---|---|---|---|
| Estimated diagnostic risk by regression model | Participants, n (% of 400) | COPD present, n (%) | Participants, n (% of 400) | COPD present, n (%) | Participants, n (% of 400) | COPD present, n (%) |
| 0–20% (low) | 187 (47) | 16 (9) | 121 (30) | 13 (11) | 187 (47) | 20 (11) |
| 20–80% (intermediate) | 199 (50) | 92 (46) | 274 (69) | 117 (43) | 213 (53) | 63 (30) |
| 80–100% (high) | 14 (4) | 10 (71) | 5 (1) | 4 (80) | 0 (0) | 0 (0) |
| Total n | 400 | 118 | 400 | 134 | 400 | 83 |
FEV1 = forced expiratory volume in 1 second. FVC = forced vital capacity. LLN = lower limit of normal.
C-reactive protein
The mean CRP in all subjects was 9.8 mg/l (IQR of continuous results = 3–9 mg/l). Adding CRP continuously, >10 mg/l, and >20 mg/l to symptoms and signs resulted in a P-value for the LLR test of 0.16, 0.63, and 0.10 respectively and a three times unchanged ROC area of 0.79 (95% CI = 0.75 to 0.83). For COPD <0.7, the LLR test showed a P-value of 0.34, 0.27, and 0.03, respectively, and no relevant increase in ROC area (0.71 [95% CI = 0.66 to 0.76], 0.72 [95% CI = 0.67 to 0.77], and 0.71 [95% CI = 0.66 to 0.76]. For COPD <LLN, the LLR test P-values were 0.09, 0.09, and 0.03 and the ROC area did not increase significantly (0.67 [95% CI = 0.61 to 0.73], 0.67 [95% CI = 0.61 to 0.73], and 0.69 [95% CI = 0.63 to 0.75]. P-values for change in the ROC area after adding CRP to symptoms and signs were >0.20 in all cases. Figure 1 illustrates the ROC curves for COPD <LLN.
DISCUSSION
Summary
In primary care patients presenting with cough, short history taking and physical examination (age, sex, phlegm, cardiovascular disease, current smoking, >20 pack years of smoking, wheezing, and diminished breath sounds) had diagnostic value for early COPD but, combined, showed low sensitivity, failing to estimate a high diagnostic risk in most COPD cases. CRP was more often elevated in patients with COPD but added no information above symptoms and signs.
Strengths and limitations
This is the first study quantifying the independent added diagnostic value of CRP, above symptoms and signs. A major strength is the study design, conforming to standards for diagnostic studies (STARD guidelines), and comparing diagnostic tests against a gold standard in consecutive study patients seeking medical help for suggestive complaints (cough).26
The study has some limitations. First, an expert panel interpreted all test results to decide on the presence of COPD, because all the necessary information was considered to prevent misclassification. This possibly induced incorporation bias, which may have led to overestimation of the accuracy of the studied diagnostic variables for the COPD panel diagnosis.20 In the analysis of COPD defined by obstruction only, such incorporation bias was prevented. Defining COPD by obstruction only (lowered FEV1/FVC) is easier to repeat, but may have caused misclassification because symptoms were not included.
Secondly, the diagnostic pathway was adequate to diagnose COPD or asthma but not other possible causes of cough, like pneumonia and regurgitation. Therefore, the prevalence of alternative diagnoses as diagnosed by the panel was probably underestimated in the present study.
Thirdly, eligible patients who were not included were not registered, and therefore the size and direction of possible selection bias cannot be judged. For example, GPs may have selected patients based on their assessment of underlying COPD.
Comparison with existing literature
The study results on symptoms and signs confirm previous findings. Cough, age, sex, dyspnoea, pack-years of smoking, wheezing (auscultated and reported), and consultation for wheezing or cough were associated with COPD in primary6,12,15 and secondary care13,17,27,28 studies, and diminished breath sounds in secondary care studies.14,17,29
Some reported diagnostic items were not included in the present analysis, including forced expiratory time,27,28,30 laryngeal height,13 peak flow,17,27 and subxyphoid apical impulse,4 because they are not incorporated in standard physical examination. Moreover, some features of COPD were not assessed because they were considered unlikely in early COPD, such as barrel chest and accessory muscle use.4
Independently associated symptoms and signs, as well as ROC areas, varied when applying three different COPD definitions. Possible explanations include the different number of COPD cases, possible incorporation bias and overestimation in the case of the COPD panel definition, and misclassification. Moreover, the LLN COPD definition is dependent on age and sex, which partly explains the finding that age and sex had no diagnostic value for this endpoint.
The univariable relation between elevated CRP level and COPD in the study data confirms previous studies reporting higher CRP-values in (known) COPD,7,8,31,32 of which some considered high-sensitive CRP measurements (allowing for measurement of CRP level <3 mg/l).7,31 Some of these studies compared COPD cases with their age- and sex-matched controls,8,31 suggesting that the relationship was not caused by different age or sex distributions in COPD. One study found that the higher CRP level in COPD was independent of smoking, and that CRP was lower in patients with COPD who used inhaled steroids.7 A study by van Durme et al determined the independent prognostic value of high-sensitive CRP measurement for a 3-year COPD incidence, which was only present in current smokers.33 In the present study, the CRP level added no relevant information to symptoms and signs, implying overlap in diagnostic information. Finally, respiratory tract infections may have diluted the relation between CRP and COPD in the study patients presenting with cough.
Implications for practice
Symptoms and signs do not allow safe diagnosis or exclusion of COPD in patients presenting with persistent cough, but the symptoms and signs found can help to raise awareness of possible early COPD. Measurement of conventional CRP has no added diagnostic value for detection of early COPD.
Acknowledgments
We gratefully acknowledge all participating patients, GPs, and hospital professionals. Jan-Willem van den Bos assisted in training of the participating GPs. Rhea Wilken, research assistant, and Chantalle van de Pas and Nanoesjka van Gorcum, research physicians, assisted in data collection. WK van den Berg, SAA Cheragwandi, WH Dalinghaus, HEJ Sinninghe Damsté, and WJA Wijnands, pulmonologists, facilitated lung function tests and performed as experts in the expert panels.
Funding
This work was funded by The Netherlands Organisation for Health Research and Development grant number 945–04–0150 and received research grants from GlaxoSmithKline, Boehringer-Ingelheim, and Pfizer. The study sponsors had no involvement in the study design, the collection, analysis and interpretation of the data, the writing of the report, or the decision to submit the paper for publication.
Ethical approval
All participants signed informed consent and the ethics committee of the University Medical Centre Utrecht approved the study (protocol 05/142).
Provenance
Freely submitted; externally peer reviewed.
Competing interests
Alfred Sachs has been speaker on congresses, sponsored by GlaxoSmithKline, Boehringer-Ingelheim, Pfizer, or AstraZeneca. Theo Verheij participates in studies that received grants from GlaxoSmithKline and Wyeth. Other authors declare no potential competing interests.
Discuss this article
Contribute and read comments about this article on the Discussion Forum: http://www.rcgp.org.uk/bjgp-discuss
REFERENCES
- 1.Rabe KF, Hurd S, Anzueto A, et al. Global strategy for the diagnosis, management, and prevention of chronic obstructive pulmonary disease: GOLD executive summary. Am J Respir Crit Care Med. 2007;176(6):532–555. doi: 10.1164/rccm.200703-456SO. [DOI] [PubMed] [Google Scholar]
- 2.Bednarek M, Maciejewski J, Wozniak M, et al. Prevalence, severity and underdiagnosis of COPD in the primary care setting. Thorax. 2008;63(5):402–407. doi: 10.1136/thx.2007.085456. [DOI] [PubMed] [Google Scholar]
- 3.Levy ML, Quanjer PH, Booker R, et al. Diagnostic spirometry in primary care: Proposed standards for general practice compliant with American Thoracic Society and European Respiratory Society recommendations. Prim Care Respir J. 2009;18(3):130–147. doi: 10.4104/pcrj.2009.00054. [DOI] [PMC free article] [PubMed] [Google Scholar]
- 4.Holleman DR, Jr, Simel DL. Does the clinical examination predict airflow limitation? JAMA. 1995;273(4):313–319. [PubMed] [Google Scholar]
- 5.McAlister FA, Straus SE, Sackett DL. Why we need large, simple studies of the clinical examination: the problem and a proposed solution. CARE-COAD1 group. Clinical Assessment of the Reliability of the Examination-Chronic Obstructive Airways Disease Group. Lancet. 1999;354(9191):1721–1724. doi: 10.1016/s0140-6736(99)01174-5. [DOI] [PubMed] [Google Scholar]
- 6.Thiadens HA, de Bock GH, Dekker FW, et al. Identifying asthma and chronic obstructive pulmonary disease in patients with persistent cough presenting to general practitioners: descriptive study. BMJ. 1998;316(7140):1286–1290. doi: 10.1136/bmj.316.7140.1286. [DOI] [PMC free article] [PubMed] [Google Scholar]
- 7.Pinto-Plata VM, Mullerova H, Toso JF, et al. C-reactive protein in patients with COPD, control smokers and non-smokers. Thorax. 2006;61(1):23–28. doi: 10.1136/thx.2005.042200. [DOI] [PMC free article] [PubMed] [Google Scholar]
- 8.Karadag F, Kirdar S, Karul AB, Ceylan E. The value of C-reactive protein as a marker of systemic inflammation in stable chronic obstructive pulmonary disease. Eur J Intern Med. 2008;19(2):104–108. doi: 10.1016/j.ejim.2007.04.026. [DOI] [PubMed] [Google Scholar]
- 9.Gan WQ, Man SF, Senthilselvan A, Sin DD. Association between chronic obstructive pulmonary disease and systemic inflammation: a systematic review and a meta-analysis. Thorax. 2004;59(7):574–580. doi: 10.1136/thx.2003.019588. [DOI] [PMC free article] [PubMed] [Google Scholar]
- 10.Broekhuizen BD, Sachs AP, Hoes AW, et al. Undetected chronic obstructive pulmonary disease and asthma in people over 50 years with persistent cough. Br J Gen Pract. 2010;60(576):489–494. doi: 10.3399/bjgp10X514738. [DOI] [PMC free article] [PubMed] [Google Scholar]
- 11.Harrell FE., Jr . Regression modeling strategies. With applications to linear models, logistic regression, and survival analysis. New York, NY: Springer-Verlag; 2001. [Google Scholar]
- 12.Van Schayck CP, Loozen JM, Wagena E, et al. Detecting patients at a high risk of developing chronic obstructive pulmonary disease in general practice: cross sectional case finding study. BMJ. 2002;324(7350):1370–1374. doi: 10.1136/bmj.324.7350.1370. [DOI] [PMC free article] [PubMed] [Google Scholar]
- 13.Straus SE, McAlister FA, Sackett DL, Deeks JJ. The accuracy of patient history, wheezing, and laryngeal measurements in diagnosing obstructive airway disease. CARE-COAD1 Group. Clinical Assessment of the Reliability of the Examination-Chronic Obstructive Airways Disease. JAMA. 2000;283(14):1853–1857. doi: 10.1001/jama.283.14.1853. [DOI] [PubMed] [Google Scholar]
- 14.Badgett RG, Tanaka DJ, Hunt DK, et al. Can moderate chronic obstructive pulmonary disease be diagnosed by historical and physical findings alone? Am J Med. 1993;94(2):188–196. doi: 10.1016/0002-9343(93)90182-o. [DOI] [PubMed] [Google Scholar]
- 15.Buffels J, Degryse J, Heyrman J, Decramer M. Office spirometry significantly improves early detection of COPD in general practice: the DIDASCO Study. Chest. 2004;125(4):1394–1399. doi: 10.1378/chest.125.4.1394. [DOI] [PubMed] [Google Scholar]
- 16.Rutten FH, Cramer MJ, Grobbee DE, et al. Unrecognized heart failure in elderly patients with stable chronic obstructive pulmonary disease. Eur Heart J. 2005;26(18):1887–1894. doi: 10.1093/eurheartj/ehi291. [DOI] [PubMed] [Google Scholar]
- 17.Badgett RG, Tanaka DJ, Hunt DK, et al. The clinical evaluation for diagnosing obstructive airways disease in high-risk patients. Chest. 1994;106(5):1427–1431. doi: 10.1378/chest.106.5.1427. [DOI] [PubMed] [Google Scholar]
- 18.Miller MR, Hankinson J, Brusasco V, et al. Standardisation of spirometry. Eur Respir J. 2005;26(2):319–338. doi: 10.1183/09031936.05.00034805. [DOI] [PubMed] [Google Scholar]
- 19.Quanjer PH, Tammeling GJ, Cotes JE, et al. Lung volumes and forced ventilatory flows. Report Working Party Standardization of Lung Function Tests, European Community for Steel and Coal. Official Statement of the European Respiratory Society. Eur Respir J Suppl. 1993;16:5–40. [PubMed] [Google Scholar]
- 20.Weller SC, Mann NC. Assessing rater performance without a ‘gold standard’ using consensus theory. Med Decis Making. 1997;17(1):71–9. doi: 10.1177/0272989X9701700108. [DOI] [PubMed] [Google Scholar]
- 21.Roberts SD, Farber MO, Knox KS, et al. FEV1/FVC ratio of 70% misclassifies patients with obstruction at the extremes of age. Chest. 2006;130(1):200–206. doi: 10.1378/chest.130.1.200. [DOI] [PubMed] [Google Scholar]
- 22.Cohen J. A Coefficient of Agreement for Nominal Scales. Educ Psychol Meas. 2008;20(1):37–46. [Google Scholar]
- 23.van der Meer V, Neven AK, van den Broek PJ, Assendelft WJ. Diagnostic value of C reactive protein in infections of the lower respiratory tract: systematic review. BMJ. 2005;331(7507):26. doi: 10.1136/bmj.38483.478183.EB. [DOI] [PMC free article] [PubMed] [Google Scholar]
- 24.Greenland S, Finkle WD. A critical look at methods for handling missing covariates in epidemiologic regression analyses. Am J Epidemiol. 1995;142(12):1255–1264. doi: 10.1093/oxfordjournals.aje.a117592. [DOI] [PubMed] [Google Scholar]
- 25.R Development Core Team. R: a language and environment for statistical computing. Vienna: R Foundation for Statistical Computing; 2008. [Google Scholar]
- 26.Bossuyt PM, Reitsma JB, Bruns DE, et al. The STARD statement for reporting studies of diagnostic accuracy: explanation and elaboration. Ann Intern Med. 2003;138(1):W1–12. doi: 10.7326/0003-4819-138-1-200301070-00012-w1. [DOI] [PubMed] [Google Scholar]
- 27.Holleman DR, Jr, Simel DL, Goldberg JS. Diagnosis of obstructive airways disease from the clinical examination. J Gen Intern Med. 1993;8(2):63–68. doi: 10.1007/BF02599985. [DOI] [PubMed] [Google Scholar]
- 28.Straus SE, McAlister FA, Sackett DL, Deeks JJ. Accuracy of history, wheezing, and forced expiratory time in the diagnosis of chronic obstructive pulmonary disease. J Gen Intern Med. 2002;17(9):684–688. doi: 10.1046/j.1525-1497.2002.20102.x. [DOI] [PMC free article] [PubMed] [Google Scholar]
- 29.Garcia-Pachon E. Paradoxical movement of the lateral rib margin (Hoover sign) for detecting obstructive airway disease. Chest. 2002;122(2):651–655. doi: 10.1378/chest.122.2.651. [DOI] [PubMed] [Google Scholar]
- 30.Schapira RM, Schapira MM, Funahashi A, et al. The value of the forced expiratory time in the physical diagnosis of obstructive airways disease. JAMA. 1993;270(6):731–736. [PubMed] [Google Scholar]
- 31.Yasuda NF, Gotoh KF, Minatoguchi S, et al. An increase of soluble Fas, an inhibitor of apoptosis, associated with progression of COPD. Respir Med. 1998;92(8):993–999. doi: 10.1016/s0954-6111(98)90343-2. [DOI] [PubMed] [Google Scholar]
- 32.Gan WQ, Man SF, Senthilselvan A, Sin DD. Association between chronic obstructive pulmonary disease and systemic inflammation: a systematic review and a meta-analysis. Thorax. 2004;59(7):574–580. doi: 10.1136/thx.2003.019588. [DOI] [PMC free article] [PubMed] [Google Scholar]
- 33.van Durme YM, Verhamme KM, Aarnoudse AJ, et al. C-reactive protein levels, haplotypes, and the risk of incident chronic obstructive pulmonary disease. Am J Respir Crit Care Med. 2009;179(5):375–382. doi: 10.1164/rccm.200810-1540OC. [DOI] [PubMed] [Google Scholar]