

Abstract
A novel phenotype was recently identified in which specific strains of Escherichia coli inhibit competing E. coli strains via a mechanism that was designated “proximity-dependent inhibition” (PDI). PDI-expressing (PDI+) E. coli is known to inhibit susceptible (PDI−) E. coli strains, including several enterohemorrhagic (EHEC) and enterotoxigenic (ETEC) E. coli strains. In this study, every strain from a genetically diverse panel of E. coli O157:H7 (n = 25) and additional strains of E. coli serovar O26 were susceptible to the PDI phenotype. LIVE/DEAD staining was consistent with inhibition by killing of susceptible cells. Comparative genome analysis identified the genetic component of PDI, which is composed of a plasmid-borne (Incl1) operon encoding a putative microcin and associated genes for transport, immunity, and microcin activation. Transfer of the plasmid to a PDI− strain resulted in transfer of the phenotype, and deletion of the genes within the operon resulted in loss of the inhibition phenotype. Deletion of chromosomally encoded tolC also resulted in loss of the inhibitory phenotype, and this confirmed that the putative microcin is most likely secreted via a type I secretion pathway. Deletion of an unrelated plasmid gene did not affect the PDI phenotype. Quantitative reverse transcription (RT)-PCR demonstrated that microcin expression is correlated with logarithmic-phase growth. The ability to inhibit a diversity of E. coli strains indicates that this microcin may influence gut community composition and could be useful for control of important enteric pathogens.
Introduction
Sawant et al. recently described a novel inhibition phenotype in which defined strains of Escherichia coli from cattle are able to inhibit growth of other E. coli strains, including several strains of enterohemorrhagic E. coli (EHEC) and enterotoxigenic E. coli (ETEC) (32). During in vitro competition assays, susceptible strains declined an average 4 to 6 log CFU in population size relative to their expected population density when grown as monocultures. The inhibition phenotype was called “proximity-dependent inhibition” (PDI) because of the apparent need for inhibitor and susceptible strains to be located in close physical proximity for the phenotype to be observed. Two different E. coli strains were described as expressing this trait (PDI+); multidrug-resistant E. coli 25 and antibiotic-susceptible E. coli 264. E. coli 25 and E. coli 264 do not affect each other's growth, indicating that immunity is conferred either actively through the presence of an immunity mechanism or passively through the absence of a receptor ligand found on susceptible cells.
Cell-cell inhibition mechanisms have been documented in the literature and range from contact-dependent inhibition (1, 20) to production of narrow-spectrum antimicrobial proteins called bacteriocins. Bacteriocins typically restrict the growth of closely related bacteria (reviewed in references 28 and 31). E. coli produces numerous bacteriocins (31), classified as either colicins or microcins (2, 11). Colicins have high molecular mass, whereas microcins are typically <10 kDa. Microcins can be either chromosomally or plasmid encoded, whereas colicins have been found only on plasmids (13, 29, 30). Colicin production is usually correlated with an SOS response to stress (22, 34), and release of the colicin typically occurs through cell lysis. Microcins are secreted from intact cells (8, 27). Bacteriocins that kill competitors through pore formation or nuclease activity or by inhibiting protein synthesis have been identified (3, 23–25).
Certain characteristics of the PDI phenotype resemble those of microcin production. For example, inhibition is effective against closely related species, PDI is not dependent on an SOS response, and production presumably does not kill the inhibitor strain (32). Nevertheless, microcins are soluble proteins, and when Sawant et al. (32) employed a split-well experiment, they demonstrated that close cell-cell proximity is required for the PDI phenotype to function. These findings suggest that the inhibition mechanism is not due to a soluble molecule unless the concentration is so low as to require close proximity in order to be effective (32).
The initial report of PDI provided a detailed description of the phenotype, and a similar phenotype has been described between Bibersteinia trehalosi and Mannheimia haemolytica (4). Nevertheless, the exact mechanism of PDI and the requisite genes for inhibition and immunity are unknown. In the current study, we demonstrate that inhibition results from probable death of the susceptible cells, and we identify the PDI gene cluster, which resembles that of a class IIa microcin. The gene cluster includes open reading frames (ORFs) putatively encoding proteins for microcin synthesis, immunity, and export. In addition, tolC is required for inhibition, confirming that the microcin is secreted by a type I secretion system (T1SS). Based on these findings and the relatively unique amino acid composition of the protein, we conclude that the PDI phenotype is caused by a novel microcin that we have designated MccPDI.
MATERIALS AND METHODS
Bacterial strains, media, and culture conditions.
E. coli strains (Table 1) were cultured in Luria-Bertani (LB) medium (Fisher Scientific, Pittsburgh, PA) or in M9 minimal medium (6 g/liter Na2HPO4, 3 g/liter KH2PO4, 0.5 g/liter NaCl, 1 g/liter NH4Cl, 2 mg/liter thiamine, 1 mM MgSO4 0.1 mM CaCl2, and 0.2% glucose) at 37°C with shaking (200 rpm) unless otherwise indicated. Components for the M9 medium were purchased from Fisher Scientific (Pittsburgh, PA), Sigma-Aldrich (St. Louis, MO), and J. T. Baker Reagents and Chemicals (Phillipsburg, NJ). Antibiotics were added to the media at the following concentrations: ampicillin (Amp), 100 μg/ml (Fisher Biotech, Fair Lawn, NJ); kanamycin (Kan), 50 μg/ml (Fisher Scientific, Pittsburgh, PA); nalidixic acid (Nal), 30 μg/ml (MP Biomedicals, Solon, OH); and tetracycline (tet), 50 μg/ml (Fisher Scientific, Pittsburgh, PA). Strains that would otherwise be antibiotic susceptible were selected for nalidixic acid resistance through successive passages in LB medium with increasing nalidixic acid concentrations until the strains were capable of growth at 30 μg/ml.
Table 1.
E. coli strains and PCR primer sequences used in this work
| E. coli strain | Genotype/phenotype | Primer/homologous-extension name | Sequencea | Reference |
|---|---|---|---|---|
| 25 | Wild type; SSuTr PDI+ | PDI fwd | TAGTTGCAGGGGCATAAGAA | 17 |
| PDI rev | AGGAAACGCAAACAGCAACT | |||
| rpoD fwd | CAGGTTCAATGCTCCGTTGC | |||
| rpoD rev | GCGACCTTTCGCTTTGATGG | |||
| mcpM fwd | CCGTAATGACCGTTCCAGT | |||
| mcpM rev | CCATTTCCACTACCATGATCT | |||
| 25 ΔmcpA | SSuTr Kanr ΔmcpA PDI− | H1_ΔmcpA | GATATACATCTGACCTGTGTGATGTTAAAGTTTTATACTA | This work |
| H2_ΔmcpA | ATAGAAAAAATAAGAACAATCTCCGCGAAATAGCATTATG | |||
| 25 ΔmcpB | SSuTr Kanr ΔmcpB PDI− | H1_ΔmcpB | TGGTGATGAATTCCTGTCAAA | This work |
| H2_ΔmcpB | TACCAGTTTCACCCGTCACA | |||
| 25 ΔmcpD | SSuTr Kanr ΔmcpD PDI− | H1_ΔmcpD | TCAGCCATTCCCATAAATGACGAGTATCAAGGTTGACG | This work |
| H2_ΔmcpD | TTGACGGAAAGGTTACTTATTGTATTAAAAATAATG | |||
| 25 ΔmcpM | SSuTr Kanr ΔmcpM PDI− | H1_ΔmcpM | GTAATTTAATAAACATAGTAGCGCCCTCCATTATATCTAT | This work |
| H2_ΔmcpM | AACGCACAAAATAACAAACAACCGATAGGGGAAATATGAT | |||
| 25 ΔmcpM ΔmcpI | SSuTr Kanr ΔmcpM ΔmcpI PDI− | H1_ΔmcpMΔmcpI | ATTATCTTTACTATATTTATATATGTTATCATTCATAATG | This work |
| H2_ΔmcpMΔmcpI | AACGCACAAAATAACAAACAACCGATAGGGGAAATATGAT | |||
| 25 ΔmcpM ΔmcpI + pMcpI | SSuTr Kanr ΔmcpM ΔmcpI PDI−; immune to PDI | |||
| 25 ΔtolC | SSuTr Kanr ΔtolC PDI− | H1_ΔtolC | ATAACCCGTATCTTTACGTTGCCTTACGTTCA | This work |
| H2_ΔtolC | CTAGAATCCGCAATAATTTTACAGTTTGAT | |||
| 25 ΔtraM | SSuTr Kanr ΔtraM PDI+ | H1_ΔtraM | AATAACGTGATTGCATATTACTTATCTCAGGAGTTC | This work |
| H2_ΔtraM | ATCCCTGGAAGGACTACAACCTATGACCGAAAATAC | |||
| 4 | Wild type; SSuTr PDI− | 32 | ||
| 4pPDI ΔtraM | SSuTr Kanr ΔtraM pPDI PDI+ | This work | ||
| 6 | Wild type; SSuTr PDI− | 32 | ||
| 82 | Wild type; SSuTr PDI− | This work | ||
| 186 | Wild type; Nalr PDI− | 32 | ||
| 264 | Wild type; Nalr PDI+ | 32 | ||
| O157:H7 Sakai | Wild type; Nalr | 15 | ||
| K-12 | Nalr | 19 |
E. coli 25 gene-specific sequences (primers, homologous extensions [H1 and H2], PDI, rpoD, and mcpM loci) are shown. For gene deletion mutants, homologous extensions also had the following kanamycin primer sites 3′ to the E. coli 25-specific sequence: H1, TGTGTAGGCTGGAGCTGCTTCG; H2, CATATGAATATCCTCCTTA.
Competition assays to measure the inhibition phenotype.
Bacterial strains were grown individually overnight in LB medium. Equal volumes of each competing strain were inoculated into fresh M9 medium at a 1:200 dilution for a final 1:100 dilution of total cells. The cultures were then incubated at 37°C for 8 to 24 h. It was previously shown that the PDI phenotype does not differ significantly between 8- and 24-h competitions (32). Mixed cultures were then serially diluted, plated on LB medium supplemented with the appropriate antibiotic to select for each competing strain, and enumerated.
LIVE/DEAD staining and flow cytometry.
Viability assays were conducted using the LIVE/DEAD BacLight Bacterial Viability Kit (L34856; Molecular Probes, Invitrogen, Eugene, OR). Cell cultures were grown in M9 medium for 6 h at 37°C, and then 1 ml of each culture was collected by centrifugation, washed in 0.85% NaCl, and resuspended in 0.85% NaCl. The cells were then diluted 1:10 in 0.85% NaCl that contained 1.5 μl of 3.34 mM Syto 9 and 1.5 μl of 30 mM propidium iodide. Samples were incubated at room temperature in the dark for 15 min. Flow cytometry was performed on a FACSCalibur flow cytometer (BD Biosciences), and data were analyzed using FCS Express software (De Novo Software, Thornton, Ontario, Canada). Initial parameters were established by analyzing cell suspensions with known live- and dead-cell populations. These bacterial suspensions were prepared as follows: cells were grown in M9 minimal medium to late log phase, and 1-ml aliquots of the cultures were collected by centrifugation, washed in 0.85% NaCl, and resuspended in either 0.85% NaCl (live portion) or 70% isopropyl alcohol (dead portion). Samples were incubated at room temperature for 30 min and then processed and analyzed by flow cytometry as described above. The ratios of live to dead cells used for the standard were (live/dead) 0:100, 50:50, and 100:0. Gates specific to our E. coli strain (based on side and forward light scatter) were used to collect data on 50,000 cell events. Green versus red fluorescence was measured to distinguish between Syto 9-stained live cells and propidium iodide-Syto 9-stained dead cells. Nonspecific signal was excluded at the time of data acquisition.
Sequencing and analysis.
Genomic extractions of E. coli 25, E. coli 82, and E. coli 264 were prepared using the DNeasy Blood and Tissue kit (Qiagen, Valencia, CA) according to the manufacturer's instructions. Sequencing was conducted at the Genomics Core Laboratory at Washington State University using a Roche 454 FLX Titanium Genome Sequencer to a depth of 24×, represented by 399,076 reads. Sequences were assembled using Newbler (version 2.5.3). Annotation employed Glimmer version 3.02 for gene calling, and then the data were piped into CLC Genomics Workbench (CLC Bio, Cambridge, MA), where the resulting genes were screened against the current BLAST, SignalP, and Pfam databases for functional predictions.
Site-directed gene deletion.
Gene-specific knockouts were generated using the methods described by Datsenko and Wanner (5). Briefly, the gene of interest was replaced with a PCR-generated kanamycin resistance marker. PCR primers were designed to amplify the kanamycin resistance gene from the template plasmid, pKD4. Each primer incorporated 36 to 50 nucleotides (nt) of the region flanking the gene of interest (Table 1). The PCR products were column purified (Qiagen, Valencia, CA), digested overnight at 37°C with DpnI (New England BioLabs, Ipswich, MA), purified again, and suspended in 30 μl 10 mM Tris, pH 8.0. E. coli 25 carrying the λ Red plasmid pKD46 (Ampr) were grown in SOB (2% Bacto tryptone, 0.5% yeast extract, 10 mM NaCl, 2.5 mM KCl, 10 mM MgCl2, 10 mM MgSO4) with 1 mM l-arabinose at 30°C to an optical density at 600 nm (OD600) of ∼0.6. The cells were then made electrocompetent by washing twice with ice-cold water and once with 10% glycerol and concentrating the cells 100-fold in 10% glycerol. Electrocompetent cells (50 μl) were pulsed with ∼100 ng of PCR product using the Gene Pulsar 1 (Bio-Rad, Hercules, CA). SOC medium (12) was immediately added to the cells, which were then incubated for 2 h at 30°C. The cells were plated on LB medium with kanamycin and incubated overnight at 30°C to select for transformants. PCR amplification using primers within the kanamycin resistance gene combined with genomic primers adjacent to the sequence of interest was used to verify that the resistance cassette integrated at the desired location.
Complementation of mcpI knockout.
A pET100 Topo vector (Invitrogen, Grand Island, NY) was used for inducible expression of the putative immunity gene. The gene was PCR amplified from E. coli 25 using primers that produce a 3′ single-stranded overhang identical to the 5′ end of the pET100 vector, allowing directional joining of our gene of interest and the vector. Ligation and transformation were conducted according to the instructions for the Champion pET Directional Topo Expression kit. Briefly, 2 μl of PCR product was added to 1 μl salt solution (provided in the kit), 1 μl Topo vector, and 2 μl sterile water. This reaction mixture was incubated at room temperature for 25 min and then placed on ice for 30 min. An aliquot (3 μl) was added into 50 μl chemically competent E. coli Top10 and incubated on ice for 2 min. The cells were heat shocked for 30 s at 42°C and then transferred to ice. SOC medium (250 μl) was added, and the cells were incubated for 1 h at 37°C. The cells were then plated on LB agar containing ampicillin and incubated overnight at 37°C. Transformants were screened by PCR using the universal T7 forward and reverse primers to identify clones containing the pET100 vector with an insert. Five transformants were selected for sequencing to verify they contained the correct insert. The plasmid was then isolated using the PureYield Plasmid Miniprep System (Promega, Madison, WI) and transferred to a host cell by electroporation as described above. Transformants were selected by their growth on LB medium with ampicillin.
Transforming E. coli 4 with the PDI plasmid.
The pPDIΔtraM plasmid was purified using the MiniPrep Express Matrix (MP Biomedicals, Solon, OH). E. coli 4 was then made electrocompetent and transformed (as described above for the gene deletion mutants) with pPDIΔtraM. Successful transformants were selected on LB medium with kanamycin and PCR verified for the presence of the PDI region.
Plasmid-mating experiments.
E. coli 25 ΔmcpM and E. coli K-12 were grown overnight in LB medium with kanamycin or nalidixic acid, respectively. Equal amounts of the plasmid-bearing strain E. coli 25 ΔmcpM were mixed with non-plasmid-bearing E. coli K-12 and centrifuged for 3 min at 16,000 × g. The cells were washed and concentrated 100-fold in 10 mM MgSO4. Cell suspensions were then pipetted onto a nitrocellulose membrane placed on a nonselective LB agar plate. Following 24 h of incubation at 30°C, the cells were resuspended in sterile phosphate-buffered saline (PBS), and dilutions were plated on LB agar containing nalidixic acid and/or kanamycin. The conjugation efficiency was calculated by dividing the number of CFU of transconjugants by the number of CFU of donor cells. Plasmid profiles were prepared for a subset of transconjugants to confirm the presence of the plasmid. Profiles were conducted as described by Kado and Liu (14). The same experiments, using kanamycin and tetracycline for selection, were then repeated using the K-12 pPDIΔmcpM transconjugant and E. coli 6 to determine whether the plasmid is self-mobilizable.
Agar plate diffusion assay.
We also tested for the presence of a soluble inhibitor on solid agar using a spot-on-lawn test. Overnight culture of microcin-producing and non-microcin-producing strains were individually spotted (15 μl) onto a freshly plated lawn of the PDI-susceptible strain, E. coli 6 (∼105 cells). The plates were incubated overnight at 37°C and were then examined for zones of growth inhibition surrounding the culture spots.
RNA isolation, first-strand cDNA synthesis, and microcin RT-qPCR.
E. coli 25 encoding McpM was inoculated into 5 ml of M9 minimal medium containing tetracycline and incubated overnight at 37°C. One milliliter of overnight culture was inoculated into 300 ml of room temperature M9 medium and incubated at 37°C. Aliquots containing approximately 108 to 109 cells were removed immediately after inoculation (0 h) and 2 h, 4 h, 6 h, 8 h, 10 h, 12 h, and 24 h postinoculation. The cells were pelleted by centrifugation at 4°C, and total RNA was isolated and DNase treated using a RiboPure-bacteria kit (Ambion) according to the manufacturer's instructions. RNA concentrations were determined using a NanoDrop ND-1000 spectrophotometer. RNA samples from a given time course experiment were diluted to the same concentration as the least concentrated sample. To assess DNA contamination in RNA samples prior to cDNA synthesis and expression analysis, RNA concentrations equivalent to those used in the corresponding cDNA reverse transcription-quantitative PCRs (RT-qPCRs) were run under conditions identical to those used for RT-qPCR analysis using polymerase sigma subunit rpoD primers (Table 1). RNA samples with cycle threshold (Ct) values of less than 37.5 cycles were again treated with DNase, and the Ct values were reanalyzed prior to cDNA synthesis. First-strand cDNA synthesis was completed using 8 μl of RNA (2 to 20 ng/μl), random hexamers, and SuperScript III reverse transcriptase (Invitrogen) in a final reaction volume of 20 μl according to the manufacturer's instructions. To verify the specificity of the mcpM primers (Table 1), a single PCR product of the correct size (213 bp) was detected in PDI+ strains but not in PDI− strains when analyzed on agarose gels. rpoD primers, described above, amplified a single PCR product of the correct size (336 bp) when analyzed on agarose gels from all PDI+ and PDI− E. coli strains tested. The amplification efficiencies of primer sets were then determined using plasmid DNA encoding their respective targets under conditions identical to those used for RT-qPCR.
All RT-qPCRs were performed as singleplex reactions in triplicate in 96-well plates. Positive controls and no-template controls were included in duplicate for each primer set. Each reaction was performed using 2 μl of cDNA, a 500 nM final concentration per primer, and SsoFastEva Green Supermix (Bio-Rad) in a final volume of 20 μl. All PCRs were performed on a CFX96 Real-Time PCR Detection System with version 2.1 software (Bio-Rad) with the following cycling conditions: 95°C for 30 s and 40 cycles of 95°C for 1 s, 55°C for 5 s, and 72°C for 15 s. Normalized (ΔΔCt) microcin expression was automatically computed using the Bio-Rad CFX Manager Software version 2.1 with rpoD as the reference gene.
Nucleotide sequence accession number.
The annotated plasmid sequence was deposited in GenBank (accession no. JQ901381).
RESULTS
PDI is effective against a broad range of E. coli strains.
Because E. coli O157:H7 is represented by a diverse array of genetic types (33), we first determined if the PDI phenotype was effective against the representative panel of strains. Strains representing bovine-biased and clinically biased genotypes (33) from both the United States and New Zealand were highly susceptible to the PDI phenotype, with an average reduction of >5 log CFU compared to the population for their respective monocultures (Fig. 1). We also tested three strains of E. coli O26 and found similar reductions in population numbers (Fig. 1).
Fig 1.
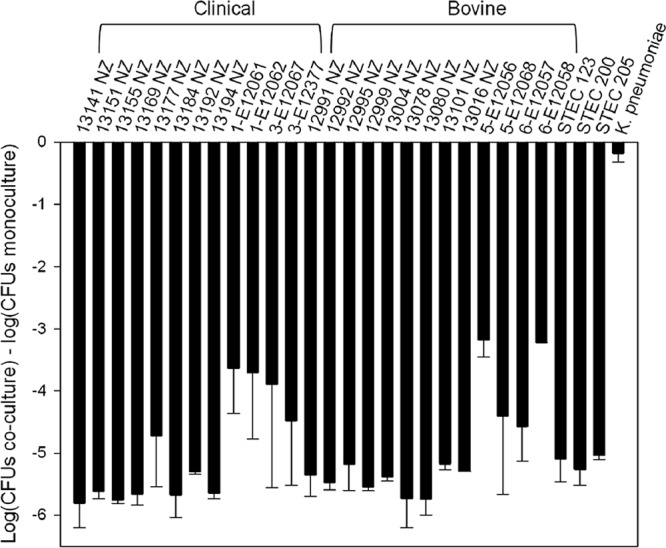
PDI is effective against a broad panel of O157:H7 and Shiga toxin-producing (STEC) E. coli O26 isolates. On average, susceptible populations were reduced more than 5 log CFU following 24-h coculture with E. coli 25. Clinically and bovine-biased O157 genotypes are indicated (33). Klebsiella pneumoniae was not inhibited by PDI and is included as a negative control. The error bars correspond to the standard errors of the mean based on duplicate experiments.
LIVE/DEAD staining indicates that PDI is bactericidal.
Although susceptible cells show a substantial reduction in their CFU/ml following competition with PDI+ strains, it was not clear if the effect is bacteriostatic or bactericidal. LIVE/DEAD staining was used in conjunction with flow cytometry to address this question using E. coli 25 and E. coli O157:H7 Sakai in mono- or coculture. The percentages of dead cells detected from the two monocultures were 0.50% ± 0.06% and 0.11% ± 0.01%, respectively (mean ± standard error of the mean [SEM]). When cocultured for 6 h, the proportion of dead cells increased to 1.27% ± 0.09%, consistent with killing of E. coli O157:H7 Sakai. When this susceptible strain was cocultured with a PDI− strain (E. coli 6), the percentage of dead cells was 0.33% ± 0.03%. These results, which were based on three independently replicated assays, indicate that PDI most likely functions by killing susceptible cells, although our ability to detect cells with permeable membranes was clearly limited in magnitude.
Identification of the microcin-encoding gene cluster.
In addition to the two PDI+ strains, E. coli 82 was identified from earlier work (16) as genetically similar (no differences) to E. coli 25 based on XbaI macrorestriction and the pulsed-field gel electrophoresis (PFGE) profile (unpublished data). Despite having a comparable genetic profile, E. coli 82 does not express the PDI phenotype. Genome sequencing of these two strains allowed an in-depth comparison that identified one relatively large region of sequence difference that was located on a large plasmid in E. coli 25. Although previous work using a different method did not detect the presence of plasmids in E. coli 25 (32), these results were verified by plasmid purification (14) and subsequent Southern analysis probing for mcpA (data not shown). PCR amplification of the PDI locus (the primers are shown in Table 1) confirmed that the region is present in the PDI+ strains E. coli 25 and E. coli 264, but not the PDI− strains E. coli 6, E. coli 82, and E. coli 186.
The E. coli 25 IncI1 microcin-containing plasmid is 98,809 bp with a G+C content of 49% and a coding density of 88%. Annotation of the 132 coding sequences revealed that most of the plasmid content is devoted to genes involved in transfer, including a tra system and a pil system, or encodes proteins of unknown function. The novel region of interest is a locus of approximately 4,800 bp that includes five genes (Fig. 2). Two genes, which we have designated mcpB and mcpD, encode homologs of HlyB and HlyD that are known to be the structural components of a microcin transfer system that interact with chromosomally encoded TolC (7, 10, 18, 26). McpA, which contains a CaaX protease domain (PF02517), is thought to be the “activity” protein that processes the microcin, encoded by mcpM, to its mature form prior to transfer from the cell. The corresponding MccPDI microcin is composed of 121 amino acids with a predicted mass of 11,981 Da. The predicted isoelectric point (pI) is 8.92, and the predicted charge at pH 7.0 is 2.9. The amino acid composition includes 35% polar amino acids (measured by mass or frequency) and ∼24% hydrophobic and ∼25% charged amino acids. mcpI likely encodes an immunity protein. The locus we identified appears to be unique among all the described microcins, with the exception of one recently described sequence, microcin S (MccS), from E. coli DEC10F (accession no. AIGU01000076) (37). MccS shares 80% amino acid identity with MccPDI (Fig. 2). The microcin S gene cluster also encodes a protein that shares 56% identity with the activity protein McpA and 79% identity with the McpB and McpD transport proteins.
Fig 2.

Genetic organization of the PDI gene cluster (∼5 kb). (Top) Whole-genome sequencing identified a large plasmid containing a unique region that is present in PDI+ strains but not PDI− strains. Bioinformatics identified five open reading frames putatively corresponding to genes for microcin synthesis (mcpM and mcpA), immunity (mcpI), and export (mcpD and mcpB). (Bottom) The amino acid sequence of microcin PDI aligned with the recently described microcin S (80% identity). The putative 18-residue leader peptide is underlined. In class IIa microcins, cysteines commonly form disulfide bonds in the C-terminal sequence, and they are highlighted by asterisks.
Knockout mutations from E. coli 25 block PDI.
Four of the five putative microcin genes (Fig. 2) were individually knocked out in E. coli 25 to analyze their roles in PDI. The mcpI gene knockout was constructed as a double knockout, ΔmcpM ΔmcpI. Each region of interest was replaced with a kanamycin resistance cassette and verified by PCR for the correct insertion site. Subsequently, each knockout mutant was cocultured with PDI− E. coli 186 to determine whether the deletion affected the PDI phenotype. CFU counts following coculture in M9 medium showed that E. coli 186 was greatly inhibited by E. coli 25 but was no longer inhibited by the ΔmcpD, ΔmcpB, ΔmcpM, ΔmcpM ΔmcpI, and ΔmcpA mutants (Fig. 3A). Conversely, each mutant was also competed with E. coli 264 to determine how each knockout affected immunity to PDI (Fig. 3B). Only the ΔmcpM and ΔmcpM ΔmcpI strains became susceptible to PDI, indicating that the other knockout strains retained immunity. Immunity was fully restored when mcpI was complemented back into the ΔmcpM ΔmcpI strain, verifying that the gene is required for resistance to killing by PDI+ strains (Fig. 3B). Expression of mcpI in a PDI− strain did not confer immunity, indicating that in trans expression of this gene alone is insufficient to prevent inhibition from the microcin (data not shown).
Fig 3.
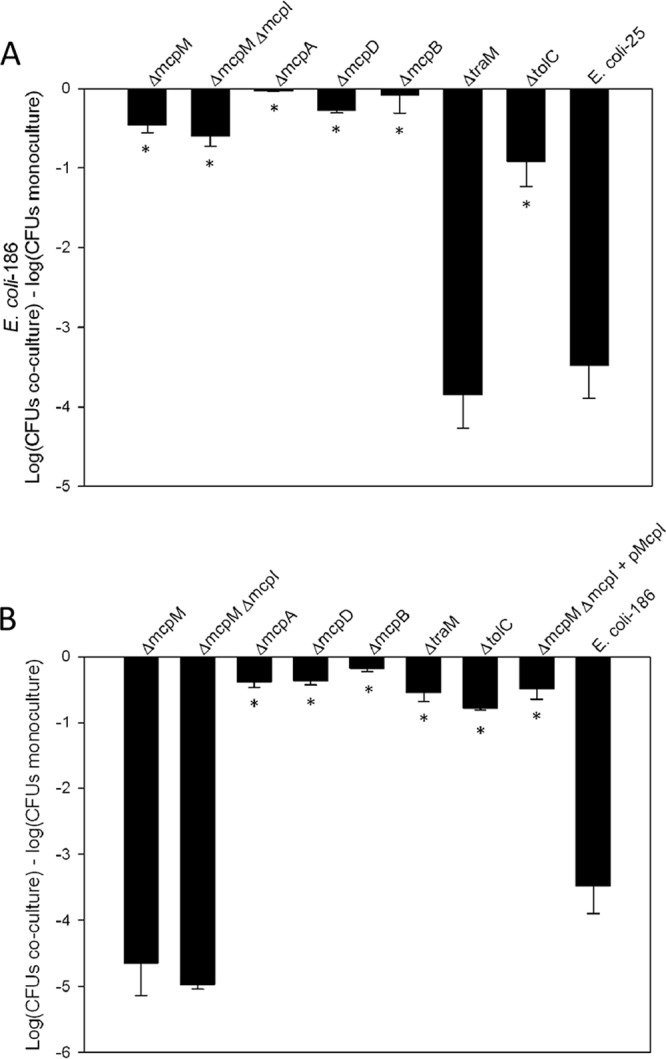
Targeted gene deletion results in the loss of the PDI phenotype. (A) CFU of PDI− E. coli 186 following coculture with wild-type E. coli 25 or E. coli 25 knockout mutants. The results are expressed as the difference in log CFU of the sensitive strain grown in coculture and monoculture. (B) Competitions with PDI+ E. coli 264 indicate which knockout mutants no longer exhibit immunity to PDI. Immunity to PDI is restored in the mcpI-complemented clone. The results are expressed as the difference in log CFU during coculture and individual culture. Experiments were conducted in triplicate, with the error bars representing the standard errors of the mean. *, statistically significant analysis of variance (ANOVA) (P < 0.01 with Dunnett's upper one-sided multiple-comparison test with control).
Class II microcins are typically secreted by a T1SS, and the presence of the putative ABC transporter and membrane fusion genes, mcpB and mcpD, is consistent with this structure in E. coli 25. To function properly, these secretion systems require the presence of a chromosomally encoded TolC protein on the cell surface (7, 10, 18, 26). Consequently, we constructed a ΔtolC strain, and this disrupted the ability of E. coli 25 to inhibit E. coli 186 (Fig. 3A), but it did not influence immunity (Fig. 3B). These results are consistent with the requirement for a T1SS for PDI function. To verify that our gene knockout procedure was not producing artifacts, we also generated a gene deletion in an unrelated region of the plasmid. As expected, deleting traM did not affect inhibition or immunity (Fig. 3).
Transferring the PDI plasmid to a noninhibitor E. coli strain confers the inhibitory phenotype.
Although the above-mentioned knockout mutants verified that we had identified genes involved with PDI, we could not confirm from our mutants that all the genes unique to PDI were included on pPDI. Generating the traM mutant in E. coli 25 provided a selectable marker on pPDI that did not interfere with the PDI phenotype (see above). Following transformation with pPDIΔtraM, E. coli 4 acquired the ability to inhibit susceptible strains and immunity to inhibition by E. coli 264 (Table 2). These data indicate that all the PDI-specific genes are present on pPDI. Nevertheless, we cannot rule out the possibility that other chromosomally encoded genes common to E. coli 25 and E. coli 4 are involved with PDI expression or function.
Table 2.
Competition results for wild-type E. coli 4 and E. coli 4 carrying the PDI plasmid verifies that the PDI genes are present on the plasmid
| Competition | Resultsa |
|
|---|---|---|
| E. coli 4 | Competitor | |
| E. coli 4 (PDI−) | ||
| vs. E. coli 186 (PDI−) | 8.83 ± 0.05 | 8.64 ± 0.06 |
| vs. E. coli 264 (PDI+) | 4.70 ± 0.28 | 9.14 ± 0.02 |
| E. coli 4 + pPDI | ||
| vs. E. coli 186 (PDI−) | 9.18 ± 0.06 | 4.03 ± 0.61 |
| vs. E. coli 264 (PDI+) | 8.88 ± 0.03 | 8.76 ± 0.02 |
CFU of PDI− E. coli 186 following coculture with wild-type E. coli 4 or E. coli 4 + pPDI verifies the plasmid confers the inhibitory phenotype. Immunity to PDI is also maintained on the plasmid, as indicated by the ability of E. coli 4 + pPDI to survive coculture with the PDI+ strain E. coli 264. The results are expressed as log10 CFU/ml ± SEM of 3 replicates.
The PDI ΔmcpM plasmid is self-transmissible.
Filter-mating experiments between the ΔmcpM mutant and E. coli K-12 showed that the PDI plasmid is mobile with a conjugation efficiency ranging between 4.81 × 10⁻⁶ and 3.66 × 10⁻⁶. Plasmid profiles of K-12 Kanr verified the presence of a single plasmid of ∼100 kb, consistent with the PDI plasmid. Another series of conjugation experiments between the K-12 transformants and E. coli 6 confirmed that the plasmid is self-transmissible. Using this assay, we did not detect conjugation of the PDI plasmid when there was a functional microcin system, presumably because recipient cells are killed (strain K-12 is susceptible to PDI).
Agar diffusion assays confirm the presence of a soluble inhibitor.
Sawant et al. (32) reported that they could not detect evidence for a soluble inhibitor using an agar assay where the presence of an inhibitory molecule is evident from a zone of clearance with inhibitor and susceptible strains growing in close proximity. Given the apparent role of a soluble microcin in the PDI phenotype, we employed an alternative diffusion assay using M9 agar with the susceptible strain E. coli 6 spread across the plate. A panel of strains were spotted onto the plate, and small but clearly distinct zones of clearance were evident for the PDI+ strains E. coli 25, E. coli 264, and E. coli 25 ΔtraM (Fig. 4). Zones of clearance were absent for two PDI− strains (E. coli 6 and E. coli 186) and for the MccPDI deletion mutant E. coli 25 ΔmcpM.
Fig 4.
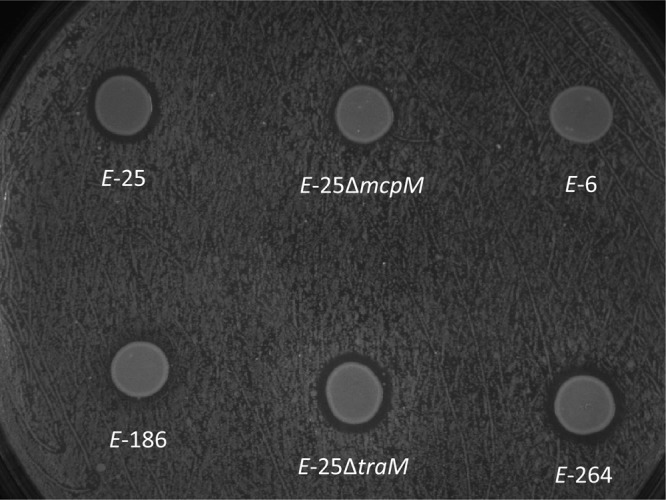
Agar diffusion assays are consistent with the presence of a soluble microcin. A zone of inhibition was present around the PDI+ strains E. coli 25, E. coli 25 ΔtraM, and E. coli 264 following overnight growth on a lawn of E. coli 6 that was spread onto M9 agar. This clearing was not observed around the PDI− strains E. coli 6 and E. coli 186 or the microcin knockout strain E. coli 25 ΔmcpM.
Kinetics of expression of mcpM.
Expression of the PDI phenotype has been observed throughout log-phase growth, but this function appears to subside when cells enter stationary phase (32). The earlier work was limited by the analytic sensitivity of the phenotypic assay, and thus, to better describe the kinetics of microcin expression, we employed a quantitative-PCR assay. RT-qPCR data confirmed that expression of the microcin increases rapidly during log-phase growth and drops off rapidly in stationary phase (Fig. 5).
Fig 5.
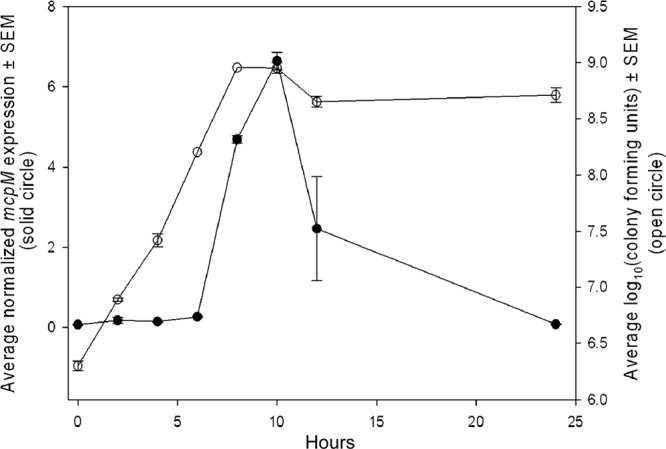
Expression of mcpM by E. coli 25 is correlated with the logarithmic growth phase. Expression of mcpM was measured during 24-h culture in M9 medium. The solid circles are the mean normalized mcpM expression ± SEM (n = 2 replicates). The open circles are the mean CFU ± SEM (n = 2 replicates).
DISCUSSION
We have identified the genetic components that are responsible for the PDI phenotype observed from E. coli 25 and E. coli 264. This 4.8-kb operon is present on pPDI and is comprised of the genes mcpM, mcpI, mcpA, mcpD, and mcpB. We hypothesize that inhibition is mediated by the microcin encoded by mcpM, whose mature gene product we have designated MccPDI. A DNA probe designed from the sequence of the mcpA gene hybridized to an ∼100-kb plasmid in both inhibitor strains. Plasmid DNA from the susceptible noninhibitor strains, E. coli 6 and E. coli 82, did not hybridize to the mcpA-specific probe (data not shown). pPDI was subsequently marked with a kanamycin resistance cassette (ΔtraM) and transferred to the PDI− strain E. coli 4. Wild-type E. coli 4 does not exhibit the inhibitory phenotype, as indicated by competition assays with the susceptible E. coli 186 (Table 2). E. coli 4 also exhibits susceptibility to PDI, based on CFU counts following coculture with PDI+ E. coli 264. Following transformation with pPDIΔtraM, E. coli 4 acquired the inhibitory phenotype and immunity (Table 2). Together, these results confirm that PDI and self-immunity are encoded by the 98.8-kb plasmid.
To assess the necessity of each gene for PDI function, we constructed genetic knockouts and found that disrupting any gene within the PDI operon blocked the inhibitory phenotype and, additionally, that immunity to PDI was lost in the mcpM and mcpI mutants (Fig. 3B). This indicated that all of the genes were important for PDI but immunity was dependent on only one or two genes. Due to the direct downstream location of mcpI, loss of immunity in the mcpM mutant was likely caused by a polar effect from ΔmcpM. This is consistent with our ability to complement immunity in the ΔmcpM ΔmcpI strain by in trans expression of mcpI alone. Although mcpI likely does not play a direct role in killing, it is necessary for self-immunity and for this reason is required for PDI. Deleting traM, a gene located ∼20 kb upstream of the PDI operon, did not affect either inhibition or immunity, indicating that our methods did not interfere with PDI. Furthermore, the tolC, mcpB, and mcpD mutants lost the ability to inhibit but retained immunity, consistent with a role in toxin transport.
Based on gene cluster and sequence analyses, MccPDI is best characterized as a Gram-negative class IIa microcin. The PDI gene cluster is relatively simple, consisting of two genes for export, one for immunity, one presumptively for microcin activation, and the microcin gene itself. The dedicated transport system involves the products of two plasmid-borne genes, mcpB and mcpD, that share homology with hlyB and hlyD of the E. coli α-hemolysin T1SS (9). This multicomponent export system is organized similarly to transport systems for other class II microcins, including MccE492, MccL, and MccV (10, 18, 26). McpB contains the transmembrane domains and nucleotide-binding domains, including the highly conserved Walker A and B motifs and ABC signature, characteristic of the ABC transporter superfamily of proteins (21). McpD is thought to act as a membrane fusion protein, forming a channel through the periplasm and connecting to the outer membrane protein TolC, the third component of class II microcin export machinery (7, 10, 18, 26). In total, these proteins form the export system, allowing protein transport from the cytoplasm across the periplasmic space and into the extracellular medium.
Within the N-terminal sequence, McpM shows homology to other microcin precursors that encode a putative signal peptide (6), and this is consistent with T1SS transport (Fig. 2). The presence of a conserved double glycine suggests the McpM precursor contains an 18-residue signal peptide that is cleaved to produce a mature MccPDI that is 103 amino acids in length (∼9.96 kDa); however, this has yet to be demonstrated empirically. In the activity region (C-terminal sequence), there is no recognizable sequence identity with other class II microcins (<26% amino acid sequence identity) (6), except for the recently described MccS (37). We have only observed MccPDI affecting E. coli and Shigella (data not shown), and presumably this is due to interaction with a unique ligand that is found only with these species.
Class IIa microcin gene clusters are typically composed of only four genes: two necessary for microcin export, one for immunity, and one encoding the microcin. The PDI operon is unique because it also includes a gene presumably involved with microcin processing or export. Deleting mcpA in E. coli 25 interrupts the inhibitory phenotype but does not affect immunity. It is possible this mutant has downstream effects on the microcin transport system (i.e., a polar effect). Nevertheless, bioinformatics analysis suggests the protein product may be involved with posttranslational modification of McpM. McpA has limited similarity to McmM and MceF (both 29% identity) of the MccM and MccE492 gene clusters, respectively. Wilkens et al. (36) showed that an mceF mutant had a noninhibitory phenotype, and the microcin product collected from the cell lysate was found at a higher molecular weight than mature MccE492, suggesting the presence of an inactive microcin precursor. Consistent with a role in protein modification, McpA contains a CaaX amino-terminal protease domain (PF02517) that functions in posttranslation modification of proteins with the CaaX sequence motif (35). Furthermore, the McpM C terminus includes a modified terminal CaaX sequence, suggesting McpM may be processed either before or during transport, resulting in the fully mature MccPDI (Fig. 2). An mcpA homolog, mcsI, is also present in the microcin S gene cluster; however, this gene has been annotated as the self-immunity gene. Zschuttig et al. (37) characterized the functions of the microcin S genes by expressing portions of the coding regions in a non-MccS-producing strain and observing their effects on the ability of E. coli E2348/69 to adhere to epithelial cells in vitro. The putative homolog of the immunity gene mcpI was not identified in the microcin S gene cluster.
Although microcins are released extracellularly to inhibit competing bacteria, no antimicrobial compounds were detected through membrane-divided (“split-well”) cultures or spent-medium assays in previous work (32). It is possible the PDI microcin requires contact between competing cells or some other signal to become active in the medium. Alternatively, Sawant et al. (32) suggested the possibility that a secreted inhibitor could be present but that their methods may have interfered with its detection or that the concentration of secreted inhibitor was too limited to have a biological effect except when PDI+ cells were in close proximity to PDI− cells. While we did not quantify the MccPDI concentration in the present study, application of conditioned medium from PDI+ bacterial culture had no measurable effect on PDI− bacterial culture (32), which is consistent with low concentrations of MccPDI. The current work suggests another possibility, because MccPDI has an unusually high proportion of charged amino acids (∼25%) and this may cause the protein to adhere to the membranes used by Sawant et al. (32), which would prevent MccPDI from diffusing through the 0.4-μm membrane that separated PDI+ and susceptible populations.
Sawant et al. (32) also reported that the PDI phenotype was enhanced significantly when cocultured in M9 defined medium compared with LB medium. No mechanism was identified for this difference, although the authors surmised that nutrient limitations might play a role in expression differences or that PDI+ population growth could partially mask the PDI phenotype in LB medium. An alternative explanation is that differences between the media (e.g., salt concentrations) might affect MccPDI functionality. Sawant et al. (32) also reported that they could not detect evidence of PDI based on zones of inhibition using solid medium. In the present study, we employed an agar diffusion assay using M9 medium instead of LB medium. Small but very distinct zones of inhibition were evident for the MccPDI-producing strains (Fig. 4), consistent with microcin secretion.
We have not identified the mechanism by which MccPDI inhibits susceptible bacteria. Our flow cytometry data are consistent with a statistically significant increase in the number of dead cells during coculture of PDI+ and PDI− populations, and thus, we hypothesize that the mechanism is bactericidal rather than bacteriostatic. While the flow cytometry results were robust, we detected relatively small numbers of dead cells, even for a range of time points (3 to 8 h) (data not shown). This could result if growth from the PDI+ population masked the proportion of dead cells during coculture. Alternatively, it is possible that dead cells are quickly lysed and therefore would not be detected.
Like other microcins, MccPDI is a low-molecular-weight protein that inhibits the growth of closely related species. However, where the activity of some microcins extends to a range of Gram-negative bacteria, including Escherichia, Klebsiella, Salmonella, and Pseudomonas (6), MccPDI appears to inhibit only Escherichia, and limited testing has also shown inhibition of Shigella, but not Salmonella or Klebsiella (data not shown). In this study, the PDI+ strain E. coli 25 was competed against a panel of pathogenic E. coli O157:H7 (n = 25) and E. coli O26 (n = 3) strains. All the strains were susceptible to killing (Fig. 1), and the average reduction following coculture was greater than 5 log CFU. The degree of killing may actually be much greater, as our methods to determine cell counts were limited to 2 × 10³ CFU/ml. Nonetheless, PDI effectively inhibits greater than 99% of the susceptible population. Because many of these pathogens are significant in diseases of both animals and humans (33), MccPDI could have potential applications in clinical medicine, production medicine, and food safety. An important caveat to this idea is that native mcpM transcription occurs primarily during rapid growth of the inhibitor population (Fig. 5), and it is not clear if or when this condition is met in vivo. Further research is needed to identify the mechanism by which MccPDI kills PDI− E. coli.
ACKNOWLEDGMENTS
L. Orfe provided technical assistance.
This project was funded in part by the National Pork Board (NPB project 10-086), by USDA NIFA 2010-04487, by the Washington State Agricultural Research Center, and by the Washington State University College of Veterinary Medicine Agricultural Animal Health Program.
Footnotes
Published ahead of print 6 July 2012
REFERENCES
- 1. Aoki SK, et al. 2005. Contact-dependent inhibition of growth in Escherichia coli. Science 309:1245–1248 [DOI] [PubMed] [Google Scholar]
- 2. Asensio C, Perez-Diaz JC. 1976. A new family of low molecular weight antibiotics from enterobacteria. Biochem. Biophys. Res. Commun. 69:7–14 [DOI] [PubMed] [Google Scholar]
- 3. Bullock JO, Cohen FS, Dankert JR, Cramer WA. 1983. Comparison of the macroscopic and single channel conductance properties of colicin E1 and its COOH-terminal tryptic peptide. J. Biol. Chem. 258:9908–9912 [PubMed] [Google Scholar]
- 4. Dassanayake RP, et al. 2010. Bibersteinia trehalosi inhibits the growth of Mannheimia haemolytica by a proximity-dependent mechanism. Appl. Environ. Microbiol. 76:1008–1013 [DOI] [PMC free article] [PubMed] [Google Scholar]
- 5. Datsenko KA, Wanner BL. 2000. One-step inactivation of chromosomal genes in Escherichia coli K-12 using PCR products. Proc. Natl. Acad. Sci. U. S. A. 97:6640–6645 [DOI] [PMC free article] [PubMed] [Google Scholar]
- 6. Duquesne S, Destoumieux-Garzon D, Peduzzi J, Rebuffat S. 2007. Microcins, gene-encoded antibacterial peptides from enterobacteria. Nat. Prod. Rep. 24:708–734 [DOI] [PubMed] [Google Scholar]
- 7. Gaggero C, Moreno F, Lavina M. 1993. Genetic analysis of microcin H47 antibiotic system. J. Bacteriol. 175:5420–5427 [DOI] [PMC free article] [PubMed] [Google Scholar]
- 8. Garrido MC, Herrero M, Kolter R, Moreno F. 1988. The export of the DNA replication inhibitor Microcin B17 provides immunity for the host cell. EMBO J. 7:1853–1862 [DOI] [PMC free article] [PubMed] [Google Scholar]
- 9. Gentschev I, Dietrich G, Goebel W. 2002. The E. coli alpha-hemolysin secretion system and its use in vaccine development. Trends Microbiol. 10:39–45 [DOI] [PubMed] [Google Scholar]
- 10. Gilson L, Mahanty HK, Kolter R. 1990. Genetic analysis of an MDR-like export system: the secretion of colicin V. EMBO J. 9:3875–3884 [DOI] [PMC free article] [PubMed] [Google Scholar]
- 11. Gratia A. 1925. Sur un remarquable exemple d'antagonisme entre deux souches de colibacille. C. R. Soc. Biol. (Paris) 93:1040–1041 [Google Scholar]
- 12. Hanahan D. 1983. Studies on transformation of Escherichia coli with plasmids. J. Mol. Biol. 166:557–580 [DOI] [PubMed] [Google Scholar]
- 13. Hardy KG, Meynell GG, Dowman JE, Spratt BG. 1973. Two major groups of colicin factors: their evolutionary significance. Mol. Gen. Genet. 125:217–230 [DOI] [PubMed] [Google Scholar]
- 14. Kado CI, Liu ST. 1981. Rapid procedure for detection and isolation of large and small plasmids. J. Bacteriol. 145:1365–1373 [DOI] [PMC free article] [PubMed] [Google Scholar]
- 15. Kawamura T. 1997. The clinical course and laboratory data of hemorrhagic colitis caused by Escherichia coli O157:H7. Rinsho Byori 45:865–868 [PubMed] [Google Scholar]
- 16. Khachatryan AR, Besser TE, Call DR. 2008. The streptomycin-sulfadiazine-tetracycline antimicrobial resistance element of calf-adapted Escherichia coli is widely distributed among isolates from Washington state cattle. Appl. Environ. Microbiol. 74:391–395 [DOI] [PMC free article] [PubMed] [Google Scholar]
- 17. Khachatryan AR, Hancock DD, Besser TE, Call DR. 2006. Antimicrobial drug resistance genes do not convey a secondary fitness advantage to calf-adapted Escherichia coli. Appl. Environ. Microbiol. 72:443–448 [DOI] [PMC free article] [PubMed] [Google Scholar]
- 18. Lagos R, et al. 2001. Structure, organization and characterization of the gene cluster involved in the production of microcin E492, a channel-forming bacteriocin. Mol. Microbiol. 42:229–243 [DOI] [PubMed] [Google Scholar]
- 19. Lederberg J, Tatum EL. 1946. Gene recombination in Escherichia coli. Nature 158:558. [DOI] [PubMed] [Google Scholar]
- 20. Lemonnier M, et al. 2008. The evolution of contact-dependent inhibition in non-growing populations of Escherichia coli. Proc. Biol. Sci. 275:3–10 [DOI] [PMC free article] [PubMed] [Google Scholar]
- 21. Linton KJ, Higgins CF. 1998. The Escherichia coli ATP-binding cassette (ABC) proteins. Mol. Microbiol. 28:5–13 [DOI] [PubMed] [Google Scholar]
- 22. Lwoff A, Jacob F, Ritz E, Gage M. 1952. Induction of bacteriophage production and of a colicine by peroxides, ethyleneimines and halogenated alkylamines. C. R. Hebd. Seances Acad. Sci. 234:2308–2310 [PubMed] [Google Scholar]
- 23. Martinez MC, Lazdunski C, Pattus F. 1983. Isolation, molecular and functional properties of the C-terminal domain of colicin A. EMBO J. 2:1501–1507 [DOI] [PMC free article] [PubMed] [Google Scholar]
- 24. Nomura M, Nakamura M. 1962. Reversibility of inhibition of nucleic acids and protein synthesis by colicin K. Biochem. Biophys. Res. Commun. 7:306–309 [DOI] [PubMed] [Google Scholar]
- 25. Ohno-Iwashita Y, Imahori K. 1982. Assignment of the functional loci in the colicin E1 molecule by characterization of its proteolytic fragments. J. Biol. Chem. 257:6446–6451 [PubMed] [Google Scholar]
- 26. Pons AM, et al. 2004. Genetic analysis and complete primary structure of microcin L. Antimicrob. Agents Chemother. 48:505–513 [DOI] [PMC free article] [PubMed] [Google Scholar]
- 27. Pugsley AP, Cole ST. 1986. Beta-galactosidase and alkaline phosphatase do not become extracellular when fused to the amino-terminal part of colicin N. J. Gen. Microbiol. 132:2297–2307 [DOI] [PubMed] [Google Scholar]
- 28. Reeves P. 1965. The bacteriocins. Bacteriol. Rev. 29:24–45 [DOI] [PMC free article] [PubMed] [Google Scholar]
- 29. Riley MA, Gordon DM. 1992. A survey of Col plasmids in natural isolates of Escherichia coli and an investigation into the stability of Col-plasmid lineages. J. Gen. Microbiol. 138:1345–1352 [DOI] [PubMed] [Google Scholar]
- 30. Riley MA, Tan Y, Wang J. 1994. Nucleotide polymorphism in colicin E1 and Ia plasmids from natural isolates of Escherichia coli. Proc. Natl. Acad. Sci. U. S. A. 91:11276–11280 [DOI] [PMC free article] [PubMed] [Google Scholar]
- 31. Riley MA, Wertz JE. 2002. Bacteriocins: evolution, ecology, and application. Annu. Rev. Microbiol. 56:117–137 [DOI] [PubMed] [Google Scholar]
- 32. Sawant AA, Casavant NC, Call DR, Besser TE. 2011. Proximity-dependent inhibition in Escherichia coli isolates from cattle. Appl. Environ. Microbiol. 77:2345–2351 [DOI] [PMC free article] [PubMed] [Google Scholar]
- 33. Shringi S, et al. 2012. Differential virulence of clinical and bovine-biased enterohemorrhagic Escherichia coli O157:H7 genotypes in piglet and Dutch belted rabbit models. Infect. Immun. 80:369–380 [DOI] [PMC free article] [PubMed] [Google Scholar]
- 34. Smarda J. 1962. Induction of the formation of a coli bacteriophage and colicin by hydroperoxide. Experientia 18:271–273 [DOI] [PubMed] [Google Scholar]
- 35. Trueblood CE, et al. 2000. The CaaX proteases, Afc1p and Rce1p, have overlapping but distinct substrate specificities. Mol. Cell. Biol. 20:4381–4392 [DOI] [PMC free article] [PubMed] [Google Scholar]
- 36. Wilkens M, Villanueva JE, Cofre J, Chnaiderman J, Lagos R. 1997. Cloning and expression in Escherichia coli of genetic determinants for production of and immunity to microcin E492 from Klebsiella pneumoniae. J. Bacteriol. 179:4789–4794 [DOI] [PMC free article] [PubMed] [Google Scholar]
- 37. Zschuttig A, et al. 2012. Identification and characterization of microcin S, a new antibacterial peptide produced by probiotic Escherichia coli G3/10. PLoS One 7:e33351 doi:10.1371/journal.pone.0033351 [DOI] [PMC free article] [PubMed] [Google Scholar]