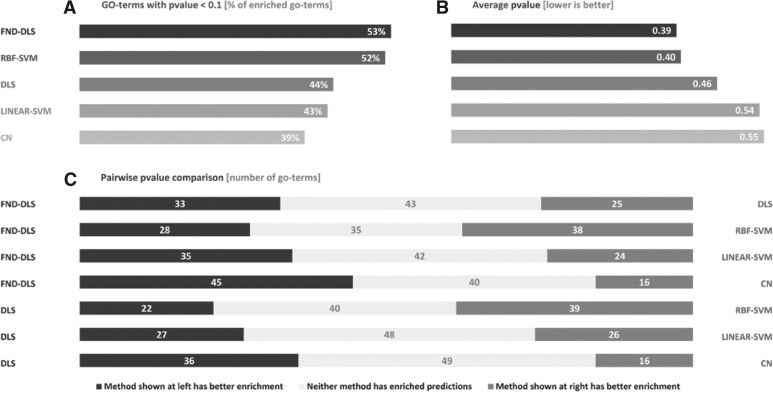
Fig. 2.
Summary of the results of an enrichment analysis performed over 101 representative GO biological processes. The analysis consists of testing the enrichment of new annotations from year 2010, in the predictions done by each method using annotation from year 2008. FND-DLS and RBF-SVM show the best overall performances, with a small advantage for FND-DLS. Figure (C) shows the number of GO-terms in which one method attains better enrichments (lower P-values) than the other (details in Section 3).

