With a relatively low-radiation-dose method, extracellular volume values obtained with cardiac CT were shown to be comparable to those obtained with cardiac MR imaging.
Abstract
Purpose:
To develop a cardiac computed tomographic (CT) method with which to determine extracellular volume (ECV) fraction, with cardiac magnetic resonance (MR) imaging as the reference standard.
Materials and Methods:
Study participants provided written informed consent to participate in this institutional review board–approved study. ECV was measured in healthy subjects and patients with heart failure by using cardiac CT and cardiac MR imaging. Paired Student t test, linear regression analysis, and Pearson correlation analysis were used to determine the relationship between cardiac CT and MR imaging ECV values and clinical parameters.
Results:
Twenty-four subjects were studied. There was good correlation between myocardial ECV measured at cardiac MR imaging and that measured at cardiac CT (r = 0.82, P < .001). As expected, ECV was higher in patients with heart failure than in healthy control subjects for both cardiac CT and cardiac MR imaging (P = .03, respectively). For both cardiac MR imaging and cardiac CT, ECV was positively associated with end diastolic and end systolic volume and inversely related to ejection fraction (P < .05 for all). Mean radiation dose was 1.98 mSv ± 0.16 (standard deviation) for each cardiac CT acquisition.
Conclusion:
ECV at cardiac CT and that at cardiac MR imaging showed good correlation, suggesting the potential for myocardial tissue characterization with cardiac CT.
© RSNA, 2012
Introduction
Focal myocardial scar after myocardial infarction can be readily identified with cardiac magnetic resonance (MR) imaging with delayed gadolinium-enhanced techniques (1). Cardiac MR imaging has been well validated and enables quantification of myocardial scar mass in comparison with overall mass of the myocardium. Unfortunately, cardiac MR imaging is not widely available and has its own contraindications and limitations. Cardiac computed tomography (CT) is well tolerated by patients and has been validated for use in the detection of focal myocardial scar (2–6).
Diffuse interstitial myocardial fibrosis is an increasingly recognized disease process common to a variety of cardiomyopathies and heart failure. T1 mapping with contrast material–enhanced cardiac MR imaging has been developed to enable quantification of diffusely abnormal myocardial signal intensity (7–12). Myocardial extracellular volume (ECV) fraction represents the equilibrium distribution of gadolinium in the blood and myocardium and is derived from T1 measurements. ECV is increased in association with diffuse myocardial fibrosis, a hallmark of pathologic remodeling (13–15). Cardiac MR imaging T1 mapping with ECV determination has been validated in multiple conditions, including heart failure secondary to ischemic and nonischemic cardiomyopathies, aortic valve disease, and hypertrophic cardiomyopathy (7,9,12,16–19).
With the increasing use of cardiac CT and because myocardial fibrosis is central to many disease processes involving the myocardium, we sought to develop a cardiac CT method with which to determine ECV fraction. We used cardiac MR imaging as the reference standard for comparison.
Materials and Methods
Study Population
This single-center study was approved by National Institutes of Health Clinical Center institutional review board. All study participants provided written informed consent and completed both cardiac CT and cardiac MR imaging studies on the same day within a 4-hour window. From August 2010 to October 2011, 28 participants were enrolled. Patients with New York Heart Association, or NYHA, grade II or greater heart failure and either left ventricular ejection fraction less than 40% or diagnosis of diastolic dysfunction and left ventricular ejection fraction greater than 50% were included, as were healthy individuals. Healthy subjects had no history of clinical cardiovascular disease. Normal left and right ventricular volumes and systolic functions were confirmed at cardiac MR imaging. All clinical examinations and laboratory tests were performed no more than 7 days before cardiac CT (Fig 1).
Figure 1:
Flowchart of image acquisition methods. CTA = CT angiography, MOLLI = modified Look Locker sequence with inversion recovery, LGE = late gadolinium enhancement.
Cardiac MR Imaging Protocol
Images were obtained in all study subjects with a 3-T imager (Verio; Siemens, Erlangen, Germany) with a 32-channel cardiovascular array coil (InVivo, Orlando, Fla). An 11-heart-beat modified Look Locker sequence with inversion recovery was used for cardiac MR imaging T1 measurement, as described previously (20). Scanning parameters were as follows: repetition time msec/echo time msec/minimum inversion time msec, 1.9/1.0/110.0; inversion time increment, 80.0 msec; field of view, 290–360 mm2; pixel size, 2.3 × 1.9 mm2; readout resolution, 192; phase resolution, 75%–85%; section thickness, 8 mm; 35° flip angle; and generalized autocalibrating partially parallel acquisition factor, two. Short-axis images acquired with the modified Look Locker sequence with inversion recovery were obtained at the base, middle, and apical levels of the left ventricle.
Images for T1 measurements were obtained before and after intravenous infusion of gadopentetate dimeglumine (0.15 mmol per kilogram of body weight, Magnevist; Bayer Healthcare Pharmaceuticals, Wayne, NJ) injected as a bolus at a rate of 2 mL/sec and followed by a 20-mL saline flush. Postcontrast examinations with the modified Look Locker sequence with inversion recovery were performed at the same positions as precontrast examinations 12 minutes after injection. ECV has been shown to be stable between 10 and 40 minutes after administration of gadopentetate dimeglumine (13). To assess left ventricular function, steady-state free precession cine MR short-axis images were acquired with a temporal resolution of 40 msec. Phase-sensitive inversion-recovery late gadolinium-enhanced MR imaging was performed 15 minutes after injection to assess for focal myocardial scar (21).
Cardiac CT Protocol
All study participants were examined with a 320-detector row CT scanner (Aquilion One; Toshiba Medical Systems, Tustin, Calif) after cardiac MR imaging. A precontrast calcium score–type acquisition was performed with prospective electrocardiographic gating with a 400-msec single gantry rotation during an inspiratory breath hold that enables image acquisition in a single cardiac phase. Scanning parameters were as follows: tube voltage, 120 kV; tube current, 300 mA; and section thickness, 3 mm (22). Coronary CT angiography was performed during intravenous infusion of 125 mL ± 24 (mean ± standard deviation) of iopamidol (Isovue 370; Bracco Diagnostics, Princeton, NJ) at a rate of 4–5 mL/sec by using the following parameters: For subjects with a heart rate of less than 66 beats per minute, we used prospective electrocardiographic gating at 70%–80% of one R-R interval and x-ray exposure times ranging from 0.423 to 0.350 second. For subjects with a heart rate of at least 66 beats per minute, we used prospective electrocardiographic gating at 40%–80% of two R-R intervals and x-ray exposure times ranging from 0.714 second to 1.174 seconds. Additional parameters were as follows: tube voltage, 120 kV; tube current, 300–580 mA depending on body mass index and sex; gantry rotation speed, 0.35 second; section thickness, 0.5 mm; and scanning range, 128–160 mm. After a 10-minute delay, postcontrast cardiac CT was performed with parameters identical to those used for the precontrast calcium score scan.
Data Analysis
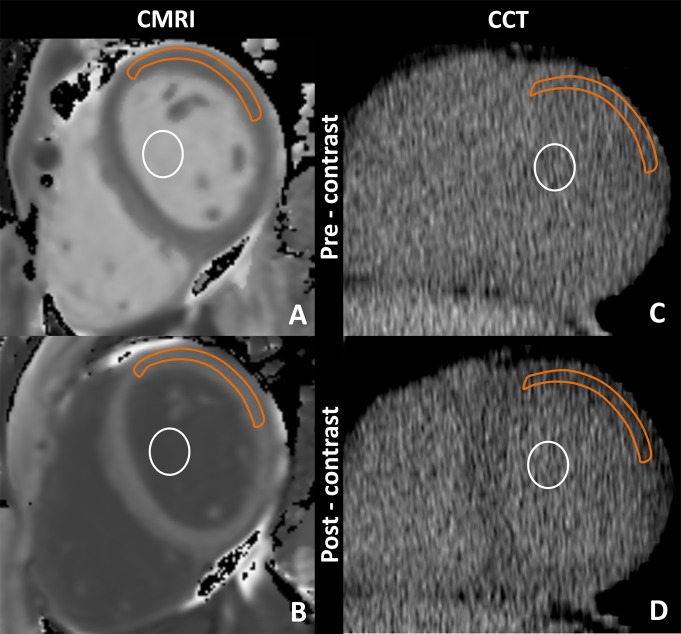
T1 maps from cardiac MR imaging data were calculated by using MRmap software (23). For extraction of myocardial T1 values, regions of interest for signal intensity measurement were drawn in the anterior and anterolateral segments of myocardial and blood pool contours by using QMass software (version 7.2; Medis, Leiden, the Netherlands) (Fig 2) This will be discussed later in this article. None of the study subjects had focal late gadolinium enhancement in the region of interest. The average of two independent measurements made by the same observer was used for analysis. The reader was blinded to the findings of cardiac CT analysis. ECV fraction was calculated with the following equation: ECV = (ΔR1m/ΔR1b)·(1−Hct), where R1m is R1 in the myocardium, R1b is R1 in the blood, Hct is the hematocrit level, and DR1 is the change in relaxivity. The change in relaxivity, (ΔR1), was determined with the following equation: ΔR1 = R1post−R1pre, where R1post and R1pre are R1 after and before gadolinium chelate administration, respectively (24–26).
Figure 2:
Cardiac MR imaging region of interest measurements obtained, A, before and, B, after gadolinium chelate administration and reformatted cardiac CT region of interest measurements obtained, C, before and, D, after administration of an iodinated contrast agent. For cardiac CT, the anterolateral myocardium was most reliably identified before administration of an iodinated contrast agent. There, a region of interest from the anterolateral myocardium was used for attenuation measurements. A focal myocardial scar was identified on delayed cardiac MR images and was not included in the region of interest. Orange outline = myocardium, white circle = blood pool.
Left ventricular function and volumes were measured by using CIM 6.2 software (MRI Research Group, Auckland, New Zealand) (27). Focal myocardial scar was defined by using MASS software (V2011-EXP; Leiden, the Netherlands) at a threshold of five standard deviations above the remote myocardium. Two observers (J.J.L., M.S.N.; 1 year and 7 years of cardiovascular imaging experience, respectively) evaluated the cardiac MR imaging data and were blinded to the clinical data.
Cardiac CT data were reformatted to the short-axis plane to correspond to the cardiac MR acquisition. Myocardial and blood pool attenuation values at the base, middle, and apex were measured twice by the same observer with Vitrea Core fX v5 software (Vital Images, Minnetonka, Minn), and the average value was used for analysis. Attenuation values were measured in the anterior and anterolateral segments, just as they were for cardiac MR imaging, because these segments were most reliably seen on noncontrast cardiac CT images (Fig 2). ECV fraction was calculated with the following equation: ECV = (ΔHUm/ΔHUb)·(1−Hct), where ΔHUm is the change in attenuation of the myocardium, ΔHUb is the change in attenuation of the blood, and Hct is the hematocrit level. The change in attenuation (ΔHU) was determined with the equation ΔHU = HUpost−HUpre, where HUpost and HUpre are attenuation after and before administration of iodinated contrast material, respectively. Coronary calcium score was quantified by using the Agatston method (28). Coronary calcium and CT angiographic data were analyzed by using Vitrea software, as described previously. Two observers (N.K., M.S.N.; 2 and 7 years of experience in cardiovascular imaging. respectively) evaluated the cardiac CT data and were blinded to the clinical data.
Statistical Analysis
The paired Student t test was used to determine significant differences between cardiac CT and cardiac MR imaging ECV values. Linear regression analysis and Pearson correlation were also used to examine the relationship between two methods by using ECV at cardiac MR imaging as the predictor variable and ECV at cardiac CT as the dependent variable. The Bland-Altman method was used to calculate bias and limits of agreement. Inter- and intraobserver variability were assessed with Pearson correlation as the standard deviation of the difference (SDD) between two readings. The coefficient of variation was calculated by dividing the SDD by the average of the two readings. Coronary calcium level was the log of calcium score plus 1. P < .05 was considered indicative of a significant difference.
Results
The average duration of the examination was 47 minutes ± 5 for cardiac MR imaging and 13 minutes ± 1.5 for cardiac CT. Four participants were excluded: Two had atrial fibrillation, one had shortness of breath, and one had a CT protocol violation. A total of 24 participants were included for analysis; 13 subjects had heart failure, and 11 were healthy. The mean age in this population was 63.2 years ± 10 (range, 45–95 years). Male subjects had a mean age of 60.7 years ± 6.4 (range, 46–72 years), and female subjects had a mean age of 66.6 years ± 13.7 (range, 45–95 years). There was no significant difference between male and female groups in this study (P = .23). Participant characteristics are summarized in Table 1.
Table 1.
Participant Characteristics
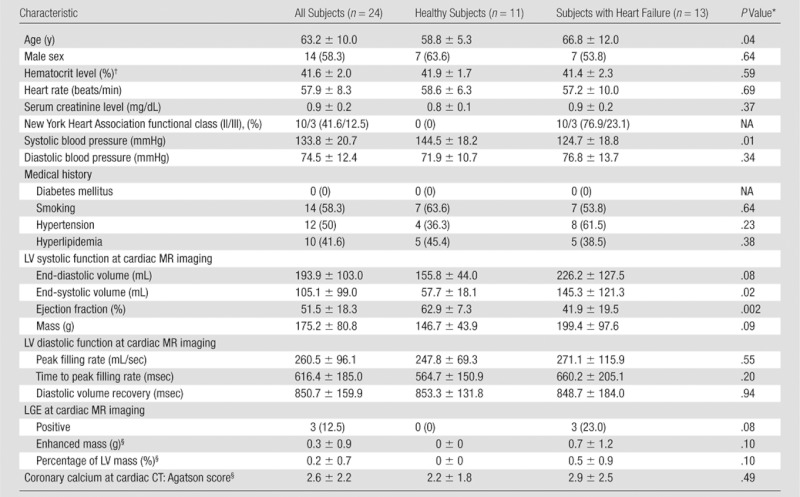
Note.—Data are mean ± standard deviation or number of patients with percentages in parentheses, as appropriate. LGE = late gadolinium enhancement, LV = left ventricular, NA = not applicable.
P values are for comparison of healthy subjects with those with heart failure.
To convert to Système International units (proportion of 1.0), multiply by 0.01.
To convert to Système International units, (micromoles per liter), multiply by 88.4.
Results are from logistic regression analysis.
Cardiac MR imaging data were available for analysis in 136 of 144 T1 maps at the base, middle, and apical levels on pre- and postcontrast images, yielding 65 of 72 ECV values with cardiac MR imaging. Seven ECV maps could not be analyzed because of respiratory and cardiac-gating artifacts on cardiac MR images. A total of 68 of 72 ECV values were measured with cardiac CT. Four ECV maps obtained with cardiac CT were excluded because of attenuation artifacts in the area of interest.
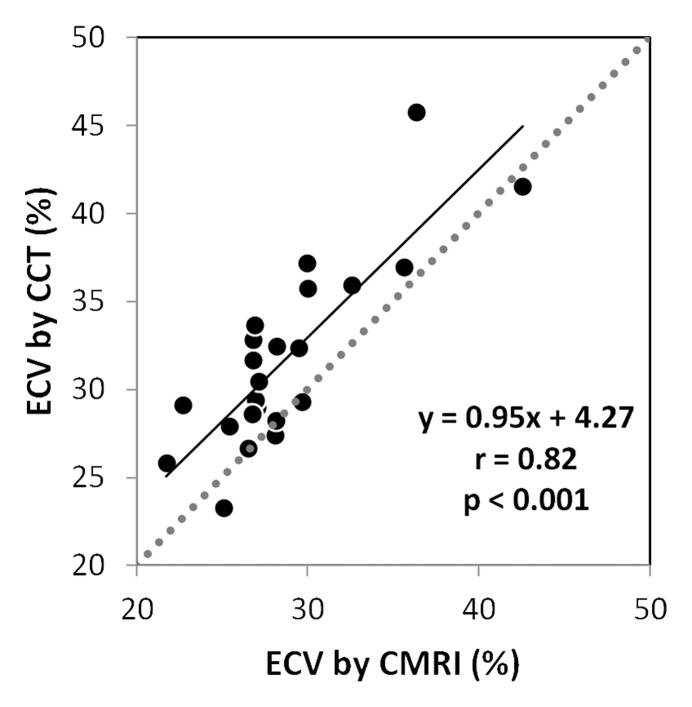
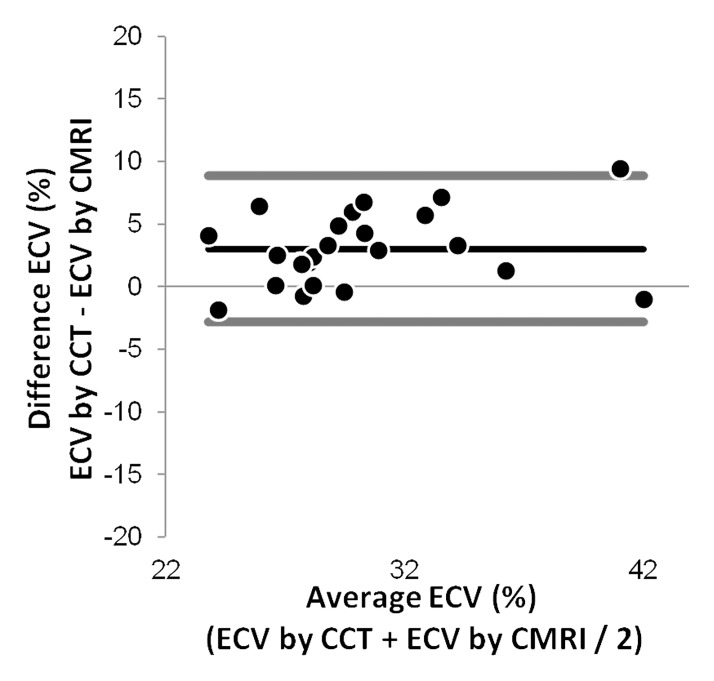
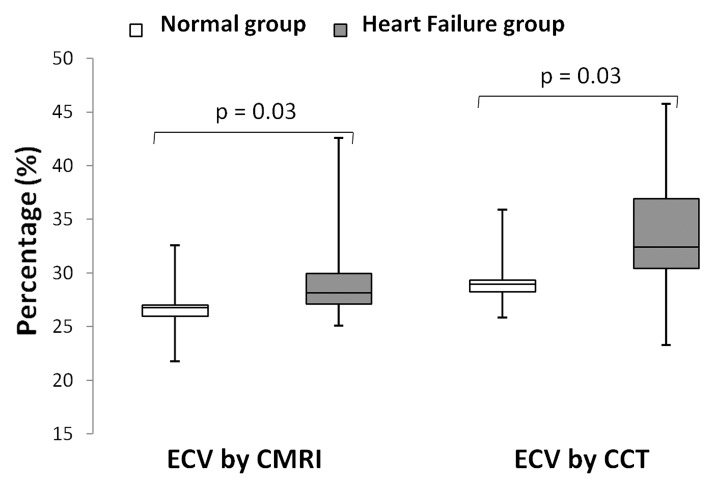
ECV values showed good correlation between the two methods (r = 0.82, P < .001) (Fig 3a). ECV values were slightly lower when measured with cardiac MR imaging as opposed to cardiac CT (28.6% ± 4.4 vs 31.6% ± 5.1, P = .03). The 95% limits of agreement between the two methods ranged from −2.82% to 8.85%. A small bias (3.01%) toward higher ECV was detected for cardiac CT (Fig 3b). As expected, cardiac MR imaging–derived ECV was lower in the healthy group than in the heart failure group (26.6% ± 2.9 vs 30.3% ± 4.9, respectively; P = .03). For cardiac CT, ECV was also lower for the healthy subjects than for the patients with heart failure (29.3% ± 2.7 vs 33.5% ± 5.9, respectively; P = .03) (Fig 4). End-diastolic volume, end-systolic volume, and time to peak filling rate (greater time to peak filling rate indicated diastolic dysfunction) were positively associated with ECV (P < .001 for all), while ejection fraction was inversely correlated with ECV for both cardiac MR imaging and cardiac CT (P < .05 for all; Table 2).
Figure 3a:
Results obtained for ECV at (a) MR imaging and (b) CT. (a) Correlation and linear regression analysis shows good correlation between the methods (r = 0.82, P < .001). (b) Bland-Altman plot shows a small bias (3.01%) toward higher ECV at cardiac CT (black line), with 95% limits of agreement between the two methods of −2.82% and 8.85% (thick gray lines).
Figure 3b:
Results obtained for ECV at (a) MR imaging and (b) CT. (a) Correlation and linear regression analysis shows good correlation between the methods (r = 0.82, P < .001). (b) Bland-Altman plot shows a small bias (3.01%) toward higher ECV at cardiac CT (black line), with 95% limits of agreement between the two methods of −2.82% and 8.85% (thick gray lines).
Figure 4:
Box plots show median and interquartile range. Minimum and maximum values are represented in each group by the whiskers of the plot. Healthy and heart failure groups had significantly different mean ECV values at both cardiac MR imaging and cardiac CT (P = .03 for both).
Table 2.
ECV at Cardiac CT and Cardiac MR Imaging versus Clinical and Imaging Parameters
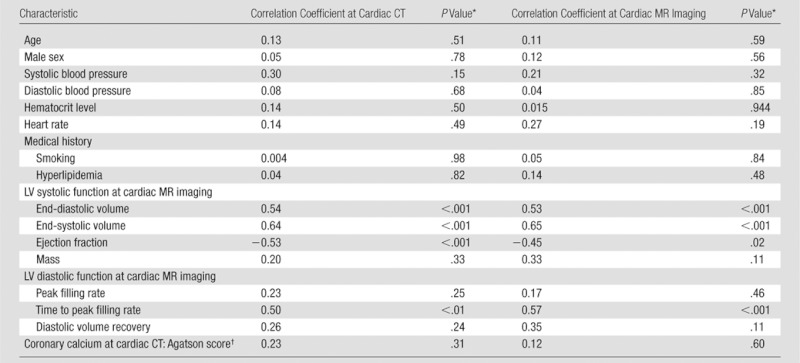
Note.—LV = left ventricular.
P values are for linear or logistic regression analysis, as appropriate, relating ECV as the dependent variable and the value in the first column as the independent variable.
Results are from logistic regression analysis.
The correlation coefficients for inter- and intraobserver agreement for cardiac CT were 0.95 (12.2% SDD) and 0.98 (7.5% SDD), respectively, for myocardium density measurement and 0.99 (5.1% SDD) and 0.99 (2.8% SDD), respectively, for blood pool density measurement. For cardiac MR imaging, the correlation coefficients for inter- and intraobserver agreement were 0.98 (7.9% SDD) and 0.98 (7.0% SDD), respectively, for myocardium and 0.99 (4.0% SDD) and 0.99 (2.9% SDD), respectively, for blood pool relaxivity measurements. The average radiation dose was 1.98 mSv ± 0.16 (average dose-length product, 141.5 mGy · cm ± 11.7) for both baseline and delayed ECV measurements. The average radiation dose was 3.14 mSv ± 0.82 (average dose-length product, 221.1 mGy · cm ± 59.5) for cardiac CT angiography.
Discussion
Cardiac MR imaging and cardiac CT have been used to detect areas of focal myocardial scarring that is typically related to myocardial infarction. Recently, innovations in cardiac MR imaging technique have enabled assessment of diffuse myocardial fibrosis associated with heart failure or cardiomyopathy. By using a relatively low-radiation-dose method, ECV values for cardiac CT were shown to be comparable to those obtained with cardiac MR imaging. ECV values were elevated in subjects with heart failure; greater ECV values were associated with reduced ejection fraction and increased end-systolic and end-diastolic volumes.
ECV fraction has been shown to be a reproducible and novel index with which to assess fibrosis (11,13,24–26,29). A wide range of disease conditions, including acute and chronic myocardial infarction (30,31), chronic aortic regurgitation (12), heart failure (9), dilated cardiomyopathy (16), and hypertrophic cardiomyopathy (17) have altered ECV values at cardiac MR imaging. Iles et al (9) showed abnormal diastolic function associated with increased collagen content. In the current study, decreased myocardial function and abnormal diastolic function were also associated with increased ECV.
There were several limitations to this study. First, we included only the anterior and anterolateral segments of the myocardium in the analysis. These regions were reliably identified on precontrast cardiac CT images and showed good contrast between adjacent pericardium and lung tissue. Second, cardiac CT ECV validation was based on cardiac MR imaging findings rather than on histologic specimens. Subjects in this study were not eligible for tissue biopsy. In addition, premortem human data based on tissue biopsy were limited by very small tissue specimens that were subject to sampling error. However, previous studies have shown consistent histologic correlation between cardiac MR imaging–derived T1 and ECV values in both human and animal studies (9,10,25,26). The cardiac CT method we described requires additional radiation (mean, 1.9 mSv). Lower-dose cardiac CT techniques, such as iterative image reconstruction, were not available at the time of protocol development.
In conclusion, we have described the assessment of myocardial fibrosis via ECV determination with cardiac CT. ECV measured with cardiac CT shows good reproducibility and correlates well with ECV measured with T1-mapping cardiac MR imaging–determined values, representing a potential new approach toward the clinical assessment of diffuse myocardial fibrosis.
Advances in Knowledge.
• We assessed myocardial fibrosis by determining the extracellular volume (ECV) with low-radiation (<2 mSv) cardiac CT.
• ECV measured with cardiac CT shows good reproducibility and correlates well (r = 0.82) with ECV measured with T1-mapping cardiac MR imaging–determined values in both healthy subjects and patients with heart failure.
Implication for Patient Care.
• ECV measured with cardiac CT represents a new approach toward the clinical assessment of diffuse myocardial fibrosis.
Disclosures of Potential Conflicts of Interest: M.S.N. Financial activities related to the present article: none to disclose. Financial activities not related to the present article: has an NIH patent pending. Other relationships: none to disclose. N.K. No potential conflicts of interest to disclose. J.J.L. No potential conflicts of interest to disclose. X.C. Financial activities related to the present article: none to disclose. Financial activities not related to the present article: has an NIH patent pending. Other relationships: none to disclose. J.Y. Financial activities related to the present article: none to disclose. Financial activities not related to the present article: has an NIH patent pending. Other relationships: none to disclose. A.Z. No potential conflicts of interest to disclose. C.T.S. Financial activities related to the present article: none to disclose. Financial activities not related to the present article: has an NIH patent pending. Other relationships: none to disclose. J.A.C.L. No potential conflicts of interest to disclose. S.L. Financial activities related to the present article: none to disclose. Financial activities not related to the present article: has an NIH patent pending. Other relationships: none to disclose. D.A.B. Financial activities related to the present article: none to disclose. Financial activities not related to the present article: has an NIH patent pending. Other relationships: none to disclose.
Received November 16, 2011; revision requested January 5, 2012; revision received January 30; accepted March 2; final version accepted March 22.
Funding: This research was supported by the National Institutes of Health intramural program (EB000072-02 and CL090019-02).
Abbreviations:
- ECV
- extracellular volume
- SDD
- standard deviation of the difference
References
- 1.Kim RJ, Fieno DS, Parrish TB, et al. Relationship of MRI delayed contrast enhancement to irreversible injury, infarct age, and contractile function. Circulation 1999;100(19):1992–2002 [DOI] [PubMed] [Google Scholar]
- 2.Senra T, Shiozaki AA, Salemi VM, Rochitte CE. Delayed enhancement by multidetector computed tomography in endomyocardial fibrosis. Eur Heart J 2008;29(3):347. [DOI] [PubMed] [Google Scholar]
- 3.Bauer RW, Kerl JM, Fischer N, et al. Dual-energy CT for the assessment of chronic myocardial infarction in patients with chronic coronary artery disease: comparison with 3-T MRI. AJR Am J Roentgenol 2010;195(3):639–646 [DOI] [PubMed] [Google Scholar]
- 4.Lardo AC, Cordeiro MA, Silva C, et al. Contrast-enhanced multidetector computed tomography viability imaging after myocardial infarction: characterization of myocyte death, microvascular obstruction, and chronic scar. Circulation 2006;113(3):394–404 [DOI] [PMC free article] [PubMed] [Google Scholar]
- 5.Schuleri KH, Centola M, George RT, et al. Characterization of peri-infarct zone heterogeneity by contrast-enhanced multidetector computed tomography: a comparison with magnetic resonance imaging. J Am Coll Cardiol 2009;53(18):1699–1707 [DOI] [PMC free article] [PubMed] [Google Scholar]
- 6.Siemers PT, Higgins CB, Schmidt W, Ashburn W, Hagan P. Detection, quantitation and contrast enhancement of myocardial infarction utilizing computerized axial tomography: comparison with histochemical staining and 99mTc-pyrophosphate imaging. Invest Radiol 1978;13(2):103–109 [DOI] [PubMed] [Google Scholar]
- 7.Messroghli DR, Walters K, Plein S, et al. Myocardial T1 mapping: application to patients with acute and chronic myocardial infarction. Magn Reson Med 2007;58(1):34–40 [DOI] [PubMed] [Google Scholar]
- 8.Friedrich MG. There is more than shape and function. J Am Coll Cardiol 2008;52(19):1581–1583 [DOI] [PubMed] [Google Scholar]
- 9.Iles L, Pfluger H, Phrommintikul A, et al. Evaluation of diffuse myocardial fibrosis in heart failure with cardiac magnetic resonance contrast-enhanced T1 mapping. J Am Coll Cardiol 2008;52(19):1574–1580 [DOI] [PubMed] [Google Scholar]
- 10.Flett AS, Hayward MP, Ashworth MT, et al. Equilibrium contrast cardiovascular magnetic resonance for the measurement of diffuse myocardial fibrosis: preliminary validation in humans. Circulation 2010;122(2):138–144 [DOI] [PubMed] [Google Scholar]
- 11.Sibley C, Huang J, Ugander M, et al. Myocardial and blood T1 quantification in normal volunteers at 3T. J Cardiovasc Magn Reson 2011;13(Suppl 1):P51 [Google Scholar]
- 12.Sparrow P, Messroghli DR, Reid S, Ridgway JP, Bainbridge G, Sivananthan MU. Myocardial T1 mapping for detection of left ventricular myocardial fibrosis in chronic aortic regurgitation: pilot study. AJR Am J Roentgenol 2006;187(6):W630–W635 [DOI] [PubMed] [Google Scholar]
- 13.Schelbert EB, Testa SM, Meier CG, et al. Myocardial extravascular extracellular volume fraction measurement by gadolinium cardiovascular magnetic resonance in humans: slow infusion versus bolus. J Cardiovasc Magn Reson 2011 Mar 4;13:16. [DOI] [PMC free article] [PubMed] [Google Scholar]
- 14.Nacif MS, Kawel N, Sibley CT, Zavodni A, Lima JA, Bluemke DA. Which is your diagnosis? [in Portuguese]. Radiol Bras 2011;44(2):XI–XIII [Google Scholar]
- 15.Nacif MS, Noureldin RA, Sibley CT, Turkbey EB, Lima JA, Bluemke DA. Which is your diagnosis? [in Portuguese]. Radiol Bras 2010;43(5):XI–XIII [Google Scholar]
- 16.Han Y, Peters DC, Dokhan B, Manning WJ. Shorter difference between myocardium and blood optimal inversion time suggests diffuse fibrosis in dilated cardiomyopathy. J Magn Reson Imaging 2009;30(5):967–972 [DOI] [PMC free article] [PubMed] [Google Scholar]
- 17.Amano Y, Takayama M, Kumita S. Contrast-enhanced myocardial T1-weighted scout (Look-Locker) imaging for the detection of myocardial damages in hypertrophic cardiomyopathy. J Magn Reson Imaging 2009;30(4):778–784 [DOI] [PubMed] [Google Scholar]
- 18.Jerosch-Herold M, Sheridan DC, Kushner JD, et al. Cardiac magnetic resonance imaging of myocardial contrast uptake and blood flow in patients affected with idiopathic or familial dilated cardiomyopathy. Am J Physiol Heart Circ Physiol 2008;295(3):H1234–H1242 [DOI] [PMC free article] [PubMed] [Google Scholar]
- 19.Kehr E, Sono M, Chugh SS, Jerosch-Herold M. Gadolinium-enhanced magnetic resonance imaging for detection and quantification of fibrosis in human myocardium in vitro. Int J Cardiovasc Imaging 2008;24(1):61–68 [DOI] [PubMed] [Google Scholar]
- 20.Lee JJ, Liu S, Nacif MS, et al. Myocardial T1 and extracellular volume fraction mapping at 3 tesla. J Cardiovasc Magn Reson 2011;13(1):75. [DOI] [PMC free article] [PubMed] [Google Scholar]
- 21.Kellman P, Arai AE, McVeigh ER, Aletras AH. Phase-sensitive inversion recovery for detecting myocardial infarction using gadolinium-delayed hyperenhancement. Magn Reson Med 2002;47(2):372–383 [DOI] [PMC free article] [PubMed] [Google Scholar]
- 22.van der Bijl N, de Bruin PW, Geleijns J, et al. Assessment of coronary artery calcium by using volumetric 320-row multi-detector computed tomography: comparison of 0.5 mm with 3.0 mm slice reconstructions. Int J Cardiovasc Imaging 2010;26(4):473–482 [DOI] [PMC free article] [PubMed] [Google Scholar]
- 23.Messroghli DR, Rudolph A, Abdel-Aty H, et al. An open-source software tool for the generation of relaxation time maps in magnetic resonance imaging. BMC Med Imaging 2010;10:16. [DOI] [PMC free article] [PubMed] [Google Scholar]
- 24.Diesbourg LD, Prato FS, Wisenberg G, et al. Quantification of myocardial blood flow and extracellular volumes using a bolus injection of Gd-DTPA: kinetic modeling in canine ischemic disease. Magn Reson Med 1992;23(2):239–253 [DOI] [PubMed] [Google Scholar]
- 25.Lima JA, Judd RM, Bazille A, Schulman SP, Atalar E, Zerhouni EA. Regional heterogeneity of human myocardial infarcts demonstrated by contrast-enhanced MRI: potential mechanisms. Circulation 1995;92(5):1117–1125 [DOI] [PubMed] [Google Scholar]
- 26.Arheden H, Saeed M, Higgins CB, et al. Measurement of the distribution volume of gadopentetate dimeglumine at echo-planar MR imaging to quantify myocardial infarction: comparison with 99mTc-DTPA autoradiography in rats. Radiology 1999;211(3):698–708 [DOI] [PubMed] [Google Scholar]
- 27.Young AA, Cowan BR, Thrupp SF, Hedley WJ, Dell’Italia LJ. Left ventricular mass and volume: fast calculation with guide-point modeling on MR images. Radiology 2000;216(2):597–602 [DOI] [PubMed] [Google Scholar]
- 28.Budoff MJ, Nasir K, McClelland RL, et al. Coronary calcium predicts events better with absolute calcium scores than age-sex-race/ethnicity percentiles: MESA (Multi-Ethnic Study of Atherosclerosis). J Am Coll Cardiol 2009;53(4):345–352 [DOI] [PMC free article] [PubMed] [Google Scholar]
- 29.Ugander M, Oki AJ, Hsu LY, et al. Abstract 12126: myocardial extracellular volume imaging by MRI quantitatively characterizes myocardial infarction and subclinical myocardial fibrosis. Circulation 2010;122(21_MeetingAbstracts):A12126 [Google Scholar]
- 30.Messroghli DR, Walters K, Plein S, et al. Myocardial T1 mapping: application to patients with acute and chronic myocardial infarction. Magn Reson Med 2007;58(1):34–40 [DOI] [PubMed] [Google Scholar]
- 31.Messroghli DR, Niendorf T, Schulz-Menger J, Dietz R, Friedrich MG. T1 mapping in patients with acute myocardial infarction. J Cardiovasc Magn Reson 2003;5(2):353–359 [DOI] [PubMed] [Google Scholar]


