Abstract
We measured gastric slow wave activity simultaneously with a Superconducting Quantum Interference Device (SQUID) magnetometer, mucosal electrodes, and cutaneous electrodes in 18 normal human subjects (11 women and 7 men). We processed signals with Fourier spectral analysis and SOBI blind-source separation techniques. We observed a high waveform correlation between mucosal electromyogram (EMG) and multichannel SQUID magnetogastrogram (MGG). There was a lower waveform correlation between mucosal EMG and cutaneous electrogastrogram (EGG), but the correlation improved with application of SOBI. There was also a high correlation between the frequency of the electrical activity recorded in MGG and in mucosal electrodes (r =0.97). We concluded that SQUID magnetometers noninvasively record gastric slow wave activity that is highly correlated with the activity recorded by invasive mucosal electrodes.
Keywords: slow wave, magnetogastrogram, mucosal electrode, electrogastrogram, multichannel SQUID
1. Introduction
The gastric slow wave is the electrical activity in the stomach that controls the mixing and propagation associated with normal digestion. Pathological conditions that interrupt these biophysical processes also affect the gastric electrical activity. For this reason, noninvasive methods for assessing gastric slow wave activity have garnered interest in recent years (Bradshaw et al., 2005; Mintchev et al., 1993; Mintchev and Bowes, 1996; Kim et al., 2009; Bradshaw et al., 2006; Bradshaw et al., 2007).
The electrogastrogram (EGG) records the cutaneous potentials associated with internal gastric slow waves, but these potentials do not directly reflect the underlying slow wave because of distortion and attenuation from alternating low- and high-conductivity layers in the abdominal volume conductor (Mintchev et al., 1993; Bradshaw et al., 2001). The magnetogastrogram (MGG) records magnetic fields associated with the gastric slow wave. Previous studies have demonstrated that the MGG correlates well with the serosal electromyogram and is influenced primarily by geometrical factors rather than dielectric properties (Bradshaw et al., 2003; Bradshaw et al., 1997). In addition to frequency dynamics, the multichannel MGG contains spatial information that allows evaluation of slow wave propagation (Bradshaw et al., 2006). Moreover, the MGG reflects abnormal gastric slow wave activity in tissue uncoupling as well as hyperglycemia (Bradshaw et al., 2007; Bradshaw et al., 2009). To date, however, no studies have examined the direct relationship between internal slow wave activity and the noninvasive MGG in humans.
The purpose of this study is to evaluate whether the multichannel MGG and the cutaneous EGG reflect underlying slow wave activity in normal human subjects.
2. Procedure
2.1 Materials and Methods
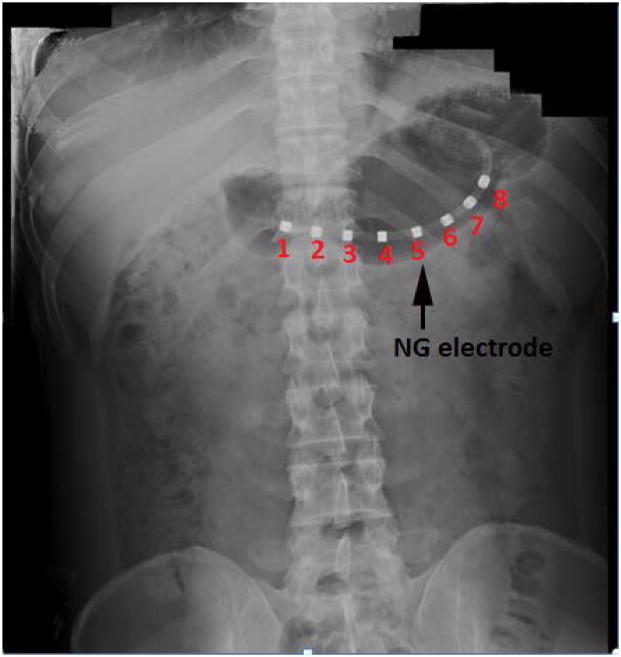
For this study, we recorded the mucosal electromyogram (EMG) using mucosal suction electrodes, a modification of the electrodes of Monges and Salducci (Monges et al., 1970). It consists of a custom-fabricated eight channel mucosal electrode array integrated in a 4.5-mm diameter naso-gastric (NG) catheter (Dentsleeve International, USA). Electrodes were platinum rings installed concentric on the catheter, as illustrated in Figure 1. The 4-mm long electrodes are spaced every 1.5 cm along the NG catheter. The cutaneous electrodes (sixteen bipolar pairs) that we used were standard Beckman silver-silver chloride sintered biopotential electrodes with a cup size of 17 mm, filled with electro-crème. Electrode signals were amplified using the Biosemi system (Biosemi, Amsterdam, The Netherlands ).
Figure 1.
X-ray photograph showing the placement of NG tube in the patient’s stomach
The Tristan Model 637 Superconducting Quantum Interference Device (SQUID) magnetometer was used to record the multichannel MGG. The SQUID has 19 normal-component sensors in a hexagonal close-packed array that measure magnetic fields perpendicular to the body surface when a subject lies underneath the device. Ten additional sensors measure tangential components of the magnetic field at locations at the top, bottom, sides and in the middle of the normal-component sensor array. The SQUIDs convert magnetic flux into voltage signals, which are then amplified (Model 5000, Quantum Design), digitized, and stored on a PC. SQUID and electrode signals were time-synced during collection.
Eighteen normal human volunteers (11 women and 7 men) reported to the Vanderbilt General Clinical Resource Center (GCRC) after an overnight fast. None of the volunteers had prior history of gastrointestinal disease or surgery and none was on medications known to alter gastrointestinal motor or electrical activity. A pregnancy test was performed in women of childbearing potential prior to enrollment. All studies were reviewed and approved by Vanderbilt’s Committee for the Protection of Human Subjects. We placed the naso-gastric mucosal EMG tube (NG tube) in the pyloro-antral region along the greater curvature of the stomach. We then verified the appropriate placement of the NG tube electrode in the gastric antrum by X-ray, as seen in figure 1. The cutaneous EGG electrode platform consisted of four rows of four bipolar electrode pairs. We positioned the cutaneous electrodes on the abdomen above the stomach along the longitudinal axis. Volunteers were then placed underneath the SQUID magnetometer in a magnetically shielded room. The subject’s abdomen was positioned such that the highest point of the abdomen while supine was in close approximation with the bottom of the SQUID dewar but not touching it, as the subject inspired completely. Simultaneous mucosal EMG, EGG, and MGG data were recorded during fasting for a period of thirty minutes. The volunteers then ate a standardized 300 kcal turkey sandwich meal with a clear liquid (water). Subsequent to the meals, we recorded the postprandial signal for a period of one hour. At several times during data collection, the subjects were asked to suspend respiration to allow the comparison of noise reduction techniques.
2.2 Data acquisition
Electrode signals (EGG and EMG) were acquired at 256 Hz with the electrode amplifier and resampled to 30 Hz. SQUID signals were passed into a preamplifier stage (Model 5000, Quantum Design, San Diego) with a gain of 5 and a low-pass filter set to 1 kHz. Data was acquired at 3 kHz and subsequently down-sampled to 30 Hz.
2.3 Signal processing
To investigate whether the multichannel MGG reflects underlying slow wave activity in normal human subjects, all simultaneously recorded mucosal, cutaneous and SQUID signals were subjected to spectral analysis. Recorded signals were loaded into MATLAB (Mathworks, Natick, MA, USA) and filtered using a second-order Butterworth filter with a bandpass of 1– 60 cycles per minute (cpm). All frequency spectra were computed with fast Fourier transform (FFT). For the present study, we first investigated the waveform and frequency correlation of our filtered postprandial EMG signals with its corresponding MGG and EGG filtered signals. Apart from the filtering, we also applied the Second-Order Blind Identification (SOBI) signal processing algorithm to reduce the interfering noise signals. A detailed description of SOBI and its mathematical formulations are available elsewhere (Belouchrani et al., 1997; Erickson et al., 2008; Erickson et al., 2009). Furthermore, we investigated the correlation of filtered postprandial EMG signals with corresponding MGG and EGG components isolated with SOBI.
3. Results
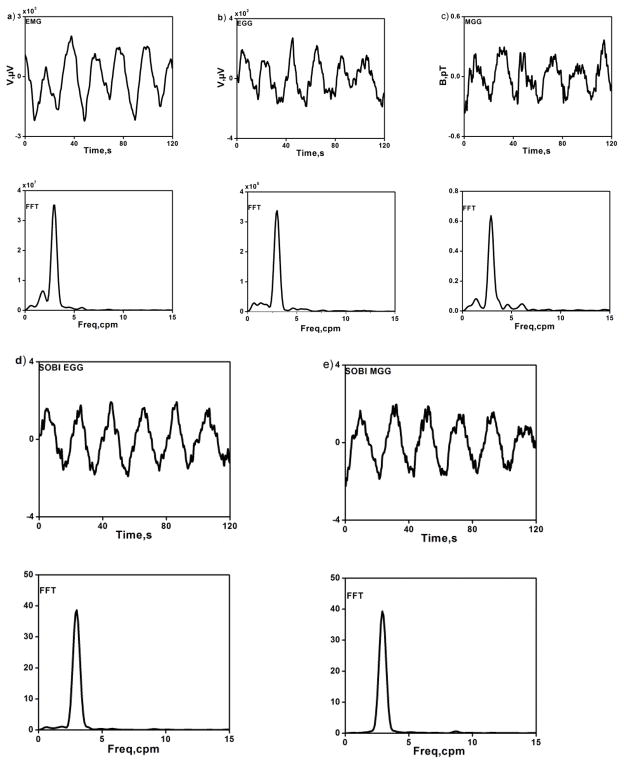
Recordings of simultaneous postprandial signals from gastric mucosal EMG, multichannel SQUID MGG and the cutaneous EGG were made in eighteen normal human volunteers. Because of the difficulty in achieving contact between the mucosal EMG electrodes and the gastric mucosa, we were able to record mucosal EMG consistently in only ten subjects. In one of the ten subjects, a steady noise artifact in the MGG prevented recording of the gastric slow wave. These exclusions left nine subjects (5 women and 4 men) with simultaneously recorded postprandial gastric EMG, EGG and MGG data for our analysis. A typical set of postprandial data obtained from one of the studies is shown in Fig. 2. Butterworth-filtered signals with their corresponding FFTs are shown in Figures 2(a–c). EGG and MGG components isolated with SOBI and their corresponding frequency spectra were illustrated in Figure 2(d–e). The regular gastric slow wave activity with a frequency of approximately three cycles per minute is clearly evident in all modalities.
Figure 2.
(a–c) Electromyogram (EMG), electrogastrogram (EGG) and magnetogastrogram (MGG) filtered data (upper row) and their corresponding frequency spectra (lower row) during postprandial period. (d–e) EGG and MGG components isolated with SOBI (upper row) and their corresponding frequency spectra (lower row).
To evaluate whether multichannel MGG reflects underlying slow wave activity in normal human subjects, we investigated the waveform and frequency correlation of our postprandial EMG signals with the corresponding MGG, EGG, SOBI-MGG and SOBI-EGG signals. In our notation, MGG or EGG refers to magnetogastrogram or electrogastrogram signals with the Butterworth digital filter applied while SOBI-MGG and SOBI-EGG refers to the same signals processed using the SOBI algorithm to identify gastric signal components. SOBI components were classified as gastric if they were primarily sinusoidal with a dominant frequency in the gastric range (2.5–4 cpm; Erickson et al., 2008; Erickson et al., 2009).
We determined the regression correlation coefficient between gastric slow wave frequencies recorded by mucosal electrodes to MGG, EGG, SOBI-MGG and SOBI-EGG. We also computed the cross-correlation of the EMG signal with the simultaneous MGG, EGG, SOBI-MGG, or SOBI-EGG waveforms. We used 120 second-long data segments for the cross-correlation calculation of EMG signal and its simultaneous MGG waveforms. We started by analyzing the data in order to find a primarily sinusoidal EMG signal. For each subject, we calculate the maximum cross-correlation coefficient between EMG and MGG signal that lie within the gastric frequency range. The mean value of the maximum correlation coefficient and its standard error are calculated across all nine subjects. A similar procedure was used for computing the maximum cross-correlation coefficient of EMG signal with its simultaneous EGG, SOBI-MGG and SOBI-EGG counterparts. Figure 3 shows the waveforms of the best-correlated EMG signal with corresponding MGG, EGG, SOBI-MGG and SOBI-EGG signals in a typical study. Magnetic fields exhibit the same oscillatory patterns as the mucosal electrodes, but similar oscillatory activity is typically more difficult to identify in EGG data.
Figure 3.
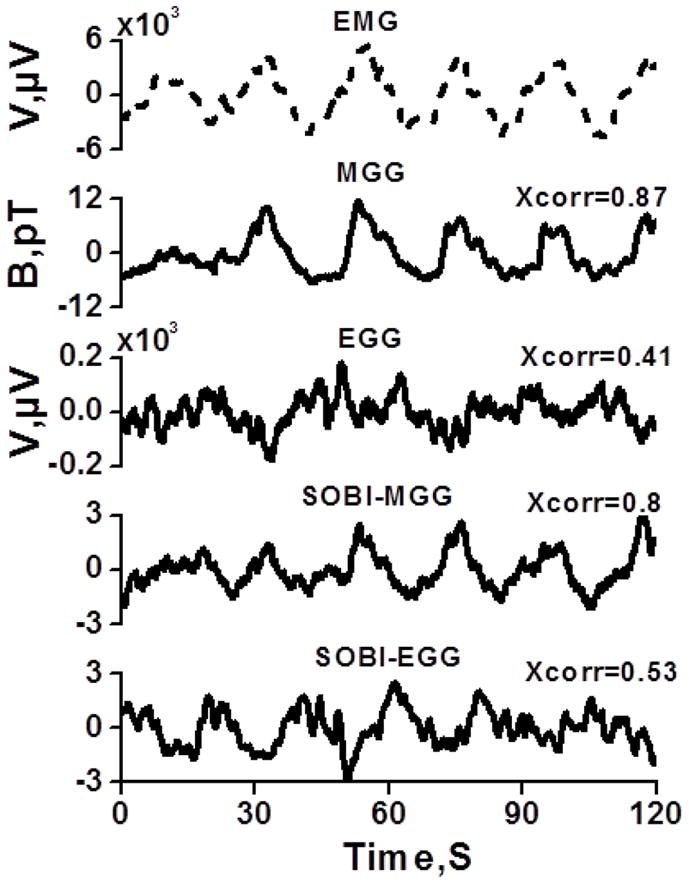
Waveform characteristics of the signal best correlated with the mucosal EMG signal for MGG, EGG, SOBI-MGG and SOBI-EGG components.
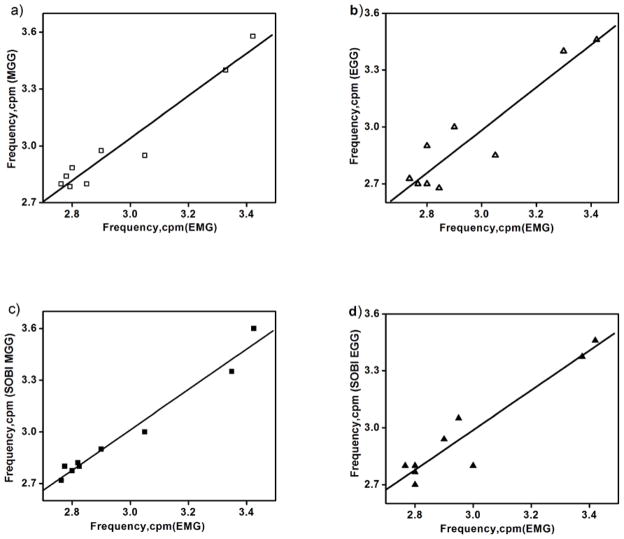
The frequency of the gastric slow wave activity recorded from SQUID and cutaneous electrodes closely matched those obtained in mucosal electrodes. The average gastric slow wave frequency over nine experiments was 2.97 ± 0.08 cpm (mean ± SE) in EMG, 2.94 ± 0.1 in EGG, 3.0 ± 0.1 in MGG, 2.97 ± 0.09 in SOBI-EGG and 2.97 ± 0.1 in SOBI-MGG, with no significant frequency difference detected in any modality. Figures 4 (a–d) show the peak frequencies indicated by FFT analysis of 2-min samples of mucosal electrode data against those determined by MGG, EGG, SOBI-MGG and SOBI-EGG. We found stronger correlation between mucosal electrode peak frequencies and SQUID (r = 0.97 for EMG/MGG, r = 0.99 for EMG/SOBI-MGG) than the correlation between mucosal and cutaneous electrode frequencies (r = 0.93 for EMG/EGG, r = 0.95 for EMG/SOBI-EGG).
Figure 4.
Correlation between gastric slow wave frequencies recorded by mucosal electrodes (EMG) to those recorded by (a) SQUID magnetometer (MGG), (b) cutaneous electrodes (EGG), (c) SOBI-MGG, and (d) SOBI-EGG. Data points represent peaks detected in FFT of 9 samples of magnetic and electric data. The peak frequencies determined by mucosal electrodes and SQUID are strongly correlated (correlation coefficient, r = 0.97 for EMG/MGG, r = 0.99 for EMG/SOBI- MGG) than between mucosal and cutaneous electrodes (r = 0.93 for EMG/EGG, r = 0.95 for EMG/SOBI- EGG). A linear fit to the data is also shown to emphasize the degree of correlation.
Over all nine experiments, the waveform correlations, i.e., the mean value of the maximum cross-correlation coefficient between EMG/MGG waveform was 0.68 ± 0.04 (mean ± standard error of the mean, SEM), while that for EMG/EGG was 0.55 ± 0.02, EMG/SOBI-MGG was 0.69 ± 0.03 and EMG/SOBI-EGG was 0.6 ± 0.04, as illustrated in figure 5. The correlation coefficient for MGG with mucosal EMG was higher than that for EGG with mucosal EMG (p < 0.05, unpaired Student’s t test). However, there was no significant difference between SOBI-EGG and SOBI-MGG correlation with mucosal EMG (p = 0.1, unpaired Student’s t test). Table I summarizes the results of waveform correlation study in nine subjects.
Figure 5.
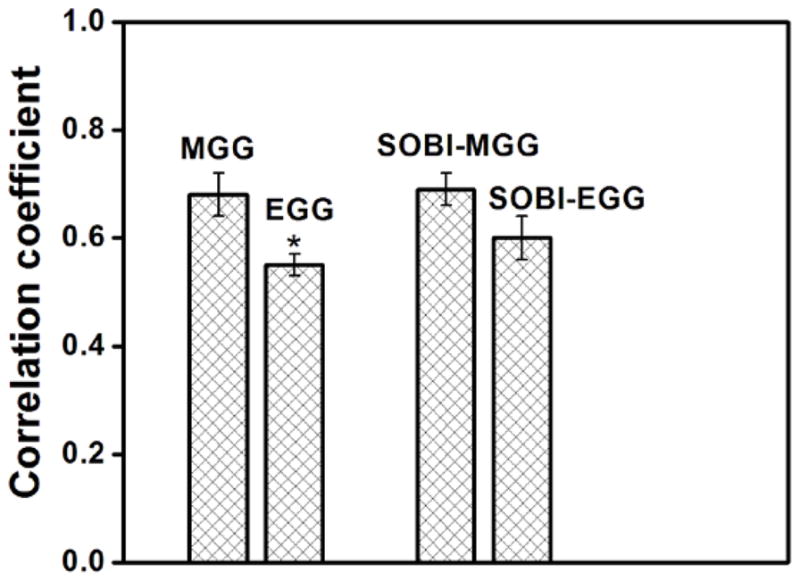
Waveform correlations, i.e., the mean value of the maximum cross-correlation coefficient between EMG/MGG, EMG/EGG, EMG/ SOBI-MGG and EMG/ SOBI-EGG waveforms. Over all nine experiments, the average correlation coefficient was 0.68 ± 0.04 (mean ± SEM) for MGG, 0.55 ± 0.02 for EGG, 0.69 ± 0.03 for SOBI-MGG and 0.60 ± 0.04 for SOBI-EGG components. A statistically significant difference between MGG and EGG correlation with mucosal EMG was observed (denoted by *).
TABLE 1.
Summary Results for Waveform Correlation study
| Subjects | EMG/MGG | EMG/EGG | EMG/SOBI-MGG | EMG/SOBI-EGG |
|---|---|---|---|---|
| 1 | 0.78 | 0.59 | 0.80 | 0.72 |
| 2 | 0.60 | 0.60 | 0.66 | 0.65 |
| 3 | 0.75 | 0.61 | 0.74 | 0.75 |
| 4 | 0.75 | 0.53 | 0.76 | 0.48 |
| 5 | 0.87 | 0.62 | 0.80 | 0.59 |
| 6 | 0.67 | 0.44 | 0.55 | 0.71 |
| 7 | 0.60 | 0.58 | 0.62 | 0.51 |
| 8 | 0.65 | 0.46 | 0.67 | 0.58 |
| 9 | 0.47 | 0.48 | 0.59 | 0.45 |
| (Mean± SE) | 0.68 ± 0.04 | 0.55 ± 0.02 | 0.69 ± 0.03 | 0.60 ± 0.04 |
The values quoted in the first nine rows are the maximum waveform correlation for individual experiments. The bottom row is the mean ± SE across all nine subjects.
4. Discussion and conclusion
We evaluated signals recorded from the multichannel MGG simultaneous with mucosal (EMG) and cutaneous (EGG) potential measurements in normal human subjects during the postprandial period. We limited our analysis to recording situations where the mucosal EMG could be clearly identified. In our experience, better contact is achieved between EMG electrodes and the gastric mucosa when the stomach is initially emptied by suction, after which both pre- and postprandial mucosal signals can be recorded reliably. Waveform correlations were sufficiently high to suggest that both cutaneous EGG and transabdominal MGG record essentially the same electrical activity as mucosal EMG, although waveform correlations were lower for EGG than for MGG when analysis was restricted to filtering alone. Application of SOBI algorithm improved the EGG waveform correlation. Our analysis in this work does not address potential spatiotemporal advantages of MGG suggested by previous work (Bradshaw et al 2001; Bradshaw et al 2006).
A recent study by Bayguinov et al (2011) suggests that electrophysiological recordings are easily contaminated by motion artifact. Although compelling counterarguments have appeared (O’Grady 2012), Bayguinov and colleagues call into question whether extracellular electrodes might record only muscular contraction and not electrical activity. While the debate continues, the strong correlation we observed suggests that MGG and EGG record essentially the same underlying activity as mucosal EMG, whether electrical or mechanical in nature. We hope to address these questions with future work.
Our data show that slow wave frequencies recorded by both MGG and EGG are strongly correlated with those determined from mucosal electrodes. Further, the cross-correlation of actual waveforms shows a substantial correlation, suggesting that specific waveform features captured by mucosal EMG are present in both EGG and MGG. It is interesting to note that without applying SOBI analysis, waveform correlations are actually higher for magnetic fields than for cutaneous potential, contrary to what one might expect if mechanical activity is a main contributor to the extracellular fields and potentials. While high correlations in both EGG and MGG with mucosal EMG could be explained easily if all three modalities were recording primarily mechanical activity, it is more difficult to explain why magnetic fields recorded without making contact with the body habitus would show stronger waveform correlation unless the primary contributor to the MGG is underlying electrical rather than mechanical activity. Nonetheless, these data by no means settle the question and future studies are required.
Previous work by Hamilton et al reported a similarity in the waveform and frequency of EGG signals to those recorded directly from human stomach mucosa with mucosal suction electrodes (Hamilton et al., 1986). However, no studies have examined the direct relationship between internal slow wave activity and the noninvasive MGG in humans. We believe this to be the first study on the correlation and comparison of invasive mucosal recordings to noninvasive multichannel SQUID recordings/cutaneous recordings. Our future studies will examine differences in spatiotemporal signal features relating to slow wave propagation reflected in EGG and MGG compared with mucosal EMG signals.
In conclusion, the magnetogastrogram in normal human volunteers is highly correlated with potentials recorded by invasive mucosal electrodes and offers information superior to cutaneous EGG when using standard filtering techniques. The MGG provides a noninvasive, noncontact method of assessment for the gastric slow wave.
Acknowledgments
This work is supported in part by NIH grants R01 DK58697 and R01 DK58197. The authors wish to thank the staff of the SR Light laboratories at Vanderbilt University Medical Center for their assistance in this study. We gratefully acknowledge the work of Dr. Jon Erickson who developed the SOBI algorithm for the analysis of gastrointestinal activity.
References
- Bayguinov O, Hennig GW, Sanders KM. Movement based artifacts may contaminate extracellular electrical recordings from GI muscles. Neurogastroenterol Motil. 2011;23(11):1029–1042. doi: 10.1111/j.1365-2982.2011.01784.x. [DOI] [PMC free article] [PubMed] [Google Scholar]
- Belouchrani A, AbedMeraim K, Cardoso JF, Moulines E. A blind source separation technique using second-order statistics. Ieee Transactions on Signal Processing. 1997;45:434–44. [Google Scholar]
- Bradshaw L, Sims J, Richards W. Noninvasive characterization of gastric slow wave by magnetogastrography, electrogastrography and intraluminal gastric manometry in human subjects. Gastroenterology. 2005;128:A544–A. [Google Scholar]
- Bradshaw LA, Allos SH, Wikswo JP, Jr, Richards WO. Correlation and comparison of magnetic and electric detection of small intestinal electrical activity. Am J Physiol. 1997;272:G1159–67. doi: 10.1152/ajpgi.1997.272.5.G1159. [DOI] [PubMed] [Google Scholar]
- Bradshaw LA, Irimia A, Sims JA, Gallucci MR, Palmer RL, Richards WO. Biomagnetic characterization of spatiotemporal parameters of the gastric slow wave. Neurogastroenterol Motil. 2006;18:619–31. doi: 10.1111/j.1365-2982.2006.00794.x. [DOI] [PubMed] [Google Scholar]
- Bradshaw LA, Irimia A, Sims JA, Richards WO. Biomagnetic signatures of uncoupled gastric musculature. Neurogastroenterol Motil. 2009;21:778–e50. doi: 10.1111/j.1365-2982.2009.01265.x. [DOI] [PMC free article] [PubMed] [Google Scholar]
- Bradshaw LA, Myers AG, Redmond A, Wikswo JP, Richards WO. Biomagnetic detection of gastric electrical activity in normal and vagotomized rabbits. Neurogastroenterol Motil. 2003;15:475–82. doi: 10.1046/j.1365-2982.2003.00432.x. [DOI] [PubMed] [Google Scholar]
- Bradshaw LA, Richards WO, Wikswo JP., Jr Volume conductor effects on the spatial resolution of magnetic fields and electric potentials from gastrointestinal electrical activity. Med Biol Eng Comput. 2001;39:35–43. doi: 10.1007/BF02345264. [DOI] [PubMed] [Google Scholar]
- Bradshaw LA, Sims JA, Richards WO. Noninvasive assessment of the effects of glucagon on the gastric slow wave. Am J Physiol Gastrointest Liver Physiol. 2007;293:G1029–38. doi: 10.1152/ajpgi.00054.2007. [DOI] [PMC free article] [PubMed] [Google Scholar]
- Erickson J, Obioha C, Goodale A, Bradshaw A, Richards W. Noninvasive detection of small bowel electrical activity from SQUID magnetometer measurements using SOBI. Conf Proc IEEE Eng Med Biol Soc. 2008;2008:1871–4. doi: 10.1109/IEMBS.2008.4649550. [DOI] [PubMed] [Google Scholar]
- Erickson JC, Obioha C, Goodale A, Bradshaw LA, Richards WO. Detection of small bowel slow-wave frequencies from noninvasive biomagnetic measurements. IEEE Trans Biomed Eng. 2009;56:2181–9. doi: 10.1109/TBME.2009.2024087. [DOI] [PMC free article] [PubMed] [Google Scholar]
- Hamilton JW, Bellahsene BE, Reichelderfer M, Webster JG, Bass P. Human electrogastrograms. Comparison of surface and mucosal recordings. Dig Dis Sci. 1986;31:33–9. doi: 10.1007/BF01347907. [DOI] [PubMed] [Google Scholar]
- Kim JH, Bradshaw LA, Pullan AJ, Cheng LK. Characterization of gastric electrical activity using magnetic field measurements: a simulation study. Ann Biomed Eng. 2009;38:177–86. doi: 10.1007/s10439-009-9804-0. [DOI] [PMC free article] [PubMed] [Google Scholar]
- Mintchev MP, Bowes KL. Extracting quantitative information from digital electrogastrograms. Medical & Biological Engineering & Computing. 1996;34:244–8. doi: 10.1007/BF02520081. [DOI] [PubMed] [Google Scholar]
- Mintchev MP, Kingma YJ, Bowes KL. Accuracy of Cutaneous Recordings of Gastric Electrical-Activity. Gastroenterology. 1993;104:1273–80. doi: 10.1016/0016-5085(93)90334-9. [DOI] [PubMed] [Google Scholar]
- Monges H, Salducci J. A method of recording the gastric electrical activity in man. Am J Dig Dis. 1970;15:271–276. doi: 10.1007/BF02233459. [DOI] [PubMed] [Google Scholar]
- O’Grady G. Gastrointestinal extracellular electrical recordings: fact or artifact? Neurogastroenterol Motil. 2012;24(1):1–6. doi: 10.1111/j.1365-2982.2011.01815.x. [DOI] [PMC free article] [PubMed] [Google Scholar]


