

Abstract
The presynaptic serotonin (5-HT) transporter (SERT) is targeted by widely prescribed antidepressant medications. Altered SERT expression or regulation has been implicated in multiple neuropsychiatric disorders, including anxiety, depression and autism. Here, we implement a generalizable strategy that exploits antagonist-conjugated quantum dots (Qdots) to monitor, for the first time, single SERT proteins on the surface of serotonergic cells. We document two pools of SERT proteins defined by lateral mobility, one that exhibits relatively free diffusion, and a second, localized to cholesterol and GM1 ganglioside-enriched microdomains, that displays restricted mobility. Receptor-linked signaling pathways that enhance SERT activity mobilize transporters that, nonetheless, remain confined to membrane microdomains. Mobilization of transporters arises from a p38 MAPK-dependent untethering of the SERT C terminus from the juxtamembrane actin cytoskeleton. Our studies establish the utility of ligand-conjugated Qdots for analysis of the behavior of single membrane proteins and reveal a physical basis for signaling-mediated SERT regulation.
Introduction
In the brain and periphery, signaling by the neurotransmitter serotonin (5-hydroxytryptamine, 5-HT) relies on efficient, transporter-mediated reuptake to terminate synaptic signals. The presynaptic, antidepressant-sensitive 5-HT transporter (SERT, 5HTT), encoded in humans by the SLC6A4 gene, is primarily responsible for 5-HT clearance and has been the focus of much attention as a determinant of neuropsychiatric disease risk (Murphy et al., 2008). Both transcriptional and post-translational mechanisms exert powerful control over SERT-mediated 5-HT transport, though many aspects of SERT regulation are as yet ill-defined (Steiner et al., 2008). SERT is known to undergo both regulated membrane trafficking as well as transitions between low and high activity states, with multiple, intracellular signaling pathways involved, including pathways linked to the activation of PKC, PKG and p38 MAPK (Steiner et al., 2008; Ramamoorthy et al., 2011). These stimuli may act directly, for example via transporter phosphorylation (Ramamoorthy and Blakely, 1999; Ramamoorthy et al., 2011). Additionally, biochemical studies indicate that SERT exhibits dynamic associations with cytoskeletal binding proteins (Carneiro and Blakely, 2006; Steiner et al., 2008). As altered posttranslational regulation of SERT by these mechanisms is a feature of coding variants identified in subjects with obsessive-compulsive disorder (OCD) and autism (Ozaki et al., 2003; Prasad et al., 2005, 2009; Sutcliffe et al., 2005); a more detailed mechanism that supports regulation of the wild-type transporter is needed.
Biochemical studies that assess the distribution of large populations of molecules indicate that SERT proteins and related transporters localize to cytoskeleton-associated, cholesterol-rich membrane microdomains, compartments that may also dictate aspects of transporter regulation (Scanlon et al., 2001; Magnani et al., 2004; Carneiro and Blakely, 2006). Such studies, however, do not provide sufficient resolution to monitor the behavior of individual molecules that, collectively, contribute to the macroscopic features of transporter behavior. Ion channels can be monitored at the single molecule level by patch-clamp recording techniques. Generally, cell surface transporters and receptors cannot be studied with this approach due to low or absent electrogenicity needed for patch-clamp recordings. Antibody-based optical methods have been used to identify a few single membrane proteins (Dahan et al., 2003; Fichter et al., 2010), however, many proteins lack suitable extracellular domains that can be targeted by antibodies without functional disruption. Taking advantage of their remarkable brightness and extraordinary photostability properties, quantum dots (Qdots) are increasingly being used for the detection of biomolecules in living cells (Alivisatos, 2004; Michalet et al., 2005; Howarth et al., 2008). Compared with conventional ensemble biochemical methods, single Qdot tracking allows for a detailed biophysical characterization of protein movements that can provide a real-time report of the unitary events associated with regulation (Dahan et al., 2003). In this report, we implement a ligand-conjugated Qdot approach (Rosenthal et al., 2002) to monitor single Qdot-labeled SERT proteins in living, neuronal cells, providing evidence that actin-based mechanisms dictate p38 MAPK-dependent transporter activation. More generally, our successful use of Qdots targeted to cell surface proteins by high-affinity ligands establishes a paradigm that should be of broad utility in defining the single molecule behavior of drug targets.
Materials and Methods
Cell culture, treatments, and SERT activity assay.
The immortalized serotonergic neural cell line, RN46A (White et al., 1994), was provided by Dr. Scott R. Whittemore (University of Miami School of Medicine). Cells were cultured in DMEM/F12 (1:1; Invitrogen) supplemented with 10% FBS and incubated in a humidified atmosphere with 5% CO2 at 37°C. Although RN46A cells endogenously express functional SERT proteins, an increase in SERT expression can be obtained by incubating cells in DMEM/F12 (1:1) containing a 1% B27 supplement (Invitrogen) plus 1 μm 5-HT for 24 h before single molecule labeling experiments.
For experiments involving peptide treatments, RN46A cells were preincubated with a synthetic peptide at 10 μm for 30 min (37°C; 5% CO2) before the assay. Synthetic peptides (>95% purity) used in the study were purchased from Thermo Scientific, and carried the sequences as followed: C-SERT: YGRKKRRQRRR(TAT)-ETPTEIPCGDIRMNAV, U-SERT: YGRKKRRQRRR(TAT)-PGTFKERIIKSITPETPREI.
SERT activity in living RN46A cells was examined by using IDT307, a fluorescent neurotransmitter substrate (Blakely et al., 2011, U.S. Patent Number 7947255 B2). IDT307 is nonfluorescent in solution but fluoresces as the substrate is accumulated, affording real time kinetic evaluation of SERT activity. A straightforward assay to verify successful SERT expression in RN46A cells simply involved the addition of IDT307 directly to the culture media at a final concentration of 5 μm and incubating at 37°C for 30 min. Time-lapse fluorescent images were then acquired immediately after IDT307 addition, and successful transporter expression was evident by an observable increase in intracellular fluorescence. No additional rinsing was required since IDT307 is only fluorescent in intracellular environments, and any excess of IDT307 in solution did not result in any observable fluorescent background.
Labeling RN46A cells with ligand-conjugated Qdots.
For single Qdot labeling of SERT proteins, biotinylated IDT318 ligand was first incubated with RN46A cells followed by three washes to remove unbound ligand. Streptavidin-conjugated Qdots (SAv-Qdots) (Invitrogen) were then added to detect the biotinylated moiety of antagonist-associated linker. To minimize the possibility of cross-linking of ligands and the overlap of QD trajectories, we adapted the Qdot-based, single molecule labeling protocol of Triller and colleagues (Bannai et al., 2006), where the ligand concentration (0.5 μm) is set well below saturation (saturation concentration: ≥10 μm). In addition, low concentrations (0.5 nm) of SAv-Qdots were used to detect ligand binding at the lowest recommended concentration as studied by Triller and colleagues (Bannai et al., 2006).
For experiments involving cholesterol depletion, cells were incubated with 5 μm methyl-β-cyclodextrin (MβCD) (Sigma) at 37°C for 30 min before two-step Qdot-SERT labeling. The MβCD cholesterol depletion protocol we used does not result in overt changes in RN46A cell morphology, though more prolonged incubations (90 min) of RN46A cells with 10 μm MβCD at 37°C produce cell rounding paralleled by a decrease in SERT mobility.
For experiments involving the labeling of plasma membrane GM1 ganglioside, RN46A cells were first incubated with 0.2 μm biotinylated cholera toxin subunit B (CTxB) (CTxB:biotin molar ratio ≈1:1 to avoid cross-linking, Sigma) for 30 min before a 5 min 0.5 nm SAv-Qdot incubation. Importantly, GM1 ganglioside-CTxB association has been shown elicit endocytosis (Orlandi and Fishman, 1998; Balasubramanian et al., 2007). To avoid endocytosis and to achieve successful quantification in dual-channel imaging, all optical live-cell images were taken immediately after Qdot labeling. Endocytosis from longer labeling experiments could be readily detected by an accumulation of larger clusters of Qdots within the endosomes.
Microscopy.
Confocal images were obtained on a Zeiss LSM 510META confocal imaging system. A dual fluorescent, Differential Interference Contrast (DIC) imaging setup was used for conventional point scanning confocal microscopy. Images were collected using a Zeiss Plan-Apochromat 63×/1.4 numerical aperture (NA) oil-immersion objective lens and excited by an Argon laser at 488 nm. All images were 512 × 512 pixels in size and had an 8-bit pixel depth. IDT307 or Alexa 488-labeled CTxB signals were collected through a 520/20 bandpass filter. QD655 labeling was collected through a 650 nm long bandpass filter. Dual channel fluorescent signals were collected individually to ensure that fluorescent signals could be selected without emission wavelength overlap. Images were processed using Zeiss Image LSM Examiner or Matlab routines originally designed by Esposito et al. (2007). All images acquired for comparison were thresholded equivalently.
For high speed line-scanning confocal microscopy, images were obtained on a Zeiss LSM 5 Live confocal system and viewed with a Zeiss 63×/1.4 NA oil-immersion objective lens. Excitation was provided by a 488 nm 100-milliwatt diode laser. Imaging was performed at 37°C. Single Qdot emission was collected using a long pass 650 filter. Line scan images with scan format of 512 × 128 pixels were processed using Zeiss LSM Image Examiner.
Data analysis of single quantum dot imaging.
Real-time tracking of single Qdot labeled SERT proteins was obtained using a Zeiss 5 Live line-scanning confocal microscope. Individual recording of each sample was performed at 37°C for 1 min at a scanning speed of 1 frame/100 ms. Raw data files were extracted to generate stacks of individual 16 bit TIF images for single molecule tracking. Positions (x and y coordinates) and trajectories of the single Qdot-labeled SERT proteins were determined by Matlab routines developed by Jaqaman et al. (2008). Single Qdots undergo fluorescence intermittency, which can contribute to the trajectory assessment and may cause difficulty in tracking. To effectively decrease Qdot blinking probability, we decreased excitation laser power through defining the SNR only above 6. In addition, as suggested by Dahan and colleagues (Ehrensperger et al., 2007), segment linking was processed to obtain trajectories as long as possible and blinking tolerance was limited to no more than 10 consecutive frames. Segment linking for complete trajectory generation was performed via the method described by Cohen and colleagues (Bonneau et al., 2005)
MSD values for individual trajectories were calculated according to the formula listed below:
 |
where Δt is the time-resolution, x(jΔt + nΔt) and y(jΔt + nΔt) are the x and y coordinates following a time interval of nΔt after starting at the position (x(jΔt), y(jΔt)), N is the total number of frames, n is the number of time intervals, and j is a positive integer. Calculation of MSD, velocity, least-square fitting, and numerical distribution functions were processed using Matlab and Sigmaplot programming routines (Vrljic et al., 2007).
Although a complete understanding of the diffusion processes of membrane transporters is still lacking, temporary lateral confinement of a diffusing protein due to local environmental constraints such as interaction with lipid rafts or cytoskeletal corrals can be best described as anomalous subdiffusion (Martin et al., 2002). For a stochastic process of anomalous diffusion, monitored continuously, others have previously established that such movements can be ascribed to Lévy processes (Zumofen and Klafter, 1994; Klafter and Sokolov, 2005). We investigated the distribution of instantaneous velocity (instantaneous movement over time) of single SERT proteins in RN46A cells and found that the distribution follows a non-Gaussian distribution. The statistical distribution of instantaneous velocities of single SERT proteins is well fit to the Lévy probability distribution function:
 |
where x0 is the location parameter (the best fit instantaneous movement) and r represents the interquartile range (the half-width at half-maximum) of the fitted step distance, meaning the statistical dispersion of the probability distribution. For practical applications, the Lévy probability distribution function can be simplified as a truncated Cauchy distribution:
 |
where a and b are only treated as fit coefficients in the defined function, and the goodness of the fit is judged by the R2 value. In all of our analyses, the R2 values of the fit of instantaneous velocity are higher than 95%, indicating high reliability of our fits.
Results
Single molecule analysis of Qdot-labeled SERT reveals a membrane microdomain-associated subpopulation of transporters with confined diffusion
The schematic in Figure 1A illustrates our Qdot-SERT labeling strategy and depicts the chemical structure of our custom-synthesized SERT ligand, IDT318, which consists of the indoleamine derivative 5-Methoxy-3-(1,2,5,6-tetrahydro-4-pyridinyl)-1H-indole (Adkins et al., 2001), attached to a biotinylated polyethylene glycol (PEG 5000) linker via an alkyl spacer. The ligand has been previously shown to act as a competitor for SERT-dependent, 5-HT uptake and antagonist binding (Adkins et al., 2001; Chang et al., 2011), and the ligand specificity and affinity were previously described in detail (Chang et al., 2011). A two-step labeling of SERT by SAv-Qdots was designed to permit fluorescence-based detection of surface SERT proteins. We labeled single SERT proteins in differentiated, RN46A cells that are derived from rat embryonic raphe neurons (White et al., 1994). These cells express low levels of SERT, facilitating the tracking of single SERT molecules (Steiner et al., 2009). We monitored single SERT proteins in living RN46A cells across 10 s time-lapse sequences at 10 Hz (Fig. 1B), where individual Qdots show a pattern of fluorescence intermittency (“blinking”), a hallmark of single Qdot detection (Nirmal et al., 1996).
Figure 1.

Tracking of Qdot-labeled single SERT proteins. A, Schematic of Qdot nanoconjugates for SERT labeling. The SERT ligand (IDT318) incorporates a biotin moiety to permit conjugation by SAv-Qdot, a PEG chain to reduce steric interference and nonspecific binding, an alkyl spacer to provide accessibility to the binding site, and a SERT-selective drug derivative to facilitate specific recognition of SERT. B, Time series images of single Qdot-SERT proteins on the surface close to the cell body (left column) or neuritic process (right column) of living RN46A cells. Time points where Qdot-labeled SERT proteins exhibit “blinking” are indicated by the dashed circles. C, Presence of SERT proteins within GM1 enriched membrane microdomains and their mobility in control and cholesterol depleted cells. First row: DIC images. Second row: staining of membrane rafts using Alexa 488-conjugated CTxB. Third row: Qdot-SERT proteins. Fourth row: colocalization of CTxB and Qdot labeling. Arrowheads note the presence of puncta labeled for both markers.
Adkins et al. (2007), using transfected cells and conventional fluorescence methods to study transporter populations, visualized dopamine transporters in cholesterol-rich membrane microdomains (often referred to as “lipid rafts” or “membrane rafts”; Schütz et al., 2000; Allen et al., 2007). Magnani et al. (2004), using classical biochemical approaches, provided evidence that extraction of membrane cholesterol from brain preparations reduce SERT activity. To determine whether native SERT associates with these microdomains in living, neuronal cells and whether these domains represent membrane rafts, we performed dual-color, live-cell confocal imaging of RN46A cells (White et al., 1994) with the two-step labeling methods as described above. Cholesterol-rich microdomains were identified using Alexa Fluor 488-conjugated CTxB, a protein that binds specifically to ganglioside GM1, a molecule that has previously been shown to localize to membrane rafts (Kenworthy et al., 2000). As shown in Figure 1C, images of RN46A cells revealed extensive CTxB/SERT colabeling, including the presence of single particles as defined above. To verify that the pattern of the clustered SERT/GM1 colabeling indeed derives from cholesterol-rich membrane microdomains; we extracted cholesterol with methyl-β-cyclodextrin (MβCD), followed by subsequent dual marker labeling (Scanlon et al., 2001). As predicted, this manipulation dispersed the punctate labeling of both CTxB and Qdot-SERT labeling of RN46A cells (Fig. 1C, right).
Next, we obtained real-time trajectory data for single Qdot-SERT complexes under control and MβCD-treated conditions (Fig. 2A,B). Inspecting these trajectories reveals that lateral movement of single SERT molecules are nonuniform in both cases, with a mixture of movements distinguished by distinct rates but with a relative continuity of motion. Notably, single Qdot complexes predominantly display limited movement under control conditions (Fig. 2A), whereas single SERT proteins in cholesterol-depleted cells displayed noticeably accelerated, lateral movements (Fig. 2B).
Figure 2.
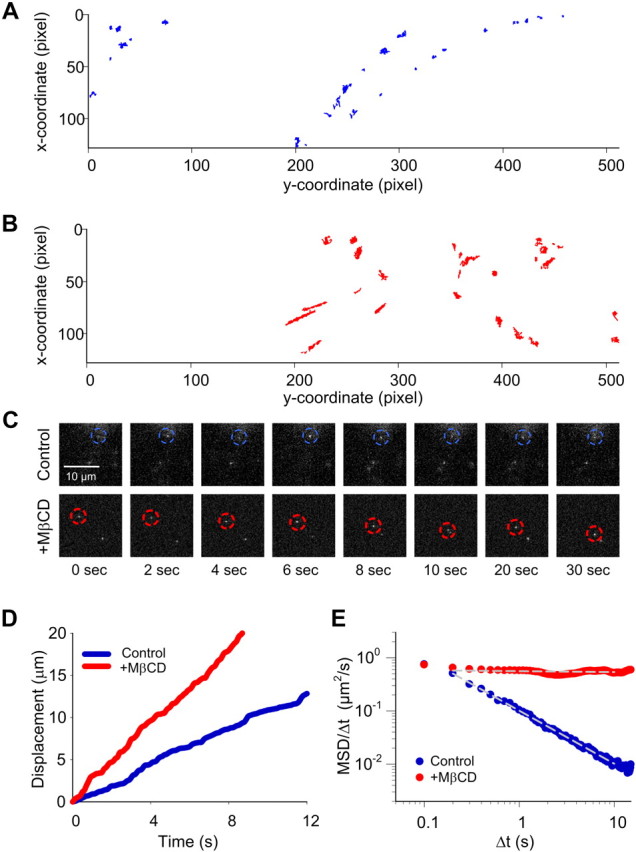
Single Qdot-SERT tracking in living serotonergic RN46A cells under control and MβCD-treated conditions. A, Full trajectory reconstruction from 30 s time-lapse videos of single Qdot-labeled SERT proteins in control (A) and cholesterol deleted (B) RN46A cells. Video frame size: 512 × 128 pixels, pixel size: 0.2 μm. Note the more mobile behavior of single SERT trajectories after MβCD treatment. C, Temporal profile of representative Qdot-labeled, single SERT proteins with and without MβCD treatment. D, Comparison of displacement over time of the representative single Qdot-SERT complexes in C. E, Plot of MSD/Δt as a function of Δt of the representative single SERT proteins in C on a log-log scale. Single SERT under MβCD-treated condition shows the pattern expected of free diffusion whereas SERT from untreated cells demonstrates a pattern consistent with motion restriction, or anomalous subdiffusion. White, dashed lines in E represent a least-squares best-fit of the data.
For the demonstration of standard protocols for diffusion analyses before an introduction of analyses for larger ensembles, a representative time-lapse example from each group is given (Fig. 2C). In Figure 2D, we quantified the impact of MβCD on time-dependent displacements (step movements) of single Qdot-SERT complexes. As revealed in the greater slope of particle displacement, plotted as a function to time, cholesterol-depleted conditions resulted in significantly faster Qdot-SERT movements (red trace) (p < 0.0001 from averaged traces, Student's t test), consistent with a mobilization of transporters following disruption of membrane microdomains. These elevated step velocities can be derived from confined diffusion, Brownian movement, or directed movement, and thus do not describe how a target protein interacts with the surrounding membrane microenvironment. Since single Qdot-labeled SERT proteins predominantly display limited movement (Fig. 2A), we assume that single SERT proteins are restricted to membrane microdomains. In that case, the diffusion property of single SERT proteins can be appropriately characterized as anomalous subdiffusion (Saxton, 2007), a time-dependent decrease of the diffusion coefficient as a result of temporary confinement (i.e., interaction with lipid rafts or cytoskeletal corrals) of a diffusing protein (Martin et al., 2002). Following the relation between transient diffusion coefficient D (t) and tracking time (t), free diffusion versus anomalous subdiffusion can be readily distinguished by a plot of log D (t) versus log t (log-log plot), in which a line of negative slope reflects subdiffusion whereas a horizontal line indicates free diffusion. The transient anomalous diffusion coefficient D (t) can be calculated as the mean squared displacement (MSD or 〈r2〉), D (t) = 〈r2〉 ∝ tα, where α is the anomalous exponent (Saxton, 2007). Shown in Figure 2E is the log-log plot of single SERT proteins using the same position data as shown in Figure 2D. As expected, the single Qdot-SERT complex under control condition exhibited restricted, anomalous subdiffusion. In contrast, and consistent with macroscopic assessments, the diffusion property of single SERT protein is best fit to a model dominated by free diffusion after MβCD treatment.
To further distinguish transporter movements from control and cholesterol-depleted cells, we inspected the trajectories of a larger number of single SERT molecules. Consistent with the findings from the representative experiments indicated in Figure 2C, examination of total displacement of single SERT molecules as a function of time (n > 50, from 3 independent experiments) demonstrates an approximately two times faster average rate of movement for MβCD-treated cells versus control cells (Fig. 3A). Since the single SERT trajectories collected in our experiments varied from 5 to 30 s in duration, using the mean slope from the total displacement over time to calculate single SERT velocity could have impacted our results. A better assessment of single SERT mobility can be achieved by the calculation of an instantaneous velocity where the distribution of a single step displacement (x) can be fitted into a Lévy probability distribution function (see Materials and Methods, Data analysis of single quantum dot imaging).
Figure 3.

Single Qdot-labeled SERT proteins demonstrate elevated SERT lateral mobility after membrane raft disruption. A, Distributions of the instantaneous displacement of single SERT proteins in control (black, n = 52) and MβCD-treated (red, n = 51) conditions. B, Comparison of instantaneous velocities of single SERT proteins in untreated and MβCD-treated RN46A cells. Each set of data was collected from 3 independent experiments.
Note that the dynamic behavior of nanoscale assemblies in the plasma membrane of live cells must be observed on the subsecond timescale or below (Simons and Gerl, 2010), hence our use of an instantaneous velocity approach. Although the PEG linker we used to tether the SERT ligand appears to reduce the steric interference of Qdots with SERT, this linker may also increase the uncertainty of SERT velocity assessments. We minimized this uncertainty by calculating instantaneous velocity from a large ensemble of instantaneous displacements (>3000). From these fits, we determined a mean, instantaneous velocity of Qdot-SERT molecules of 0.75 ± 0.06 μm/s (mean ± 95% confidence limits) in untreated cells (Fig. 3B). Consistent with our mean slope-based estimates, fits from MβCD-treated cells yielded a significant increase in instantaneous velocity (1.74 ± 0.08 μm/s, p < 0.0001, Student's t test). The log-log plot of MβCD-treated cells also clearly show an increase in slope, indicative of reduced constraints on lateral mobility (compare Fig. 4A and C). The population distribution of single particle diffusion coefficients from untreated cells reveals two components (Fig. 4B) with a majority of the SERT proteins residing in the component with lower diffusion coefficients (10−3∼10−2 μm2/s). In contrast, only a single distribution of diffusion coefficients could be detected for SERT proteins in MβCD-treated cells (Fig. 4D), matching the minority population detected in untreated cells (10−2∼10−1 μm2/s).
Figure 4.
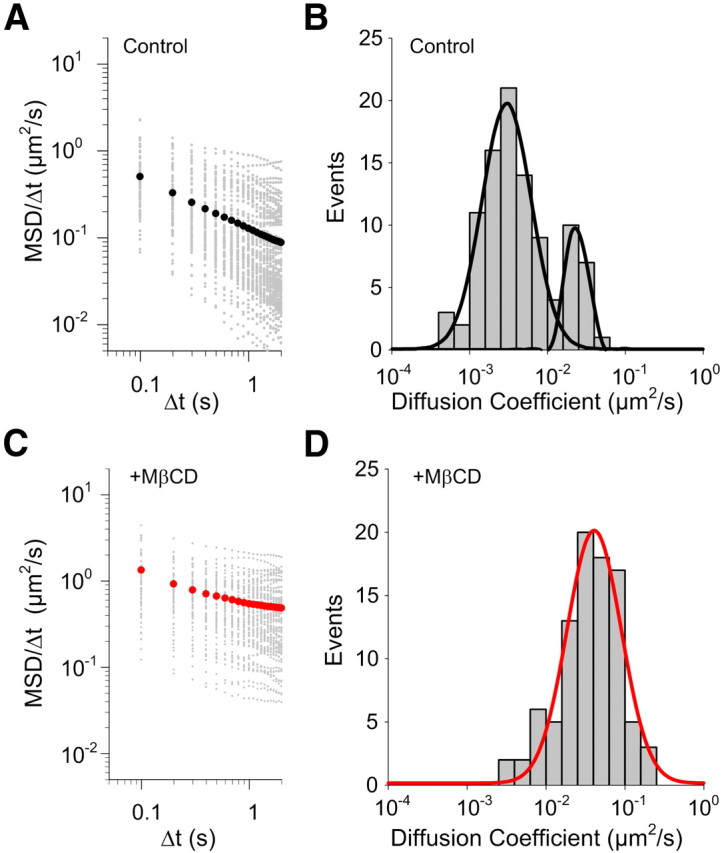
Characterization of the dynamic behavior of single SERT proteins. Plots of MSD/Δt as a function of Δt and distribution of diffusion coefficient of single SERT proteins in control cells (A, B; n = 98) and in MβCD-treated cells (C, D, n = 91). A, B, Although the variability exists in both cases, the majority of SERT proteins in untreated cells display confined diffusion pattern with lower diffusion coefficient values. C, D, In contrast, single SERT proteins after MβCD treatment follow free diffusion with higher diffusion coefficients. Black circles in A and red circles in C present the average MSD/Δt. B and D were fit to double and single Gaussian distributions, respectively.
Single Qdot-labeled SERT proteins demonstrate increased SERT lateral mobility, despite a confined distribution, after 8-Br-cGMP treatment
Although our direct observations, along with the chemical manipulation of RN46A cells, revealed inherent restrictions in the mobility of single, plasma membrane SERT proteins, such treatments do not address the degree to which mobility restrictions contribute to physiologically relevant features of transporter regulation. As noted above, SERT membrane trafficking and catalytic activity are under tight regulation by multiple signaling pathways (Steiner et al., 2008) that are affected by OCD and autism SERT mutations (Ozaki et al., 2003; Prasad et al., 2005, 2009; Sutcliffe et al., 2005). Activation of PKG by cGMP analogs in both SERT-transfected and native SERT-expressing, RN46A cells triggers SERT phosphorylation, enhanced SERT surface trafficking, and an increase in 5-HT uptake rates (Steiner et al., 2008). Moreover, OCD- and autism-associated SERT coding variants display altered PKG-dependent SERT phosphorylation, trafficking and/or catalytic activation in vitro and in vivo (Ozaki et al., 2003; Prasad et al., 2005, 2009; Veenstra-VanderWeele et al., 2012). We thus sought to determine whether PKG activation produces an altered motion behavior of SERT proteins localized to membrane subdomains. To investigate the above hypothesis, we compared the instantaneous velocity of single SERT proteins in control and 8-bromo cGMP (8-Br-cGMP, a membrane-permeable cGMP analog that activates PKG)-treated RN46A cells. Interestingly, we detected a significant, ∼2-fold, increase in the mean instantaneous velocity after 8-Br-cGMP treatment (Fig. 5A) (1.60 ± 0.03 μm/s versus 0.75 ± 0.06 μm/s, p < 0.0001, Student's t test). Additionally, when we performed diffusion coefficient analysis on 8-Br-cGMP-treated cells, the distribution of SERT diffusion rates after 8-Br-cGMP treatment still resulted in bimodal behavior (Fig. 5B), although a significant increase in higher diffusion rates was observed compared with the untreated cells (Fig. 4B).
Figure 5.

Effect of 8-Br-cGMP on SERT lateral mobility. A, Comparison of instantaneous velocities of single SERT proteins in untreated and 8-Br-cGMP stimulated cells. B, Distribution of diffusion coefficient of single SERT proteins (n = 90) after 8-Br-cGMP treatment and fit with double Gaussian distributions. C, Plots of MSD/Δt as a function of Δt of single SERT proteins (n = 90) in MβCD-treated cells are shown. Black circles and red circles show the average MSD/Δt of constrained (75.6%) and mobile (24.5%) population of single SERT trajectories. D, Comparison of instantaneous velocities of single SERT proteins in 8-Br-cGMP stimulated or 8-Br-cGMP plus SB203580 (SB) cotreated cells. Data derived from 3–6 independent experiments.
The increase in SERT instantaneous velocity, accompanied by elevated diffusion rates, following 8-Br-cGMP treatment that are known to elevate SERT activity were surprising. As above, we noted that we increased SERT mobility accompanies MβCD treatment that produce a reduction in SERT activity (Scanlon et al., 2001; Magnani et al., 2004). Furthermore, the anomalous exponent α derived from log-log plots (Fig. 5C) indicates that 75.6% of SERT proteins in 8-Br-cGMP-treated cells exhibit confined lateral diffusion, similar to the fraction (89.8%) observed with untreated cells. Thus, despite the observation that accelerated SERT movements are evident for a large fraction of SERT molecules following 8-Br-cGMP treatment, the majority of SERT proteins appear to remain highly constrained in membrane microdomains.
The p38 MAPK inhibitor SB203580 attenuates 8-Br-cGMP-induced enhancements in SERT lateral mobility
Treatment of RN46A cells with 8-Br-cGMP induces a PKG-dependent mobilization of intracellular SERT loaded vesicles, leading to an increase of SERT cell surface density (Steiner et al., 2008). Since our Qdot-SERT surface labeling paradigm should be insensitive to the trafficking of unlabeled intracellular SERT proteins to the cell surface, we suspect that the altered mobility of SERT proteins after 8-Br-cGMP treatment might relate to the transport rate enhancement (catalytic activation) of surface transporters that arises subsequent to PKG-stimulated membrane trafficking (Prasad et al., 2005; Steiner et al., 2008). Previously, we showed that SERT catalytic activation arises as a result of PKG-triggered p38 MAPK activation that in turn stabilizes SERT in a conformation recognizing serotonin with higher-affinity (Zhu et al., 2004, 2005). Therefore, we asked whether p38 MAPK activation is essential for the observed changes in SERT movements following 8-Br-cGMP treatment by coincubating cells treated with 8-Br-cGMP with the specific p38 MAPK inhibitor SB203580. As shown in Figure 5D, coincubation of 8-Br-cGMP-treated RN46A cells with SB203580 significantly attenuated the increase in SERT instantaneous velocity observed with 8-Br-cGMP alone.
To visualize better the displacements of single SERT movements following different treatments, we plotted lateral trajectories of single transporter movements over a 5 s recording interval (d5S), comparing control, MβCD, and 8-Br-cGMP treatments (Fig. 6A–C). Whereas instantaneous velocity is used to monitor the dynamic behavior at a relatively short timescale, 5 s displacement measures provide an estimation of the extent of lateral movement, thereby estimating the borders of the membrane compartment occupied by single SERT proteins. As can be seen in Figure 5A,B, single SERT proteins in untreated cells displayed limited displacement, whereas the movements in MβCD-treated cells exhibit significantly greater dispersal. Our results demonstrate that 8-Br-cGMP treatment (or 8-Br-cGMP/SB203580 cotreatment) generates SERT displacements that are indistinguishable from untreated cells when monitored at a longer timescale (Fig. 6C,D). Thus, cGMP-linked signaling pathways appear to enhance SERT activity without a dissociation of transporters from the membrane microdomains in which they were initially labeled.
Figure 6.

p38 MAPK-dependent increase in SERT mobility in the absence of lateral dispersion. A–E, 2D Polar plots of 5 s displacements (d5s) of single SERT movements, normalized to their starting coordinates under control, MβCD, 8-Br-cGMP, 8-Br-cGMP plus SB203580, and IL-1β-treated conditions, respectively. Plots provide data in pixel units (200 nm/pixel). Data were collected from 3 to 6 independent experiments with 90–100 trajectories for each condition. F, Comparison of instantaneous velocities of single SERT proteins in untreated and IL-1β stimulated cells. The best-fit velocity distribution of IL-1β-treated SERT proteins reveals a dominant population (76.9%) with higher velocities and a minor population (23.1%) with lower velocities. G, Distribution of diffusion coefficient of single SERT proteins (n = 99) after IL-1β treatment (double Gaussian fit).
IL-1β activated single SERT proteins reveal p38 MAPK-dependent subpopulation
Having linked increased mobility of SERT proteins within the membrane rafts to p38 MAPK-dependent pathways, we asked whether a natural stimulus that produces p38 MAPK-dependent SERT activation, independent of PKG, would reproduce the mobility changes induced by 8-Br-cGMP. We have shown that the inflammatory cytokine IL-1β acts via plasma membrane IL-1 receptors (Zhu et al., 2006) to produce a p38 MAPK-dependent catalytic activation of SERT proteins in RN46A cells, as well as in brain synaptosomes. As shown in Figure 6F, IL-1β treatment (100 ng/ml; 30 min; 37°C) of RN46A cells produces a rightward shift in the instantaneous velocities of single SERT molecules, compared with untreated cells, documenting enhanced transporter velocity. The distribution of velocities is well fit to a model comprised of two populations: one aligned with the low mobility distribution that was observed under untreated conditions and a second aligned with the distribution previously described following 8-Br-cGMP stimulation. We also found that treatment with IL-1β, like 8-Br-cGMP, caused an increase in the fraction of SERT molecules exhibiting accelerated velocity (Fig. 6F) with high diffusion coefficients (Fig. 6G). As with 8-Br-cGMP treatment, the 2D displacements of single SERT molecules did not differ from that observed in untreated cells (Fig. 6E), and SERT remained localized to CTxB-labeled membrane microdomains. These results provide strong support that both 8-Br-cGMP and IL-1β-induced stimulation of SERT activity arises via a p38 MAPK-dependent mobilization of transporter proteins that remain confined to membrane microdomains.
Cytoskeletal disruption mobilizes SERT molecules that remain confined to membrane microdomains
A possible mechanism responsible for confined diffusion of SERT proteins in membrane microdomains, and one that could be a target for p38 MAPK regulation associated with transporter activation, is the liberation of transporters from juxtamembrane cytoskeletal networks that could confine movements of raft-localized transporters (Steiner et al., 2008). To determine whether SERT lateral mobility within these domains is restricted by cytoskeletal interactions, we treated cells with the actin filament disrupter cytochalasin D (CytoD) (0.5 μg/ ml; 30 min; 37°C) a dose that does not produce gross changes in cell morphology. Like 8-Br-cGMP and IL-1β treatments, this treatment produced a bimodal distribution of diffusion rates for single Qdot-labeled SERT molecules (Fig. 7), with an increased representation of the more mobile population. CytoD treatment produces an increase in diffusion rates for both subpopulations, compared with 8-Br-cGMP and IL-1β treatments (fitted Gaussian center D value: relative immobile population increases from (1.32 ± 0.04) × 10−3 to (1.05 ± 0.03) × 10−2μm2/s; relative mobile population increases from (2.63 ± 0.04)×10−2 to (6.92 ± 0.01)×10−2μm2/s), consistent with a contribution of cytoskeletal interactions also constraining SERT lateral mobility to some degree outside of lipid rafts. Compared with untreated cells, the instantaneous velocity of single Qdot-labeled SERT proteins from CytoD-treated cells was significantly elevated (Fig. 8A), with 93% of the transporters fit to a higher velocity component (1.51 ± 0.06 μm/s vs 0.75 ± 0.06 μm/s for untreated cells). We found very similar results in monitoring the instantaneous movements of membrane rafts using single Qdot-labeled GM1/CTxB complexes following the same CytoD treatment (Fig. 8B). However, CytoD treatment did not disperse CTxB labeling as seen with MβCD treatment, consistent with an actin-independent contribution to microdomain integrity. Importantly, SERT proteins remained colocalized with CTxB/GM1 (Fig. 7B). When IL-1β (100 ng/ml; 30 min; 37°C) was added to cells pretreated with CytoD, no further increase in SERT velocity was achieved (Fig. 8C). We do not believe that this is a ceiling effect on velocity as MβCD treatment increase rates beyond this level (higher velocity component: 1.82 ± 0.06 μm/s, Fig. 5A, +8-Br-cGMP data fit with double Gaussian). Together, these data support the hypothesis that IL-1β activation of SERT arises as a result of the release of transporters from cytoskeleton-associated anchors, though the transporters remained trapped within membrane microdomains.
Figure 7.
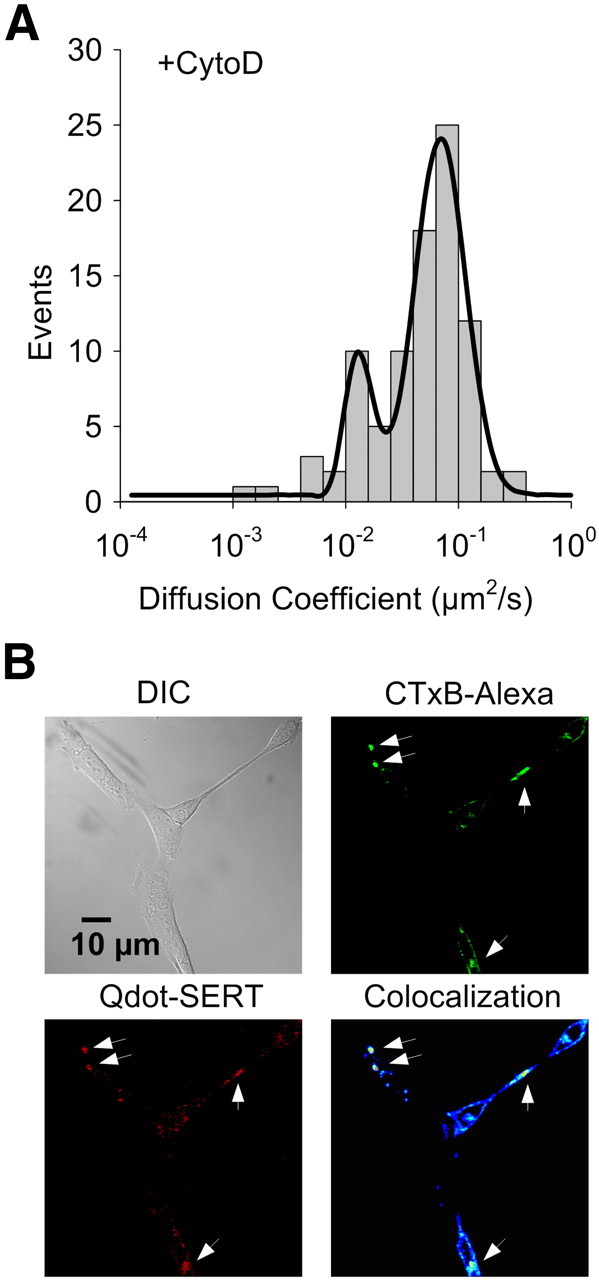
A, Increased lateral diffusion of Qdot labeled SERT proteins after CytoD treatment. Data fit with double Gaussian distributions. B, Retention of SERT proteins within membrane rafts in CytoD-pretreated RN46A cells. Upper left: DIC image; Upper right: staining of membrane rafts using Alexa 488-conjugated CTxB; Lower left: Qdot-SERT proteins; Lower right: colocalization of CTxB and Qdot labeling. Arrowheads denote the presence of multiple puncta labeled for both markers.
Figure 8.

Actin cytoskeleton restricts SERT mobility within membrane microdomains in a p38 MAPK and SERT C terminus-dependent manner. Plots of instantaneous velocity of A, single Qdot-labeled SERT proteins in RN46A cells treated with CytoD, B, single Qdot-labeled GM1/CTxB complexes in RN46A cells treated with CytoD, C, single Qdot-labeled SERT proteins in RN46A cells treated with CytoD after IL-1β stimulation, and D, single Qdot-labeled SERT proteins in RN46A cells treated with C-SERT peptide. Each condition represents results of three independent experiments.
SERT is known to associate through N and C-terminal cytoplasmic domains with multiple integral membrane and cytosolic proteins, several of which have been suggested to coordinate SERT regulation via cytoskeletal interactions (Chanrion et al., 2007; Steiner et al., 2008). In this regard, the SERT C terminus has been shown not only to complex with integrins and integrin-associated proteins that interact dynamically with the cytoskeleton (Carneiro and Blakely, 2006; Carneiro et al., 2008) but also to interact with the PKG-linked signaling molecule nitric oxide synthetase (NOS) (Chanrion et al., 2007). To determine whether SERT C-terminal protein interactions could account for microdomain-restricted mobility of transporters, we incubated RN46A cells with membrane permeate TAT-C-terminal SERT peptides (C-SERT peptide) before single Qdot-SERT tracking. As seen with IL-1β treatment, C-SERT peptide treatment generated a shift of the distribution to more rapid transporter diffusion rates (Fig. 9A). In contrast to the untreated RN46A cells (Fig. 4B), TAT-conjugated SERT peptide derived from sequences upstream of those of the C-terminal SERT peptide (interior or U-SERT peptide) produced a similar SERT diffusion rate distribution (Fig. 9B) to that of untreated cells (Fig. 4B). Importantly, and as with IL-1β treatment, the C-SERT peptide produced an increase in SERT transport activity (Fig. 9C).
Figure 9.

A, B, Distribution of diffusion coefficient of single SERT proteins after C-SERT (A) and U-SERT (B) peptide treatments and fit with double Gaussian distributions. Data collected from five independent experiments. C, SERT activity in RN46A cells after U-SERT peptide treatment. SERT activity was monitored using the fluorescent monoamine transporter substrate IDT307 (see Materials and Methods, Cell culture, treatments, and SERT activity assay). Data shown are representative of time-lapse microphotographs (right) and fluorescent quantification (p < 0.01, Student's t test; left) obtained in three independent experiments.
Discussion
Here we provide evidence that single Qdot-labeled, plasma membrane-embedded SERT proteins distribute between freely mobile pools and relatively immobile, cholesterol-rich microdomains where restricted mobility is derived from C-terminal interactions with the actin cytoskeleton. Our findings, which to our knowledge are the first to describe the mobility of single transporter proteins, were achieved by fusing the single molecule detection capacity of Qdots to the specificity and high affinity of a pharmacological probe. The linker between the SERT antagonist and the SAv-Qdots was developed to provide both access of the ligand to its high-affinity binding site that lies midway through the plasma membrane (Kaufmann et al., 2009) and to enhance linker solubility. Although multiple biotin binding sites are theoretically available on the SAv-Qdots, the surface density of SERT proteins is very low on RN46A cells (Zhu et al., 2006), and we used subsaturating concentrations of ligand as well as low concentrations of Qdots to minimize multivalent labeling (Bannai et al., 2006). Importantly, our antagonist-conjugated SAv-Qdots do not limit our ability to detect free diffusion kinetics of a subpopulation of SERT molecules nor to detect regulation of SERT through cGMP and p38 MAPK-linked pathways. Previously, we achieved population detection of SERT (Rosenthal et al., 2002; Chang et al., 2011), GABA receptor (Gussin et al., 2006), and dopamine transporter (DAT) (Kovtun et al., 2011) proteins using ligand-conjugated Qdots. With respect to the prior SERT study, these efforts involved direct conjugation of 5-HT to Qdots, before the application of this complex to cells. In subsequent studies, we found this approach to be of insufficient sensitivity and reliability for the detection of transporters on natively expressing cells, due to the lower affinity of 5-HT, the higher nonspecific binding of the Qdot conjugate, and the stability of the Qdot complexes after binding. Nonetheless, our success in these efforts provided critical evidence that a modification of this approach could be generalized and enhanced to achieve detection of SERT diffusion dynamics. Many more small molecule ligands, including therapeutic compounds, are available that target membrane proteins rather than surface-epitope antibodies, and thus the methods presented here appear well suited to the detection of other receptors, ion channels and transporters targeted by widely available pharmacological tools and medications.
In our report, we establish that SERT instantaneous velocity is significantly enhanced by both chemical depletion of membrane cholesterol and activation of p38 MAPK-dependent signaling pathways, two manipulations that exert opposite influences on SERT activity. In resolving this puzzle, we discovered a previously unsuspected correlation of SERT activation involving the mobilization of transporters from juxtamembrane tethers within cholesterol-rich microdomains. Importantly, mobilized transporters do not leave these membrane microdomains, providing a mechanism for reversibility of associations that can both increase and decrease surface-resident SERT proteins. Membrane cholesterol has been reported to have a varied effect on the diffusion of surface proteins (Scanlon et al., 2001; Wang et al., 2008). Cholesterol extraction using MβCD increases the diffusion coefficient of dopamine transporter populations assessed by fluorescence recovery after photobleaching (FRAP) (Adkins et al., 2007). In contrast, extraction of membrane cholesterol results in plasma membrane changes that reduce diffusion of MHC II proteins (Nishimura et al., 2006). The degree to which SERT protein function in vivo depends on membrane cholesterol is unknown, though one advantage to our in vitro studies is the use of a serotonergic neuronal model that expressed endogenous SERT proteins, limiting potential artifacts due to heterologous expression. Human clinical studies report inconsistent findings on the impact of reduced cholesterol and/or cholesterol-lowering therapy risk for mood disorders or their treatments (Vevera et al., 2005; Lalovic et al., 2007). Interestingly, a recent study in rats demonstrated that lovastatin treatment enhances the ability of the SERT-directed antidepressant fluoxetine to reverse despair behavior (Renshaw et al., 2009), findings that should be investigated to determine whether they reflect, at least in part, alterations in SERT membrane dynamics. Additionally, antidepressant drugs have been reported to concentrate in membrane microdomains (Eisensamer et al., 2005) and whether this partitioning might influence SERT membrane dynamics as well as block re-uptake should be explored. Finally, we have shown recently that A3 adenosine receptors physically associate with SERT and regulate SERT catalytic function in RN46A cells via p38 MAPK (Zhu et al., 2011). Our results are most consistent with this regulation being highly localized and provide an explanation for how signaling pathways that act on many other targets within the cell can be limited to specific targets, in this case toward SERT.
What molecular mechanisms support the single molecule findings associated with p38 MAPK-dependent SERT regulation? SERT is known to reside in macromolecular complexes whose composition changes as a function of regulatory stimuli (Steiner et al., 2008; Zhu et al., 2011). The association of several proteins with SERT can be altered by stimuli that influence SERT activity, including syntaxin 1A and the focal adhesion interactor Hic-5 (Quick, 2003; Carneiro and Blakely, 2006). Hic-5 is a focal adhesion-associated protein known to associate with both the SERT C terminus and the actin-rich, membrane cytoskeleton. We have shown that Hic-5 addition to resealed membrane vesicles in vitro reduces SERT activity (Carneiro and Blakely, 2006). Furthermore, SERT/Hic-5 associations are enhanced by stimuli, such as PKC activation, that lead to initial SERT catalytic inactivation and subsequent internalization (Carneiro and Blakely, 2006; Steiner et al., 2008). Therefore, we hypothesize that the orchestrated dissociation from the SERT C terminus of cytoskeletal-associated proteins, such as Hic-5, places the transporter in a more active conformation, and that such dissociation accounts for both the increase in SERT mobility we observed and the increase in SERT activity found upon manipulation of SERT cytoskeletal interactions (Fig. 10). In support of this idea, Hong and Amara have recently provided evidence that cholesterol-rich microdomains favor an outward facing conformation of DAT (Hong and Amara, 2010) and we have previously shown that activation of p38 MAPK enhances the affinity of the transporter for 5-HT (Zhu et al., 2005).
Figure 10.

Model for SERT-cytoskeletal interactions dictating cell surface transporter regulation. In the resting state, SERT is present in two compartments, one that permits free diffusion in the membrane (left), and a second compartment that represents confinement to membrane microdomains (center) where transporters are immobilized by cytoskeleton-associated proteins (middle). When cytoskeleton-associated constraints are relaxed in response to PKG/IL-1β/p38 MAPK activation (or through actin destabilizers or C-SERT peptide treatments), SERT remains confined to membrane microdomains (right), though now transporters can adopt conformations that favor increased transport activity. Question mark overlying transitions into and out of membrane microdomains denotes the possibility that such movements could also play a role in SERT regulation, though they are not features of the PKG and p38 MAPK-dependent SERT regulation detected in the current study.
To conclude, we show here that the diffusion rate distribution of single Qdot labeled SERT proteins under control, 8-Br-cGMP, and IL-1β-treated conditions exhibit a bimodal distribution, with populations exhibiting higher rates of mobility increased after 8-Br-cGMP (Fig. 5B) and IL-1β (Fig. 6G) treatments. These changes in mobility are not the same as those generated through cholesterol depletion and elimination of membrane rafts, which also reduce SERT activity. Importantly, the actin cytoskeleton and the SERT C terminus appear to play critical roles in the mobilization of SERT within these membrane microdomains. Thus, we believe that a major aspect of SERT regulation relies on a tightly controlled, and dynamic, cytoskeletal interaction (Fig. 10). The ability of Il-1β to stimulate SERT mobility places our findings in a physiological context, given that our findings that this receptor regulates SERT activity in vitro and in vivo (Zhu et al., 2006, 2010), and is consistent with prior findings that Il-1 signaling arises from raft-like membrane microdomains (Veluthakal et al., 2005). Finally, we hypothesize that OCD and autism-associated SERT mutations that are known to constitutively enhance SERT activity and to disrupt PKG and p38 MAPK-dependent regulation (Prasad et al., 2005, Sutcliffe et al., 2005) derive their pathophysiological impact from perturbed SERT cytoskeletal associations in membrane microdomains.
Footnotes
This work was supported by the National Institutes of Health (R01EB003728-02, MH096972, MH094527, and GM72048-02). J.C.C. acknowledges a research fellowship from the Vanderbilt Institute of Nanoscale Science and Engineering. We thank Dr. Sam Wells and the Vanderbilt University Cell Imaging Shared Resource for help with the single-molecule microscopy. We also thank Drs. Alessandro Esposito and Jaqaman Khuloud for technical assistance with the Matlab routines.
The authors declare no competing financial interests.
References
- Adkins EM, Barker EL, Blakely RD. Interactions of tryptamine derivatives with serotonin transporter species variants implicate transmembrane domain I in substrate recognition. Mol Pharmacol. 2001;59:514–523. doi: 10.1124/mol.59.3.514. [DOI] [PubMed] [Google Scholar]
- Adkins EM, Samuvel DJ, Fog JU, Eriksen J, Jayanthi LD, Vaegter CB, Ramamoorthy S, Gether U. Membrane mobility and microdomain association of the dopamine transporter studied with fluorescence correlation spectroscopy and fluorescence recovery after photobleaching. Biochemistry. 2007;46:10484–10497. doi: 10.1021/bi700429z. [DOI] [PubMed] [Google Scholar]
- Alivisatos P. The use of nanocrystals in biological detection. Nat Biotechnol. 2004;22:47–52. doi: 10.1038/nbt927. [DOI] [PubMed] [Google Scholar]
- Allen JA, Halverson-Tamboli RA, Rasenick MM. Lipid raft microdomains and neurotransmitter signalling. Nat Rev Neurosci. 2007;8:128–140. doi: 10.1038/nrn2059. [DOI] [PubMed] [Google Scholar]
- Balasubramanian N, Scott DW, Castle JD, Casanova JE, Schwartz MA. Arf6 and microtubules in adhesion-dependent trafficking of lipid rafts. Nat Cell Biol. 2007;9:1381–1391. doi: 10.1038/ncb1657. [DOI] [PMC free article] [PubMed] [Google Scholar]
- Bannai H, Lévi S, Schweizer C, Dahan M, Triller A. Imaging the lateral diffusion of membrane molecules with quantum dots. Nat Protoc. 2006;1:2628–2634. doi: 10.1038/nprot.2006.429. [DOI] [PubMed] [Google Scholar]
- Bonneau S, Dahan M, Cohen LD. Single quantum dot tracking based on perceptual grouping using minimal paths in a spatiotemporal volume. IEEE Trans Image Process. 2005;14:1384–1395. doi: 10.1109/tip.2005.852794. [DOI] [PubMed] [Google Scholar]
- Carneiro AM, Blakely RD. Serotonin-, protein kinase C-, and Hic-5-associated redistribution of the platelet serotonin transporter. J Biol Chem. 2006;281:24769–24780. doi: 10.1074/jbc.M603877200. [DOI] [PMC free article] [PubMed] [Google Scholar]
- Carneiro AM, Cook EH, Murphy DL, Blakely RD. Interactions between integrin αIIbβ3 and the serotonin transporter regulate serotonin transport and platelet aggregation in mice and humans. J Clin Invest. 2008;118:1544–1552. doi: 10.1172/JCI33374. [DOI] [PMC free article] [PubMed] [Google Scholar]
- Chang JC, Tomlinson ID, Warnement MR, Iwamoto H, DeFelice LJ, Blakely RD, Rosenthal SJ. A fluorescence displacement assay for antidepressant drug discovery based on ligand-conjugated quantum dots. J Am Chem Soc. 2011;133:17528–17531. doi: 10.1021/ja204301g. [DOI] [PMC free article] [PubMed] [Google Scholar]
- Chanrion B, Mannoury la Cour C, Bertaso F, Lerner-Natoli M, Freissmuth M, Millan MJ, Bockaert J, Marin P. Physical interaction between the serotonin transporter and neuronal nitric oxide synthase underlies reciprocal modulation of their activity. Proc Natl Acad Sci U S A. 2007;104:8119–8124. doi: 10.1073/pnas.0610964104. [DOI] [PMC free article] [PubMed] [Google Scholar]
- Dahan M, Lévi S, Luccardini C, Rostaing P, Riveau B, Triller A. Diffusion dynamics of glycine receptors revealed by single-quantum dot tracking. Science. 2003;302:442–445. doi: 10.1126/science.1088525. [DOI] [PubMed] [Google Scholar]
- Ehrensperger MV, Hanus C, Vannier C, Triller A, Dahan M. Multiple association states between glycine receptors and gephyrin identified by SPT analysis. Biophys J. 2007;92:3706–3718. doi: 10.1529/biophysj.106.095596. [DOI] [PMC free article] [PubMed] [Google Scholar]
- Eisensamer B, Uhr M, Meyr S, Gimpl G, Deiml T, Rammes G, Lambert JJ, Zieglgänsberger W, Holsboer F, Rupprecht R. Antidepressants and antipsychotic drugs colocalize with 5-HT3 receptors in raft-like domains. J Neurosci. 2005;25:10198–10206. doi: 10.1523/JNEUROSCI.2460-05.2005. [DOI] [PMC free article] [PubMed] [Google Scholar]
- Esposito A, Dohm CP, Kermer P, Bähr M, Wouters FS. alpha-Synuclein and its disease-related mutants interact differentially with the microtubule protein tau and associate with the actin cytoskeleton. Neurobiol Dis. 2007;26:521–531. doi: 10.1016/j.nbd.2007.01.014. [DOI] [PubMed] [Google Scholar]
- Fichter KM, Flajolet M, Greengard P, Vu TQ. Kinetics of G-protein-coupled receptor endosomal trafficking pathways revealed by single quantum dots. Proc Natl Acad Sci U S A. 2010;107:18658–18663. doi: 10.1073/pnas.1013763107. [DOI] [PMC free article] [PubMed] [Google Scholar]
- Gussin HA, Tomlinson ID, Little DM, Warnement MR, Qian H, Rosenthal SJ, Pepperberg DR. Binding of muscimol-conjugated quantum dots to GABA(c) receptors. J Am Chem Soc. 2006;128:15701–15713. doi: 10.1021/ja064324k. [DOI] [PMC free article] [PubMed] [Google Scholar]
- Hong WC, Amara SG. Membrane cholesterol modulates the outward-facing conformation of the dopamine transporter and alters cocaine binding. J Biol Chem. 2010;285:32616–32626. doi: 10.1074/jbc.M110.150565. [DOI] [PMC free article] [PubMed] [Google Scholar]
- Howarth M, Liu W, Puthenveetil S, Zheng Y, Marshall LF, Schmidt MM, Wittrup KD, Bawendi MG, Ting AY. Monovalent, reduced-size quantum dots for imaging receptors on living cells. Nat Methods. 2008;5:397–399. doi: 10.1038/nmeth.1206. [DOI] [PMC free article] [PubMed] [Google Scholar]
- Jaqaman K, Loerke D, Mettlen M, Kuwata H, Grinstein S, Schmid SL, Danuser G. Robust single-particle tracking in live-cell time-lapse sequences. Nat Methods. 2008;5:695–702. doi: 10.1038/nmeth.1237. [DOI] [PMC free article] [PubMed] [Google Scholar]
- Kaufmann KW, Dawson ES, Henry LK, Field JR, Blakely RD, Meiler J. Structural determinants of species-selective substrate recognition in human and Drosophila serotonin transporters revealed through computational docking studies. Proteins. 2009;74:630–642. doi: 10.1002/prot.22178. [DOI] [PMC free article] [PubMed] [Google Scholar]
- Kenworthy AK, Petranova N, Edidin M. High-resolution FRET microscopy of cholera toxin B-subunit and GPI-anchored proteins in cell plasma membranes. Mol Biol Cell. 2000;11:1645–1655. doi: 10.1091/mbc.11.5.1645. [DOI] [PMC free article] [PubMed] [Google Scholar]
- Klafter J, Sokolov IM. Anomalous diffusion spreads its wings. Phys World. 2005;18:29–32. [Google Scholar]
- Kovtun O, Tomlinson ID, Sakrikar DS, Chang JC, Blakely RD, Rosenthal SJ. Visualization of the cocaine-sensitive dopamine transporter with ligand-conjugated quantum dots. ACS Chem Neurosci. 2011;2:370–378. doi: 10.1021/cn200032r. [DOI] [PMC free article] [PubMed] [Google Scholar]
- Lalovic A, Levy E, Luheshi G, Canetti L, Grenier E, Sequeira A, Turecki G. Cholesterol content in brains of suicide completers. Int J Neuropsychopharmacol. 2007;10:159–166. doi: 10.1017/S1461145706006663. [DOI] [PubMed] [Google Scholar]
- Magnani F, Tate CG, Wynne S, Williams C, Haase J. Partitioning of the serotonin transporter into lipid microdomains modulates transport of serotonin. J Biol Chem. 2004;279:38770–38778. doi: 10.1074/jbc.M400831200. [DOI] [PubMed] [Google Scholar]
- Martin DS, Forstner MB, Käs JA. Apparent subdiffusion inherent to single particle tracking. Biophys J. 2002;83:2109–2117. doi: 10.1016/S0006-3495(02)73971-4. [DOI] [PMC free article] [PubMed] [Google Scholar]
- Michalet X, Pinaud FF, Bentolila LA, Tsay JM, Doose S, Li JJ, Sundaresan G, Wu AM, Gambhir SS, Weiss S. Quantum dots for live cells, in vivo imaging, and diagnostics. Science. 2005;307:538–544. doi: 10.1126/science.1104274. [DOI] [PMC free article] [PubMed] [Google Scholar]
- Murphy DL, Fox MA, Timpano KR, Moya PR, Ren-Patterson R, Andrews AM, Holmes A, Lesch KP, Wendland JR. How the serotonin story is being rewritten by new gene-based discoveries principally related to SLC6A4, the serotonin transporter gene, which functions to influence all cellular serotonin systems. Neuropharmacology. 2008;55:932–960. doi: 10.1016/j.neuropharm.2008.08.034. [DOI] [PMC free article] [PubMed] [Google Scholar]
- Nirmal M, Dabbousi BO, Bawendi MG, Macklin JJ, Trautman JK, Harris TD, Brus LE. Fluorescence intermittency in single cadmium selenide nanocrystals. Nature. 1996;383:802–804. [Google Scholar]
- Nishimura SY, Vrljic M, Klein LO, McConnell HM, Moerner WE. Cholesterol depletion induces solid-like regions in the plasma membrane. Biophys J. 2006;90:927–938. doi: 10.1529/biophysj.105.070524. [DOI] [PMC free article] [PubMed] [Google Scholar]
- Orlandi PA, Fishman PH. Filipin-dependent inhibition of cholera toxin: evidence for toxin internalization and activation through caveolae-like domains. J Cell Biol. 1998;141:905–915. doi: 10.1083/jcb.141.4.905. [DOI] [PMC free article] [PubMed] [Google Scholar]
- Ozaki N, Goldman D, Kaye WH, Plotnicov K, Greenberg BD, Lappalainen J, Rudnick G, Murphy DL. Serotonin transporter missense mutation associated with a complex neuropsychiatric phenotype. Mol Psychiatry. 2003;8:933–936. doi: 10.1038/sj.mp.4001365. [DOI] [PubMed] [Google Scholar]
- Prasad HC, Zhu CB, McCauley JL, Samuvel DJ, Ramamoorthy S, Shelton RC, Hewlett WA, Sutcliffe JS, Blakely RD. Human serotonin transporter variants display altered sensitivity to protein kinase G and p38 mitogen-activated protein kinase. Proc Natl Acad Sci U S A. 2005;102:11545–11550. doi: 10.1073/pnas.0501432102. [DOI] [PMC free article] [PubMed] [Google Scholar]
- Prasad HC, Steiner JA, Sutcliffe JS, Blakely RD. Enhanced activity of human serotonin transporter variants associated with autism. Philos Trans R Soc Lond B. 2009;364:163–173. doi: 10.1098/rstb.2008.0143. [DOI] [PMC free article] [PubMed] [Google Scholar]
- Quick MW. Regulating the conducting states of a mammalian serotonin transporter. Neuron. 2003;40:537–549. doi: 10.1016/s0896-6273(03)00605-6. [DOI] [PubMed] [Google Scholar]
- Ramamoorthy S, Blakely RD. Phosphorylation and sequestration of serotonin transporters differentially modulated by psychostimulants. Science. 1999;285:763–766. doi: 10.1126/science.285.5428.763. [DOI] [PubMed] [Google Scholar]
- Ramamoorthy S, Shippenberg TS, Jayanthi LD. Regulation of monoamine transporters: Role of transporter phosphorylation. Pharmacol Ther. 2011;129:220–238. doi: 10.1016/j.pharmthera.2010.09.009. [DOI] [PMC free article] [PubMed] [Google Scholar]
- Renshaw PF, Parsegian A, Yang CK, Novero A, Yoon SJ, Lyoo IK, Cohen BM, Carlezon WA., Jr Lovastatin potentiates the antidepressant efficacy of fluoxetine in rats. Pharmacol Biochem Behav. 2009;92:88–92. doi: 10.1016/j.pbb.2008.10.017. [DOI] [PMC free article] [PubMed] [Google Scholar]
- Rosenthal SJ, Tomlinson I, Adkins EM, Schroeter S, Adams S, Swafford L, McBride J, Wang Y, DeFelice LJ, Blakely RD. Targeting cell surface receptors with ligand-conjugated nanocrystals. J Am Chem Soc. 2002;124:4586–4594. doi: 10.1021/ja003486s. [DOI] [PubMed] [Google Scholar]
- Saxton MJ. A biological interpretation of transient anomalous subdiffusion. I. Qualitative model. Biophys J. 2007;92:1178–1191. doi: 10.1529/biophysj.106.092619. [DOI] [PMC free article] [PubMed] [Google Scholar]
- Scanlon SM, Williams DC, Schloss P. Membrane cholesterol modulates serotonin transporter activity. Biochemistry. 2001;40:10507–10513. doi: 10.1021/bi010730z. [DOI] [PubMed] [Google Scholar]
- Schütz GJ, Kada G, Pastushenko VP, Schindler H. Properties of lipid microdomains in a muscle cell membrane visualized by single molecule microscopy. EMBO J. 2000;19:892–901. doi: 10.1093/emboj/19.5.892. [DOI] [PMC free article] [PubMed] [Google Scholar]
- Simons K, Gerl MJ. Revitalizing membrane rafts: new tools and insights. Nat Rev Mol Cell Biol. 2010;11:688–699. doi: 10.1038/nrm2977. [DOI] [PubMed] [Google Scholar]
- Steiner JA, Carneiro AM, Blakely RD. Going with the flow: trafficking-dependent and -independent regulation of serotonin transport. Traffic. 2008;9:1393–1402. doi: 10.1111/j.1600-0854.2008.00757.x. [DOI] [PMC free article] [PubMed] [Google Scholar]
- Steiner JA, Carneiro AM, Wright J, Matthies HJ, Prasad HC, Nicki CK, Dostmann WR, Buchanan CC, Corbin JD, Francis SH, Blakely RD. cGMP-dependent protein kinase Iα associates with the antidepressant-sensitive serotonin transporter and dictates rapid modulation of serotonin uptake. Mol Brain. 2009;2:26. doi: 10.1186/1756-6606-2-26. [DOI] [PMC free article] [PubMed] [Google Scholar]
- Sutcliffe JS, Delahanty RJ, Prasad HC, McCauley JL, Han Q, Jiang L, Li C, Folstein SE, Blakely RD. Allelic heterogeneity at the serotonin transporter locus (SLC6A4) confers susceptibility to autism and rigid-compulsive behaviors. Am J Hum Genet. 2005;77:265–279. doi: 10.1086/432648. [DOI] [PMC free article] [PubMed] [Google Scholar]
- Veenstra-VanderWeele J, Muller CL, Iwamoto H, Sauer JE, Owens WA, Shah CR, Cohen J, Mannangatti P, Jessen T, Thompson BJ, Ye R, Kerr TM, Carneiro AM, Crawley JN, Sanders-Bush E, McMahon DG, Ramamoorthy S, Daws LC, Sutcliffe JS, Blakely RD. Autism gene variant causes hyperserotonemia, serotonin receptor hypersensitivity, social impairment and repetitive behavior. Proc Natl Acad Sci U S A. 2012;109:5469–5474. doi: 10.1073/pnas.1112345109. [DOI] [PMC free article] [PubMed] [Google Scholar]
- Veluthakal R, Chvyrkova I, Tannous M, McDonald P, Amin R, Hadden T, Thurmond DC, Quon MJ, Kowluru A. Essential role for membrane lipid rafts in interleukin-1beta-induced nitric oxide release from insulin-secreting cells: potential regulation by caveolin-1+ Diabetes. 2005;54:2576–2585. doi: 10.2337/diabetes.54.9.2576. [DOI] [PubMed] [Google Scholar]
- Vevera J, Fisar Z, Kvasnicka T, Zdenek H, Stárková L, Ceska R, Papezová H. Cholesterol-lowering therapy evokes time-limited changes in serotonergic transmission. Psychiatry Res. 2005;133:197–203. doi: 10.1016/j.psychres.2004.11.005. [DOI] [PubMed] [Google Scholar]
- Vrljic M, Nishimura SY, Moerner WE. Single-molecule tracking. Methods Mol Biol. 2007;398:193–219. doi: 10.1007/978-1-59745-513-8_14. [DOI] [PubMed] [Google Scholar]
- Wang Q, Zhang X, Zhang L, He F, Zhang G, Jamrich M, Wensel TG. Activation-dependent hindrance of photoreceptor G protein diffusion by lipid microdomains. J Biol Chem. 2008;283:30015–30024. doi: 10.1074/jbc.M803953200. [DOI] [PMC free article] [PubMed] [Google Scholar]
- White LA, Eaton MJ, Castro MC, Klose KJ, Globus MY, Shaw G, Whittemore SR. Distinct regulatory pathways control neurofilament expression and neurotransmitter synthesis in immortalized serotonergic neurons. J Neurosci. 1994;14:6744–6753. doi: 10.1523/JNEUROSCI.14-11-06744.1994. [DOI] [PMC free article] [PubMed] [Google Scholar]
- Zhu CB, Hewlett WA, Feoktistov I, Biaggioni I, Blakely RD. Adenosine receptor, protein kinase G, and p38 mitogen-activated protein kinase-dependent up-regulation of serotonin transporters involves both transporter trafficking and activation. Mol Pharmacol. 2004;65:1462–1474. doi: 10.1124/mol.65.6.1462. [DOI] [PubMed] [Google Scholar]
- Zhu CB, Carneiro AM, Dostmann WR, Hewlett WA, Blakely RD. p38 MAPK activation elevates serotonin transport activity via a trafficking-independent, protein phosphatase 2A-dependent process. J Biol Chem. 2005;280:15649–15658. doi: 10.1074/jbc.M410858200. [DOI] [PubMed] [Google Scholar]
- Zhu CB, Blakely RD, Hewlett WA. The proinflammatory cytokines interleukin-1beta and tumor necrosis factor-alpha activate serotonin transporters. Neuropsychopharmacology. 2006;31:2121–2131. doi: 10.1038/sj.npp.1301029. [DOI] [PubMed] [Google Scholar]
- Zhu CB, Lindler KM, Owens AW, Daws LC, Blakely RD, Hewlett WA. Interleukin-1 receptor activation by systemic lipopolysaccharide induces behavioral despair linked to MAPK regulation of CNS serotonin transporters. Neuropsychopharmacology. 2010;35:2510–2520. doi: 10.1038/npp.2010.116. [DOI] [PMC free article] [PubMed] [Google Scholar]
- Zhu CB, Lindler KM, Campbell NG, Sutcliffe JS, Hewlett WA, Blakely RD. Colocalization and regulated physical association of presynaptic serotonin transporters with a3 adenosine receptors. Mol Pharmacol. 2011;80:458–465. doi: 10.1124/mol.111.071399. [DOI] [PMC free article] [PubMed] [Google Scholar]
- Zumofen G, Klafter J. Spectral random walk of a single molecule. Chem Phys Lett. 1994;219:303–309. [Google Scholar]