

Abstract
Background
The association between body mass index (BMI) and mortality in patients suffering from chronic obstructive pulmonary disease (COPD) has been a subject of interest for decades. However, the evidence is inadequate to draw robust conclusions because some studies were generally small or with a short follow-up.
Methods
We carried out a search in MEDLINE, Cochrane Central Register of Controlled Trials, and EMBASE database for relevant studies. Relative risks (RRs) with 95% confidence interval (CI) were calculated to assess the association between BMI and mortality in patients with COPD. In addition, a baseline risk-adjusted analysis was performed to investigate the strength of this association.
Results
22 studies comprising 21,150 participants were included in this analysis. Compared with patients having a normal BMI, underweight individuals were associated with higher mortality (RR = 1.34, 95% CI = 1.01–1.78), whereas overweight (RR = 0.47, 95% CI = 0.33–0.68) and obese (RR = 0.59, 95% CI = 0.38–0.91) patients were associated with lower mortality. We further performed a baseline risk-adjusted analysis and obtained statistically similar results.
Conclusion
Our study showed that for patients with COPD being overweight or obese had a protective effect against mortality. However, the relationship between BMI and mortality in different classes of obesity needed further clarification in well-designed clinical studies.
Introduction
Chronic obstructive pulmonary disease (COPD), a common disease with a high burden on healthcare resources, is predicted to be the third leading cause of death worldwide by the year 2020 [1]. Apart from its effects in the lungs, COPD has been redefined as a systemic disease in recent years due to its significant extrapulmonary manifestations [2]. Although the hallmark feature of COPD is airflow obstruction, it was poorly predicted by Forced Expiratory Volume in the first second (FEV1) only [3], [4]. Thus, many other independent predictors of outcomes have been identified including frequency of acute exacerbations and hospital admissions [5], exercise capacity [3], nutritional status [6], depressive symptoms [7], and biomarkers of systemic and bronchial inflammation [8]. Among these, the most extensively studied and conveniently used predictor is the alterations of the Body Mass Index (BMI).
BMI is the weight in kilograms divided by the square of the height in meters. The association between BMI and mortality in patients suffering from COPD has been a subject of interest for decades. Even though weight loss commonly occurs among these patients, it is not clear whether this is an epiphenomenon of severity of the disease or an independent risk factor [9]. Studies with small sample size or a short follow-up appeared to lack sufficient power to detect such an association. In addition, data from some studies were insufficient to adjust the influence of age, gender, smoking, and lung function. To comprehensively synthesize the evidence relating to this issue, we conducted this systematic review to examine if the BMI in patients with COPD is a significant predictor of mortality after being adjusted for other prognostic factors.
Materials and Methods
Identification and eligibility of relevant studies
We carried out a search in MEDLINE, Cochrane Central Register of Controlled Trials (CENTRAL), and EMBASE databases covering all papers published till March 2011, using the following search terms: body mass index, chronic obstructive pulmonary disease, and cohort studies, as well as combinations of these terms. We retrieved all eligible studies, checked their bibliographies for other relevant publications, and examined the abstracts of relevant scientific meetings to ensure complete review of available studies. We also made efforts to contact the author when relevant data were unclear.
Study selection
Individual studies had to meet the following criteria to be included: (1) study population originating from a well-established general cohort; (2) diagnosis of COPD according to pulmonary function test; (3) mortality reported in COPD patients according to BMI category; (4) published in English; (5) the availability of data for analysis; and (6) BMI categorized into four groups according to World Health Organization (WHO) guidelines (http://apps.who.int/bmi/index.jsp?introPage=intro_3.html): (a) underweight (≤18.5 kg/m2), (b) normal weight (18.5–24.9 kg/m2), (c) overweight (25.0–29.9 kg/m2), and (d) obese (≥30.0 kg/m2) [10]. We anticipated all the included studies to be according to WHO BMI classification guidelines. However, the cutoff point for underweight patients was controversial, and 20 kg/m2 or 21 kg/m2 was also accepted. Major exclusion criteria of studies were if (1) the BMI classification was not according to WHO guidelines or (2) the participant was without COPD at baseline. The study quality was assessed using the 9-star Newcastle-Ottawa Scale [11].
Data extraction
Two investigators (C. C. and W. R.) identified articles eligible for further review by performing an initial screening of identified title and abstract. We used broad inclusion criteria for studies during this step, which could be included by either of the two investigators. Further screening was based on full-text review. The results of two reviewers were compared, and disagreements were resolved by discussion and consensus. The first author's surname and the year of publication of the article were used for the identification purpose. We extracted data from studies concerning study design, baseline patient characteristics, categories of BMI, follow-up, sample size, and number of events. We also extracted the hazard ratios (HRs) of time-to-event data, as suggested by Parmar and colleagues, directly from the original study, or by reading off survival curves to estimate the log HR and its variance [12]. When studies reported mortality at several time intervals, we selected the longest follow-up period for analysis.
Statistical Analysis
We extracted dichotomous data form all studies reporting number of patients with events and total participants and pooled them to calculate relative risks (risk ratios, RRs) with 95% confidence interval (CI). We further performed a baseline risk-adjusted analysis of survival data to determine if the main results were robust when quantitative pooling was limited to those studies in which we could calculate pooled adjusted all-cause mortality HR. We used the statistic of I2 to efficiently test for the heterogeneity, with I2<25%, 25–75% and >75% to represent low, moderate and high degree of inconsistency, respectively [13]. Statistical heterogeneity was defined as an I2 statistic value of more than 50% [13]. In analyses, if the heterogeneity was low then we used a fixed-effect model, or else applied the random-effect model [14]. Furthermore, we examined the variables concerning age, lung function, study population (hospital-based or community-based), and length of follow-up in a meta-regression model to explore for possible heterogeneity. We performed a sensitivity analysis, in which a study was removed at a time while the rest was analyzed, to evaluate whether the results could have markedly been affected by that single study [14]. We used Egger's linear regression test to find a potential publication bias [15]. All analyses were performed with Review Manager (version 5.1, The Cochrane Collaboration, Oxford, UK) and Stata (Version10.0, Stata Corporation, College Station, TX, USA). A 2-tailed P value of less than 0.05 was judged as statistically significant.
Results
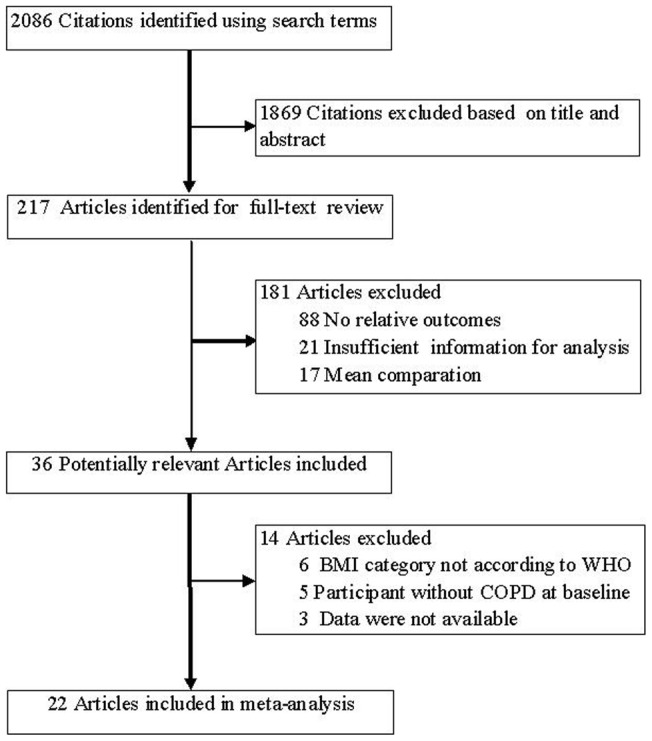
The electronic database search identified 2086 citations. Of these, the first screening excluded 1869 citations based on abstracts or titles, leaving 217 articles for full-text review. The excluded 181 studies had no relative outcomes, insufficient information, and means or standard deviations comparison for BMI. On more detailed review, an additional 14 papers were excluded for the following reasons: BMI classification was not according to WHO [16]–[21]; participant was without COPD at baseline [22]–[26]; or data was unavailable [27]–[29]. We finally included 22 studies in our systematic review and meta-analysis [30]–[51]. The detailed steps of our literature search are shown in Figure 1.
Figure 1. Flow Diagram of the Literature Search and Trial Selection Process.
The characteristics of 22 included studies are summarized in Table 1. A total of 21,150 participants with COPD were included in these studies. The selected studies were published between 1997 and 2010. Median duration of follow-up ranged from 1 to 17 years, with 11 of the 22 studies had more than 5 years of follow-up. All studies reported the mortality in COPD patients according to BMI category. 10 studies were community based [31], [33], [36], [38], [41]–[43], [48]–[50]. Adjusted data were available for 16 studies [31], [33], [34], [38]–[51], either as reported or by reading off survival curves. Risk measures concerning age, gender, FEV1%pred, and smoking were frequently adjusted. Analyses were also adjusted for other risk factors in some studies, such as outdoor activity, inhalation, PaO2, PaCO2, cor pulmonale, and COPD-related hospitalization. One study reported HRs of mortality in man and woman separately [38], and each group was considered as a separate study in analyses.
Table 1. Characteristics of Studies Included in the Meta-analysis.
| Source | No. of Participants | Study Design | FEV1,%, Predicted, Mean (SD), [Range] | Age at Follow-up, Mean(SD)[Range], y | BMI categories reported (kg/m2) | Study Quality* | Follow-up, y |
| Chang et al,30 2007 | 84 | Retrospective review | 36 [14–83] | 69.5 (12) | Underweight <20, normal 20–25, overweight 26–30, obese >30 | 6 | 1 |
| Ringbaek et al,31 2004 | 221 | Prospective cohort | 29.8 (10.7) | NA | Underweight <20, normal 20–24.9, overweight ≥25 | 7 | 4.9 |
| Esteban et al,32 2010 | 543 | Prospective longitudinal | 55.0±13.3 | 68.3±8.3 | Underweight ≤21, normal/overweight >21 | 6 | 3 |
| Seersholm,33 1997 | 342 | Prospective cohort | 52.1 (29.5) | 45.5 (10.7) | Underweight <20, normal/overweight ≥20 | 7 | 7.6 |
| Marti et al,34 2006 | 128 | Retrospective review | 25.4 (8.8) | 68.9 (9.7) | Underweight <20, normal 20–24.9, overweight 25–29.9, obese ≥30 | 7 | 3 |
| Pothirat et al,35 2007 | 195 | Prospective cohort | 41.97 (15.45) | 67.7 (7.8 ) [48–86] | Underweight<18.5, normal 18.5–25, overweight 25–30, obese ≥30 | 6 | 3.8 |
| Gunen et al,36 2005 | 205 | Prospective cohort | 62.7 (21.2) | 64.8 (9.3) | Underweight <20, normal 20–24.9, overweight ≥25 | 7 | 3 |
| Collins et al,37 2010 | 424 | Retrospective review | NA | NA | Underweight <20, normal 20–24.9, overweight 25–29.9, obese ≥30 | NA | 1 |
| Landbo et al,38 1999 | 2132 | Prospective | Man: 64.7 (18.1) Woman: 66.1 (16.6) | Man:57.7 (11.0) Woman:55.0 (10.8) | Underweight <20, normal 20–24.9, overweight 25–29.9, obese ≥30 | 8 | 17 |
| Budweiser et al,39 2007 | 188 | Prospective cohort | 31.0±9.6 | 64.5 (8.0) | Underweight/low-normal <25, overweight ≥25 | 7 | 5 |
| Hallin et al,40 2007 | 261 | Prospective cohort | NA | NA | Underweight <20, normal 20–25, overweight 25–30, obese >30 | 6 | 2 |
| Chailleux et al,41 2003 | 4088 | Prospective cohort | Man: 68 (9) Woman:70 (10) | Man: 31 (12) Woman: 34 (11) | Underweight <20, normal 20–24, overweight 25–29, obese ≥30 | 8 | 5 |
| Hansen et al,42 2001 | 1095 | Retrospective cohort | NA | 61.8 (9.9) | Underweight <20, normal 20–24.9, overweight 25–30, obese ≥30 | 6 | 8.9 |
| Jordan et al,43 2010 | 2439 | Retrospective cohort | NA | 64.28 | Underweight<18.5, normal 18.5–24.9, overweight 25–29.9, obese ≥30 | 6 | 10 |
| Machado et al,44 2006 | 435 | Prospective cohort | 31.4 (8.0) | 66.6 (7.6) | Underweight <18.5, normal 18.5–24.9, overweight 25–29.9, obese ≥30 | 7 | 7 |
| Almagro et al,45 2009 | 316 | Prospective cohort | NA | 72.1 (9.6) | Underweight <20, normal 20–25, overweight 25–30, obese >30 | 7 | 3 |
| Haruna et al,46 2010 | 251 | Prospective cohort | 50.3 (17.0) [10.0–95.1] | 68.7 (7.0) [47–88] | Underweight <18.8, normal/overweight ≥18.8 | 7 | 8 |
| Ringbaek et al,47 2005 | 869 | Prospective cohort | Man: 43.3 (17.4) Woman: 45.2 (15.8) | Man: 57.7 (8.5) Woman: 55.0 (6.9) | Underweight <20, normal 20–24.9, overweight 25–29.9, obese ≥30 | 7 | 13.3 |
| Schembri et al,48 2009 | 3343 | Prospective cohort | NA | NA | Underweight <18.5, normal 18.5–24.9, overweight 25–29.9, obese ≥30 | 6 | 1.9 |
| Prescott et al,49 2002 | 1612 | Prospective cohort | Man: 66.3 (20.6) Woman: 67.3 (21.7) | Man: 56.6 (9.7) Woman: 55.8 (9.0) | Underweight <18.5, normal 18.5–24.9, overweight 25–29.9, obese ≥30 | 8 | 14 |
| Vestbo et al,50 2006 | 1898 | Epidemiologic study | NA | NA | Underweight <18.5, normal 18.5–24.9, overweight 25–29.9, obese ≥30 | 7 | 7 |
| Tsimogianni et al,51 2009 | 81 | Retrospective cohort | 47 (17) [15–87] | 68 (9) [44–87] | Underweight/normal <25, Overweight/obese ≥25 | 6 | 3 |
Abbreviation: BMI: body mass index; NA, data not available. *Study quality was judged based on the Newcastle-Ottawa Scale (range, 1–9 stars).
Dichotomous clinical outcomes are reported as RR and survival data as HR. We pooled RRs of deaths for different levels of BMI compared with a reference of normal BMI of 18.5 kg/m2 to 24.9 kg/m2. Compared with patients with normal BMI, underweight individuals were associated with a higher mortality (RR = 1.34, 95% CI = 1.01–1.78), whereas overweight (RR = 0.47, 95% CI = 0.33–0.68) and obese (RR = 0.59, 95% CI = 0.38–0.91) patients were associated with a lower mortality (Figure 2). The RR for mortality were significantly higher in underweight individuals compared with individuals with BMI >20 kg/m2 (RR = 1.65, 95% CI = 1.29–2.11; Table 2). We also found significant increased risk of mortality in patients having a BMI of 24.9 kg/m2 or less compared with BMI ≥25 kg/m2 (RR = 3.02, 95% CI = 2.02–4.52).
Figure 2. Relative risks of Mortality with Body Mass Index among Patients with Chronic Obstruct Pulmonary Disease.

Table 2. Body Mass Index and Mortality in Chronic Obstruct Pulmonary Disease.
| Unadjusted outcomes | Risk-adjusted outcomes | |||||||||||
| Body Mass Index (kg/m2) | No.a | Subjects | RR [95% CI] | P | I2,% | Pb | No.a | Subjects | HR [95% CI] | P | I2,% | Pb |
| <18.5 vs. 18.5–24.9 | 6 | 1,161 | 1.34[1.01,1.78] | 0.04 | 68 | 0.009 | 8 | 14,163 | 1.48[1.26,1.75] | <0.00001 | 66 | 0.005 |
| 25–29.9 vs. 18.5–24.9 | 3 | 510 | 0.47[0.33,0.68] | <0.0001 | 31 | 0.23 | 8 | 12,659 | 0.78[0.65,0.94] | 0.008 | 79 | <0.0001 |
| ≧30 vs. 18.5–24.9 | 3 | 439 | 0.59[0.38,0.91] | 0.02 | 0 | 0.47 | 8 | 14,365 | 0.69[0.54,0.89] | 0.004 | 76 | 0.0001 |
| <18.5 vs. ≧18.5 | 8 | 5,744 | 1.65[1.29,2.11] | <0.0001 | 83 | <0.00001 | 2 | 593 | 1.53[124,1.88] | <0.0001 | 0 | 0.74 |
| <24.9 vs. ≧25 | 5 | 1,452 | 3.02[2.02,4.52] | <0.00001 | 26 | 0.25 | 2 | 209 | 2.361.65,3.36] | <0.00001 | 0 | 0.63 |
Number of studies; b P value of Q-test for heterogeneity test.
Sixteen studies analyzed by a Cox proportional hazards regression model to adjust for baseline differences and were included in a combined risk adjusted analysis. As shown in Figure 3, the HR of mortality in underweight patients was 1.48 (95% CI = 1.26–1.75) when compared with those with a normal BMI. Compared with patients with normal BMI, overweight (HR = 0.78, 95% CI = 0.65–0.94) and obese (HR = 0.69, 95% CI = 0.54–0.89) patients were associated with lower mortality. In addition, underweight patients had higher mortality compared with those with BMI values of 20 kg/m2 or more (HR = 1.53, 95% CI = 1.24–1.88). Likewise, compared with individuals with a BMI ≥25 kg/m2, underweight and normal BMI patients were associated with higher mortality (HR = 2.36, 95% CI = 1.65–3.36). We further performed a subgroup analysis by different BMI cut-off for underweight. The heterogeneity of underweight versus normal turned out to be insignificant (P heterogeneity = 0.16, I2 = 45%) in the studies with standardized BMI cut-off. In the subgroup analysis of obese versus normal, the heterogeneity was significantly decreased in the studies without standardized BMI cut-off (P heterogeneity = 0.68, I2 = 0%).
Figure 3. Hazard ratios of Mortality with Body Mass Index among Patients with Chronic Obstruct Pulmonary Disease (HR was adjusted for age, gender, FEV1%pred, smoking and so on.

The HR of Chailleux et al. was extracted by reading off survival curves).
To explore the heterogeneity among studies of BMI and mortality, a sensitivity analysis was performed. In risk-adjusted analysis, when one study (group of man) was excluded [38], the heterogeneity of underweight versus normal turned out to be insignificant (P heterogeneity = 0.16, I2 = 35%), with an HR of 1.36 (95% CI, 1.21–1.52), whereas exclusion of any other studies did not influence the results. A study by Prescott et al. was the main origin of heterogeneity in the comparison of obese versus normal [49]. After exclusion of this study, the heterogeneity was significantly decreased (P heterogeneity = 0.91, I2 = 0%; HR = 0.64, 95% CI = 0.58–0.71). However, pooled HR of mortality in comparison of overweight versus normal was not excessively influenced by any single study. As to unadjusted data analysis, similar procedures on sensitivity analysis were performed. After exclusion of one study [37] about the comparison between underweight and normal, the heterogeneity was significantly decreased (P heterogeneity = 0.30, I2 = 18%; RR = 1.21, 95% CI = 1.04–1.40). The pooled result was not affected by any single study in comparison of underweight versus BMI values of 18.5 kg/m2 or more. We further performed meta-regression to identify the sources of heterogeneity. We evaluated the source of heterogeneity by age, lung function, study population, and length of follow-up. We found that study population were a significant source of heterogeneity in the comparison of underweight versus BMI values of 18.5 kg/m2 or more (tau2 = 0.0132, P = 0.001). However, meta-regression did not indicate age, lung function, study population, or length of follow-up could explain the significance between-study heterogeneity in the comparison of underweight versus normal.
Publication bias
We used Egger's regression asymmetry test to access the publication bias of literatures. The results showed no evidence of publication bias (t = 0.44, P = 0.684 for underweight versus normal; t = −6.76, P = 0.094 for overweight versus normal; and t = −0.87, P = 0.543 for obese versus normal).
Discussion
To our knowledge, this study is the first comprehensive meta-analysis to date that has assessed the relationship between BMI and mortality in COPD patients. The findings from our study indicated that reduced BMI was associated with an increased risk of mortality in COPD. A higher risk of death was found not only in underweight patients, but also in those with normal BMI.
In our study, we found higher mortality associated with underweight individuals among patients with COPD when compared with those having a normal BMI value, while lower overall mortality in overweight and obese patients. Statistically similar results were obtained after risk adjustment analysis. These results demonstrated an inverse relationship between BMI and mortality among patients with COPD, which corresponded with most of the related studies. However, there was evidence of heterogeneity between studies in our analysis. After sensitivity analysis by sequential omission of individual studies, heterogeneity was effectively decreased or removed from all but two comparisons. In our study, the reasons for heterogeneity were unclear. It might have been due to methodological differences among studies, particularly on the cutoff point for underweight patients.
One of the most important finding in this study was that individuals even with a normal BMI had a higher risk of mortality. In recent years, lots of studies combined several variables including BMI to predict mortality in COPD. A good example is the BODE-index (Body mass index, Obstruction, Dyspnea, Exercise capacity) [4], a multidimensional 10-point scale in which higher scores indicate a higher risk of death. For body-mass index the values were 0 or 1, and the inflection point of BMI was 21 kg/m2. However, our results showed that BMI category associated with lower risk of mortality was 25 kg/m2 or more. Thus, a more reasonable scoring system concerning BMI might be a better predictor of mortality among patients with COPD.
The association between low BMI and poor survival among patients with COPD could be several reasons such as diaphragmatic muscle weakness [50], decreased lung function [52], and systemic inflammation [53], all of which is related to weight loss. Furthermore, proinflammatory status reflected by acute-phase proteins, tumor necrosis factor-a receptors, and soluble adhesion molecules is related to increasing resting energy expenditure in patients with COPD [54]. However, loss of skeletal muscle mass is the main cause of weight loss in COPD, whereas loss of fat mass contributes to a lesser extent [55]. Published data showed that fat-free mass index (FFMI) provided information in addition to BMI and assessment of FFMI was also suggested in the routine assessment [56].
Usually, obesity is a recognized risk factor for insulin resistance, obstructive sleep apnea, and cardiovascular disease. However, our study found that for patients with COPD being overweight or obese had a protective effect against mortality. The pathophysiological basis for this apparent obesity paradox is unknown. A recent study found thin patients with COPD to have more cardiovascular complications and a higher mortality rate [57]. In addition, Landbo et al thought that obesity in itself contributes to low FEV1, leading to those subjects being classified as having severe COPD while in fact they may not have experienced severe disease or a severe decline in lung function [38]. However, we could not obtain enough statistical power to explore those hypotheses because there were no sufficient data supplied in published studies. Further studies are needed to detect it by various methods, such as adjustment of obstructive ratio, FVC or subgroup analysis of individuals with severe flow limitation.
Considering deleterious effects of malnutrition in COPD patients, studies have been conducted and focused on the efficacy of nutritional supplementation therapy. Planas et al found administration of nutritional supplements to have a significant improvement in body weight and handgrip strength, decrement in airflow limitation, and increment in quality of life [58]. Raherison and Girodet thought that achieving an optimal nutritional status could delay the progression of COPD and might also reduce the risk of early mortality [59]. However, nutritional supplementation was only suggested as a part of the treatment approach in some specific individuals [60], [61]. Therefore, changing the BMI by nutritional supplementation, which improved COPD outcomes, needed further investigation.
As a systematic review, our findings and interpretations were limited by the quality and quantity of included studies. Firstly, the cutoff point for underweight was in disparity among studies and might have led to an underestimate risk of mortality in patients with low BMI. Secondly, detailed information, such as respiratory mortality and sex difference in mortality, were unavailable in most studies, which limited our further assessment of those confounding factors at the patient level, and were incorporated into the analysis. Thirdly, only studies written in English were included in this meta-analysis, which might have led to the bias. Lastly, as a meta-analysis, we were unable to get enough data to assess the relationship between BMI and mortality in different classes of obesity. There may be a ceiling BMI that is associated with better prognosis and this is not explored in the current study. Further studies should be more informative and then subgroup analysis by degree of obesity would be available.
In conclusion, our systematic review of 22 studies comprising 21,150 subjects showed that for patients with COPD being overweight or obese had a protective effect against mortality. However, the importance and efficacy of nutritional management of patients with COPD needed further clarification in well-designed, adequately powered clinical studies.
Acknowledgments
We are extremely thankful to Dr. Fen Lan of Department of Respiratory Medicine, Second Affiliated Hospital, College of Medicine, Zhejiang University, Hangzhou, for her review and scientific editing of the manuscript.
Funding Statement
This work is supported by research grants from Clinical academic key funds of the Chinese Ministry of Health (2007353) and special funds for scientific research on public causes of the Chinese Ministry of Health (201002008). The funders had no role in study design, data collection and analysis, decision to publish, or preparation of the manuscript.
References
- 1. Murray CJL, Lopez AD (1997) Mortality by cause for eight regions of the world: Global Burden of Disease Study. Lancet 349: 1269–1276. [DOI] [PubMed] [Google Scholar]
- 2. Celli BR, MacNee W (2004) ATS/ERS Task Force. Standards for the diagnosis and treatment of patients with COPD: a summary of the ATS/ERS position paper. Eur Respir J 23: 932–946. [DOI] [PubMed] [Google Scholar]
- 3. Waschki B, Kirsten A, Holz O, Müller KC, Meyer T, et al. (2011) Physical activity is the strongest predictor of all-cause mortality in patients with chronic obstructive pulmonary disease: a prospective cohort study. Chest 140: 331–42. [DOI] [PubMed] [Google Scholar]
- 4. Celli BR, Cote CG, Marin JM, Casanova C, Montes de Oca M, et al. (2004) The body-mass index, airflow obstruction, dyspnea, and exercise capacity index in chronic obstructive pulmonary disease. N Engl J Med 350: 1005–1012. [DOI] [PubMed] [Google Scholar]
- 5.Esteban C, Arostegui I, Moraza J, Aburto M, Quintana JM, et al. (2011) Development of a decision tree to assess the severity and prognosis of stable COPD. Eur Respir J In press. [DOI] [PubMed]
- 6. Slinde F, Grönberg A, Engström CP, Rossander-Hulthén L, Larsson S (2005) Body composition by bioelectrical impedance predicts mortality in chronic obstructive pulmonary disease patients. Respir Med 99: 1004–1009. [DOI] [PubMed] [Google Scholar]
- 7. de Voogd JN, Wempe JB, Koëter GH, Postema K, van Sonderen E, et al. (2009) Depressive symptoms as predictors of mortality in patients with COPD. Chest 135: 619–625. [DOI] [PubMed] [Google Scholar]
- 8. de Torres JP, Pinto-Plata V, Casanova C, Mullerova H, Córdoba-Lanús E, et al. (2008) C-reactive protein levels and survival in patients with moderate to very severe COPD. Chest 133: 1336–1343. [DOI] [PubMed] [Google Scholar]
- 9. Schols AM, Slangen J, Volovics L, Wouters EF (1998) Weight loss is a reversible factor in the prognosis of chronic obstructive pulmonary disease. Am J Respir Crit Care Med 157: 1791–1797. [DOI] [PubMed] [Google Scholar]
- 10.World Health Organization (2009) Global Database on Body Mass Index: BMI Classification. http://apps.who.int/bmi/index.jsp?introPage=intro_3.html. Accessed 2012 Jan 8.
- 11.Wells GA, Shea B, O'Connell D, Peterson J, Welch V, et al. (2010) The Newcastle-Ottawa Scale (NOS) for assessing the quality of nonrandomized studies in meta-analyses. http://www.ohri.ca/programs/clinical_epidemiology/oxford.htm. Accessed 2012 Apr 2.
- 12. Parmar MK, Torri V, Stewart L (1998) Extracting summary statistics to perform meta-analyses of the published literature for survival endpoints. Stat Med 17: 2815–2834. [DOI] [PubMed] [Google Scholar]
- 13. Higgins JP, Thompson SG, Deeks JJ, Altman DG (2003) Measuring inconsistency in meta-analyses. BMJ 327: 557–560. [DOI] [PMC free article] [PubMed] [Google Scholar]
- 14. Larsson SC, Orsini N, Wolk A (2010) Vitamin B6 and risk of colorectal cancer: a meta-analysis of prospective studies. JAMA 303: 1077–1083. [DOI] [PubMed] [Google Scholar]
- 15. Egger M, Davey Smith G, Schneider M, Minder C (1997) Bias in meta analysis detected by a simple, graphical test. BMJ 315: 629–634. [DOI] [PMC free article] [PubMed] [Google Scholar]
- 16. Ringbaek T, Martinez G, Brøndum E, Thøgersen J, Morgan M, et al. (2010) Shuttle walking test as predictor of survival in chronic obstructive pulmonary disease patients enrolled in a rehabilitation program. J Cardiopulm Rehabil Prev 30: 409–414. [DOI] [PubMed] [Google Scholar]
- 17. Schols AM, Slangen J, Volovics L, Wouters EF (1998) Weight loss is a reversible factor in the prognosis of chronic obstructive pulmonary disease. Am J Respir Crit Care Med 157: 1791–1797. [DOI] [PubMed] [Google Scholar]
- 18. Martinez FJ, Foster G, Curtis JL, Criner G, Weinmann G, et al. (2006) Predictors of mortality in patients with emphysema and severe airflow obstruction. Am J Respir Crit Care Med 173: 1326–1334. [DOI] [PMC free article] [PubMed] [Google Scholar]
- 19. Gray-Donald K, Gibbons L, Shapiro SH, Macklem PT, Martin JG (1996) Nutritional status and mortality in chronic obstructive pulmonary disease. Am J Respir Crit Care Med 153: 961–966. [DOI] [PubMed] [Google Scholar]
- 20. Connors AF Jr, Dawson NV, Thomas C, Harrell FE Jr, Desbiens N, et al. (1996) Outcomes following acute exacerbation of severe chronic obstructive lung disease. Am J Respir Crit Care Med 154: 959–967. [DOI] [PubMed] [Google Scholar]
- 21. De Benedetto F, Del Ponte A, Marinari S (2003) The role of nutritional status in the global assessment of severe COPD patients. Monaldi Arch Chest Dis 59: 314–319. [PubMed] [Google Scholar]
- 22. Tóth S, Tkácová R, Matula P, Stubna J (2004) Nutritional depletion in relation to mortality in patients with chronic respiratory insufficiency treated with long-term oxygen therapy. Wien Klin Wochenschr 116: 617–621. [DOI] [PubMed] [Google Scholar]
- 23. Yang L, Zhou M, Smith M, Yang G, Peto R, et al. (2010) Body mass index and chronic obstructive pulmonary disease-related mortality: a nationally representative prospective study of 220,000 men in China. Int J Epidemiol 39: 1027–1036. [DOI] [PubMed] [Google Scholar]
- 24. Walda IC, Tabak C, Smit HA, Räsänen L, Fidanza F, et al. (2002) Diet and 20-year chronic obstructive pulmonary disease mortality in middle-aged men from three European countries. Eur J Clin Nutr 56: 638–643. [DOI] [PubMed] [Google Scholar]
- 25. Hospers JJ, Postma DS, Rijcken B, Weiss ST, Schouten JP (2000) Histamine airway hyper-responsiveness and mortality from chronic obstructive pulmonary disease: a cohort study. Lancet 356: 1313–1317. [DOI] [PubMed] [Google Scholar]
- 26. Chailleux E, Fauroux B, Binet F, Dautzenberg B, Polu JM (1996) Predictors of survival in patients receiving domiciliary oxygen therapy or mechanical ventilation. A 10-year analysis of ANTADIR Observatory. Chest 109: 741–749. [DOI] [PubMed] [Google Scholar]
- 27. Mannino DM, Buist AS, Petty TL, Enright PL, Redd SC (2003) Lung function and mortality in the United States: data from the First National Health and Nutrition Examination Survey follow up study. Thorax 58: 388–393. [DOI] [PMC free article] [PubMed] [Google Scholar]
- 28. Swallow EB, Reyes D, Hopkinson NS, Man WD, Porcher R, et al. (2007) Quadriceps strength predicts mortality in patients with moderate to severe chronic obstructive pulmonary disease. Thorax 62: 115–120. [DOI] [PMC free article] [PubMed] [Google Scholar]
- 29. Soler-Cataluña JJ, Sánchez-Sánchez L, Martínez-García MA, Sánchez PR, Salcedo E, et al. (2005) Mid-arm muscle area is a better predictor of mortality than body mass index in COPD. Chest 128: 2108–2115. [DOI] [PubMed] [Google Scholar]
- 30. Chang CL, Sullivan GD, Karalus NC, Hancox RJ, McLachlan JD, et al. (2007) Audit of acute admissions of chronic obstructive pulmonary disease: inpatient management and outcome. Intern Med J 37: 236–241. [DOI] [PubMed] [Google Scholar]
- 31. Ringbaek TJ, Viskum K, Lange P (2004) BMI and oral glucocorticoids as predictors of prognosis in COPD patients on long-term oxygen therapy. Chron Respir Dis 1: 71–78. [DOI] [PubMed] [Google Scholar]
- 32. Esteban C, Quintana JM, Moraza J, Aburto M, Aguirre U, et al. (2010) BODE-Index vs HADO-score in chronic obstructive pulmonary disease: Which one to use in general practice? BMC Med 8: 28. [DOI] [PMC free article] [PubMed] [Google Scholar]
- 33. Seersholm N (1997) Body mass index and mortality in patients with severe alpha 1-antitrypsin deficiency. Respir Med 91: 77–82. [DOI] [PubMed] [Google Scholar]
- 34. Marti S, Muñoz X, Rios J, Morell F, Ferrer J (2006) Body weight and comorbidity predict mortality in COPD patients treated with oxygen therapy. Eur Respir J 27: 689–696. [DOI] [PubMed] [Google Scholar]
- 35. Pothirat C, Phetsuk N, Deesomchok A, Theerakittikul T, Bumroongkit C, et al. (2007) Clinical characteristics, management in real world practice and long-term survival among COPD patients of Northern Thailand COPD club members. J Med Assoc Thai 90: 653–662. [PubMed] [Google Scholar]
- 36. Gunen H, Hacievliyagil SS, Kosar F, Mutlu LC, Gulbas G, et al. (2005) Factors affecting survival of hospitalised patients with COPD. Eur Respir J 26: 234–241. [DOI] [PubMed] [Google Scholar]
- 37. Collins PF, Stratton RJ, Kurukulaaratchy R, Elia M (2010) The ‘obesity paradox’ in chronic obstructive pulmonary disease. Thorax 65: 74. [Google Scholar]
- 38. Landbo C, Prescott E, Lange P, Vestbo J, Almdal TP (1999) Prognostic value of nutritional status in chronic obstructive pulmonary disease. Am J Respir Crit Care Med 160: 1856–1861. [DOI] [PubMed] [Google Scholar]
- 39. Budweiser S, Jörres RA, Riedl T, Heinemann F, Hitzl AP, et al. (2007) Predictors of survival in COPD patients with chronic hypercapnic respiratory failure receiving noninvasive home ventilation. Chest 131: 1650–1658. [DOI] [PubMed] [Google Scholar]
- 40. Hallin R, Gudmundsson G, Suppli Ulrik C, Nieminen MM, Gislason T, et al. (2007) Nutritional status and long-term mortality in hospitalised patients with chronic obstructive pulmonary disease (COPD). Respir Med 101: 1954–1960. [DOI] [PubMed] [Google Scholar]
- 41. Chailleux E, Laaban JP, Veale D (2003) Prognostic value of nutritional depletion in patients with COPD treated by long-term oxygen therapy: data from the ANTADIR observatory. Chest 123: 1460–1466. [DOI] [PubMed] [Google Scholar]
- 42. Hansen EF, Vestbo J, Phanareth K, Kok-Jensen A, Dirksen A (2001) Peak flow as predictor of overall mortality in asthma and chronic obstructive pulmonary disease. Am J Respir Crit Care Med 163: 690–693. [DOI] [PubMed] [Google Scholar]
- 43. Jordan JG Jr, Mann JR (2010) Obesity and mortality in persons with obstructive lung disease using data from the NHANES III. South Med J 103: 323–330. [DOI] [PubMed] [Google Scholar]
- 44. Machado MC, Krishnan JA, Buist SA, Bilderback AL, Fazolo GP, et al. (2006) Sex differences in survival of oxygen-dependent patients with chronic obstructive pulmonary disease. Am J Respir Crit Care Med 174: 524–529. [DOI] [PubMed] [Google Scholar]
- 45. Almagro P, Salvadó M, Garcia-Vidal C, Rodriguez-Carballeira M, Delgado M, et al. (2010) Recent improvement in long-term survival after a COPD hospitalisation. Thorax 65: 298–302. [DOI] [PubMed] [Google Scholar]
- 46. Haruna A, Muro S, Nakano Y, Ohara T, Hoshino Y, et al. (2010) CT scan findings of emphysema predict mortality in COPD. Chest 138: 635–640. [DOI] [PubMed] [Google Scholar]
- 47. Ringbaek T, Seersholm N, Viskum K (2005) Standardised mortality rates in females and males with COPD and asthma. Eur Respir J 25: 891–895. [DOI] [PubMed] [Google Scholar]
- 48. Schembri S, Anderson W, Morant S, Winter J, Thompson P, et al. (2009) A predictive model of hospitalisation and death from chronic obstructive pulmonary disease. Respir Med 103: 1461–1467. [DOI] [PubMed] [Google Scholar]
- 49. Prescott E, Almdal T, Mikkelsen KL, Tofteng CL, Vestbo J, et al. (2002) Prognostic value of weight change in chronic obstructive pulmonary disease: results from the Copenhagen City Heart Study. Eur Respir J 20: 539–544. [DOI] [PubMed] [Google Scholar]
- 50. Vestbo J, Prescott E, Almdal T, Dahl M, Nordestgaard BG, et al. (2006) Body mass, fat-free body mass, and prognosis in patients with chronic obstructive pulmonary disease from a random population sample: findings from the Copenhagen City Heart Study. Am J Respir Crit Care Med 173: 79–83. [DOI] [PubMed] [Google Scholar]
- 51. Tsimogianni AM, Papiris SA, Stathopoulos GT, Manali ED, Roussos C, et al. (2009) Predictors of outcome after exacerbation of chronic obstructive pulmonary disease. J Gen Intern Med 24: 1043–1048. [DOI] [PMC free article] [PubMed] [Google Scholar]
- 52. Coxson HO, Chan IH, Mayo JR, Hlynsky J, Nakano Y, et al. (2004) Early emphysema in patients with anorexia nervosa. Am J Respir Crit Care Med 170: 748–752. [DOI] [PubMed] [Google Scholar]
- 53. Tomoda K, Yoshikawa M, Itoh T, Tamaki S, Fukuoka A, et al. (2007) Elevated circulating plasma adiponectin in underweight patients with COPD. Chest 132: 135–140. [DOI] [PubMed] [Google Scholar]
- 54. Eid AA, Ionescu AA, Nixon LS, Lewis-Jenkins V, Matthews SB, et al. (2001) Inflammatory response and body composition in chronic obstructive pulmonary disease. Am J Respir Crit Care Med 164: 1414–1418. [DOI] [PubMed] [Google Scholar]
- 55. Ischaki E, Papatheodorou G, Gaki E, Papa I, Koulouris N, et al. (2007) Body mass and fat-free mass indices in COPD: relation with variables expressing disease severity. Chest 132: 164–169. [DOI] [PubMed] [Google Scholar]
- 56. Vestbo J, Prescott E, Almdal T, Dahl M, Nordestgaard BG, et al. (2006) Body mass, fat-free body mass, and prognosis in patients with chronic obstructive pulmonary disease from a random population sample: findings from the Copenhagen City Heart Study. Am J Respir Crit Care Med 173: 79–83. [DOI] [PubMed] [Google Scholar]
- 57. Blum A, Simsolo C, Sirchan R, Haiek S (2011) “Obesity paradox” in chronic obstructive pulmonary disease. Isr Med Assoc J 13: 672–675. [PubMed] [Google Scholar]
- 58. Planas M, Alvarez J, García-Peris PA, de la Cuerda C, de Lucas P, et al. (2005) Nutritional support and quality of life in stable chronic obstructive pulmonary disease (COPD) patients. Clin Nutr 24: 433–441. [DOI] [PubMed] [Google Scholar]
- 59. Raherison C, Girodet PO (2009) Epidemiology of COPD. Eur Respir Rev 18: 213–221. [DOI] [PubMed] [Google Scholar]
- 60. Aniwidyaningsih W, Varraso R, Cano N, Pison C (2008) Impact of nutritional status on body functioning in chronic obstructive pulmonary disease and how to intervene. Curr Opin Clin Nutr Metab Care 11: 435–442. [DOI] [PMC free article] [PubMed] [Google Scholar]
- 61. Velema MS, Kwa BH, de Ronde W (2012) Should androgenic anabolic steroids be considered in the treatment regime of selected chronic obstructive pulmonary disease patients? Curr Opin Pulm Med 18: 118–124. [DOI] [PubMed] [Google Scholar]