Abstract
A prochelator named BHAPI (N′-(1-(2-(4-(4,4,5,5-tetramethyl-1,3,2-dioxaborolan-2-yl)benzyloxy)phenyl)ethylidene)isonitotinohdrazide) based on the structure of experimental metal chelator HAPI (N′-[1-(2-hydroxyphenyl)ethyliden]isonicotinoylhydrazide) has been synthesized. The prochelator, which shows limited affinity for metal ions, is converted efficiently upon reaction with hydrogen peroxide into its chelator form, which binds di- and trivalent metal ions, including Zn2+, Cu2+ and Fe3+. This work shows that the prochelator has a protective effect on cells under oxidative stress induced by either hydrogen peroxide or the cytotoxic herbicide paraquat. The effect of BHAPI and HAPI on cellular iron status was assessed by monitoring the mRNA level of the transferrin receptor. Whereas the chelator HAPI induces iron deficiency in cultured retinal pigment epithelial cells, the prochelator does not, providing evidence that the differential metal-binding capacity of these compounds observed in vitro is replicated in the cellular context.
1. Introduction
Metal ions play important roles in the proper functioning of any living organism, but pathologies can develop when metal homeostasis is disturbed.1–4 Metal chelation therapy can be effective in cases of systemic metal overloads, such as heavy metal intoxication, iron overload from transfusions, and copper overload in Wilson’s disease.5, 6 Many other scenarios, however, involve metal perturbations that are localized to a certain organ or subcellular location and are not associated with a systemic metal imbalance. Degenerative disorders like Parkinson’s, Alzheimer’s and macular degeneration fall into this category.3, 4, 7 Using metal chelation as a therapeutic strategy in these situations requires a more advanced approach, since administration of nonspecific but strong chelating agents could lead to indiscriminate metal binding in healthy tissue, metal deprivation, or other unintended consequences. Advanced designs of compounds for “smarter” chelation approaches involve using targeting vectors to localize the compound to a desired site, incorporating an enzyme inhibitor or other functionality for added benefit, or installing a reactive handle that takes advantage of chemical reactivity that may be unique to a disease condition.8, 9 It is this latter approach that we use in our work, in which we are interested in manipulating the distribution and reactivity of redox-active transition metal ions, notably copper and iron, since they can catalyze the Fenton reaction that transforms H2O2 into the highly toxic hydroxyl radical OH•, thereby exacerbating cellular oxidative stress.10, 11 Our lab has developed a masking strategy that employs boronate esters as the reactive handle and H2O2 as the condition that is unique (or at least elevated) to diseases associated with oxidative stress. The reaction with H2O2 results in the conversion of a prochelator that has weak to no interactions with metal ions into a strongly binding chelator that can suppress Fenton reactivity.
Our first generation prochelator BSIH was derived from salicylaldehyde isonicotinoyl hydrazone (SIH), a member of the aroylhydrazone chelator family.12–14 It showed promising results exhibiting the ability to limit hydroxyl radical production in vitro and protect cells from damage by exogenous hydrogen peroxide insult.15 The major setback is the limited hydrolytic stability of SIH in cellular media and plasma.16 It should be noted that BSIH itself did not suffer from this issue.
We therefore decided to develop a later-generation prochelator based on the structure of an SIH analogue N′-[1-(2-hydroxyphenyl)ethyliden]isonicotinoylhydrazide (HAPI), which was shown to be more stable to hydrolysis than SIH.16 Herein we present the development of this later generation prochelator BHAPI (N′-(1-(2-(4-(4,4,5,5-tetramethyl-1,3,2-dioxaborolan-2-yl)benzyloxy)phenyl)ethylidene)isonitotinoylhydrazide)) and demonstrate its ability to protect cells in culture from damage induced by direct addition of hydrogen peroxide as well as by the herbicide paraquat, which itself is not reactive with BHAPI but which induces oxidative stress in cells that is sufficient to activate the prochelator. We further demonstrate that BHAPI does not alter the iron status of normal cells, in contrast to the chelator form, which induces general iron deficiency, as evidenced by the change in mRNA expression level of the transferrin receptor.
2. Results and discussion
2.1. Synthesis and characterization of BHAPI
The structures of the chelators and prochelators discussed in this paper are shown in Fig. 1. SIH is the parent aroylhydrazone chelator from which the prochelator BSIH was derived. HAPI is the methylketone derivative of SIH that has been shown by Simunek and coworkers to have significantly improved plasma stability compared to SIH,16 and HAPI-CON is a control compound wherein the phenol is ill-placed for tridentate metal chelation. Attempts to synthesize a prochelator version of HAPI directly analogous to BSIH were unsuccessful. Replacing the pinacol diol with a pinanediol cap on the boron facilitated a successful synthesis and isolation of HAPI-BPD. However, the hydrazone bond in HAPI-BPD rapidly decomposes in aqueous media, severely limiting its utility as a prochelator. To overcome these challenges, we replaced the direct boronic ester protecting group of BSIH and HAPI-BPD with a self-immolative spacer that undergoes a spontaneous elimination after reaction with H2O2.17 The new prochelator BHAPI was successfully synthesized in two steps by alkylation of 2-hydroxy acetophenone with 4-bromomethylphenylboronic acid pinacol ester followed by hydrazone bond formation with isonicotinic hydrazide, as shown in Scheme 1.
Fig. 1.
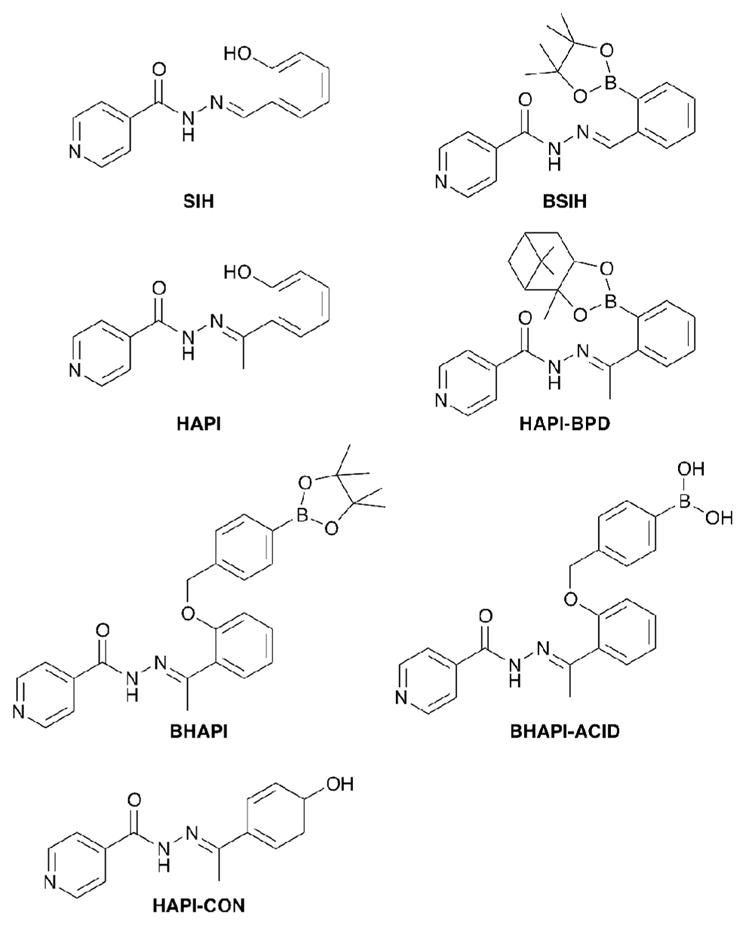
Structures of chelators and prochelators
Scheme 1.
Synthetic scheme for BHAPI
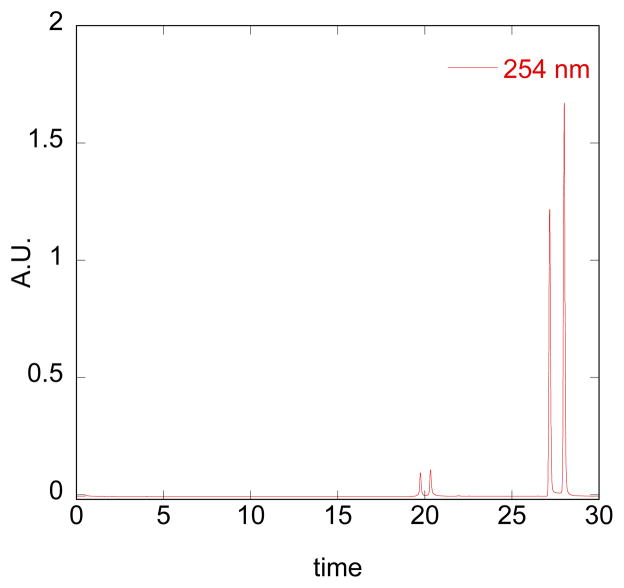
1H NMR and HPLC reveal that BHAPI exists as a mixture of isomers. Fig. 2 shows an HPLC trace of a BHAPI sample initially dissolved in acetonitrile. Mass spectrometric analysis of the individually collected peaks revealed that the two major peaks both give an m/z value of 472 g/mol, which corresponds to intact BHAPI, whereas the two minor peaks correspond to the boronic acid version of BHAPI with m/z of 390. These results suggest that each pair of peaks represents configurational isomers of BHAPI and BHAPI-acid. The nature of this isomerism was not investigated in detail, but could derive from E/Z isomers of the hydrazone double bond, amide isomerism of isonicotinic group, and/or steric limits to free rotation. Further evidence that the double peaks in the chromatograms are the result of distinct isomers of BHAPI is the formation of a single isomer of HAPI upon reaction of H2O2 (vide infra). NMR spectra of an enriched sample of BHAPI following chromatography showed re-equilibration to the mixture of isomers within hours, indicating that isolation of each distinct isomer would be difficult. Furthermore, the NMR signals show a temperature-dependent change in ratio, suggesting a low barrier to isomerization (see ESI). The parent prochelator BSIH also exists as a mixture of isomers.13
Fig. 2.
HPLC chromatogram of a 100-μM sample of BHAPI prepared in acetonitrile (method 1, Experimental section). The two major peaks that elute at 27.1 and 28.0 min have the same mass (472 g/mol) as that of intact BHAPI, while the two smaller peaks that elute at 19.5 and 20.2 min give the same mass as that of BHAPI-acid (390 g/mol).
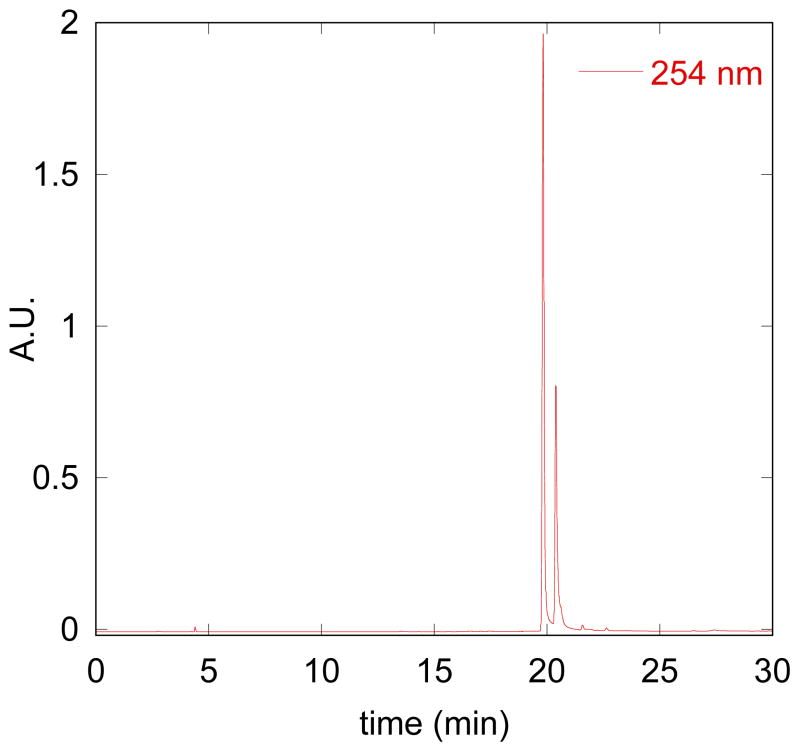
Speciation of BHAPI in aqueous solution, however, is further complicated by the fact that the boronic ester hydrolyzes to release free pinacol diol and the corresponding boronic acid version of BHAPI, as indicated by the presence of BHAPI-acid in the HPLC chromatograms mentioned above. A preponderance of the boronic acid form is observed by HPLC when BHAPI samples are dissolved directly in water (Fig. 3) whereas the boronic ester form remains intact for samples prepared in acetonitrile or other organic solvents, as shown in Fig 2. Further evidence for diol dissociation is the presence of the free pinacol observed in NMR spectra of BHAPI taken in D2O (methyl protons appear at 1.1 ppm), whereas the bound version is observed in spectra taken in organic solvents (1.3 ppm). We have observed similar loss of pinacol diol for BSIH in aqueous solution. Whereas specialized reaction conditions are developed in organic synthesis implicitly for the deprotection of boronic esters in order to obtain boronic acids,18, 19 the complex equilibria between boronic acids and esters in water is well documented.20 We therefore suspect that many aryl boronic esters with pinacol capping groups that are used as cell culture reagents or probes likely equilibrate to their boronic acid form in water.
Fig. 3.
HPLC chromatogram of a 100-μM sample of BHAPI prepared in water (method 1, Experimental section). The two major peaks that elute at 19.5 and 20.2 min contain species with the same mass (390 g/mol), which matches that of BHAPI-acid.
2.2. Stability of SIH, HAPI, and BHAPI
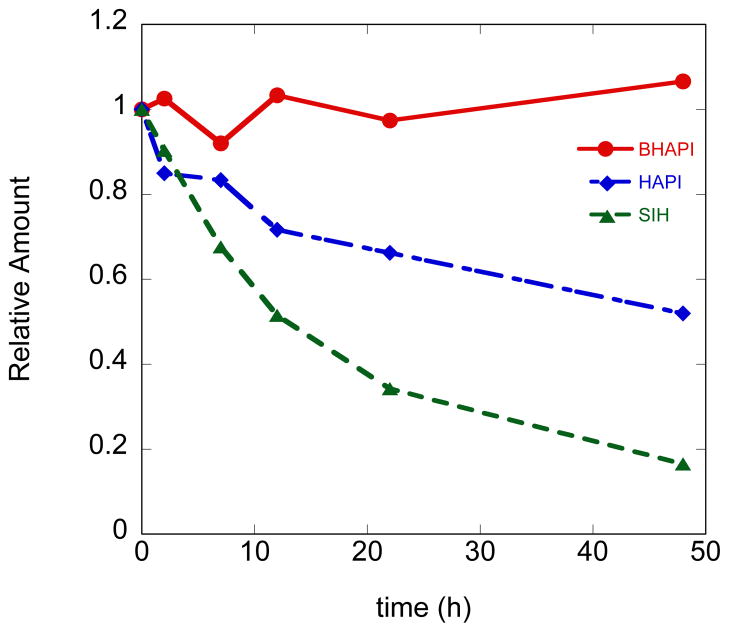
As one of our motivations for developing a later generation prochelator was to overcome the instability issues that plague the hydrazone linkage of the SIH family of compounds under physiological conditions, we investigated the integrity of BHAPI in MEM cell culture medium at 37 °C and pH 7.4. The connectivity of hydrazone linkages is pH dependent, but as we and others observed previously for SIH, other components in solution dramatically influence the stability of these compounds, even at pH values where they are predicted to be stable.15, 21 MEM contains a mixture of metal salts, amino acids, and nutrients, and therefore provides a complex and biologically relevant mixture in which to challenge the stability of these compounds. The amount of each compound was assessed by an HPLC assay in which integrated peak areas were compared relative to caffeine as an internal standard at several time points over the course of a 48 h incubation at 37 °C. The results of BHAPI are compared to those of HAPI and SIH in Fig. 4. Our results in MEM show the expected increase in stability of HAPI compared to SIH. Studies by Simunek and coworkers have shown that this difference in stability between HAPI and SIH is even more pronounced in plasma.16 The results in Fig. 4 also show the near absolute stability of the BHAPI core structure under these experimental conditions. It should be noted that BHAPI and HAPI do decompose at low (pH < 5) and high (pH > 12) extremes of pH. As noted above, BHAPI loses the pinacol ester in aqueous solution, and indeed the compound identified in this HPLC assay is actually the BHAPI-acid version. The conclusion from these combined results is that the prochelator exists as the boronic acid version of BHAPI and is very stable under cell culture conditions around neutral pH.
Fig. 4.
Plot of stability of 100 μM BHAPI, HAPI and SIH in MEM at 37 °C over 48 h.
2.3. H2O2-triggered conversion of BHAPI to HAPI
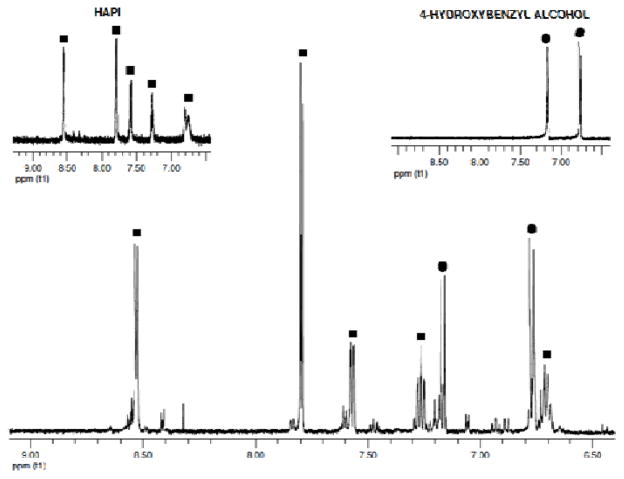
Identifying the products and the rate of the prochelator-to-chelator conversion reaction are important, as these characteristics define the likelihood of delivering an active chelator in a timely manner. The reaction is anticipated to occur as shown in Scheme 2, where oxidation of the boronic acid/ester 5 gives a phenol intermediate (2) that undergoes a spontaneous 1,6 elimination to release HAPI and a quinone methide, which subsequently forms 4-hydroxybenzyl alcohol in aqueous solution. Fig. 5 shows the aromatic region of a 1H NMR spectrum of a 250-μM sample of BHAPI in D2O after reaction with excess H2O2. The expected products HAPI and 4-hydroxybenzyl alcohol are clearly identified as the major products. There are, however, minor side products present. Repeating the reaction at 1 mM concentration of BHAPI enabled isolation of the side products for analysis by MS and NMR. Most of the side products have m/z values of 362, a molecular mass that corresponds to the intermediate phenol (2) formed from BHAPI prior to the 1,6 elimination of quinone methide. We suspect that the side products form by a back reaction of the quinone methide with nucleophilic sites on HAPI (see ESI). Additionally, we have identified a side product with m/z of 350, which has an NMR spectrum consistent with a structure of doubly alkylated isonicotinic hydrazide. This product could result from partial HAPI degradation under the reaction conditions and reaction of the formed isonicotinic hydrazide with the quinone intermediate.
Scheme 2.
Reaction of BHAPI with H2O2 in water.
Fig. 5.
1H NMR spectrum of the reaction mixture of BHAPI (250 μM in D2O with 2.5 % DMSO) with 50 mM H2O2. Insets show spectra of HAPI and 4-hydroxybenzyl alcohol (expected reaction products) for comparison.
It should be noted that the formation of the side products is significantly enhanced at the higher BHAPI concentration of this experiment. Running the reaction in organic solvent also increases the presence of these side reactions, due to the absence of water to compete for quinone methide reaction. Thus it can be expected that at concentrations of 100 μM or lower in water, as used for example in cellular experiments described below, clean formation of the desired HAPI and 4-hydroxybenzyl alcohol products will be favored.
The formation of a quinone methide as an intermediate during BHAPI deprotection points to an additional source of potential biological activity of this compound. Quinone methides are reactive species known to react with cellular nucleophiles. For example, the anticancer activity of some quinone methide-releasing prodrugs has been linked to alkylation and hence depletion of glutathione.22, 23 While depleting endogenous antioxidants like glutathione may seem counter-productive to the cytoprotective mechanisms envisioned for BHAPI, we do not yet know the implications of quinone methide release in this particular case. As shown in the following sections, BHAPI itself is not cytotoxic, but does provide significant protection to cells challenged with oxidative insult. Whether the quinone methide counteracts the overall protective action of BHAPI awaits further study.
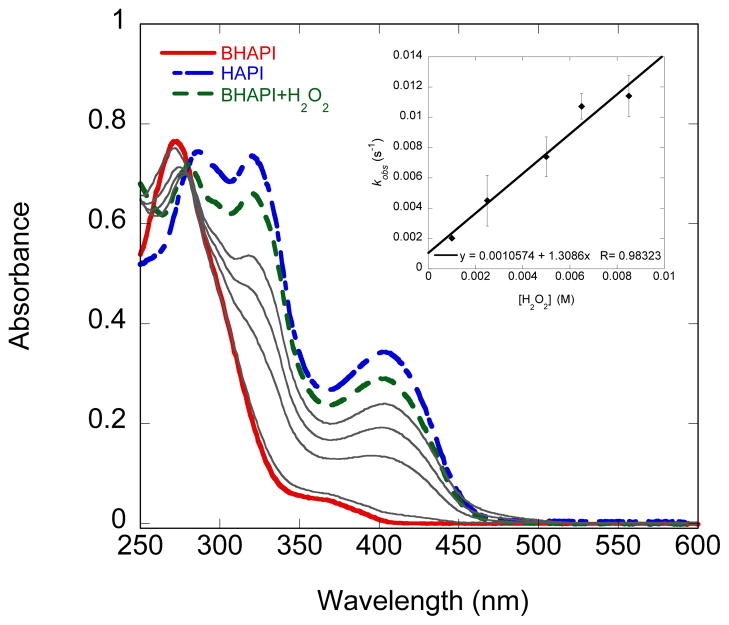
In addition to following the reaction of BHAPI with H2O2 by 1H NMR spectrometry, we have also monitored the reaction by UV-vis spectrophotometry. As can be seen in Fig. 6, the UV-Vis spectrum of 85 μM BHAPI in PBS buffer pH 7.4 after exposure to H2O2 closely resembles that of an authentic HAPI sample. This result suggests that the conversion reaction proceeds smoothly and cleanly under these conditions. The rate of the reaction was assessed by monitoring the increase in absorbance at 408 nm vs time for solutions of BHAPI under pseudo first-order conditions of excess of H2O2. The second-order rate constant for this reaction was then obtained from the data shown in Fig. 6 to be 1.31 M−1s−1, which is 25 times faster than that for BSIH.
Fig. 6.
UV-vis spectra of 85 μM BHAPI, HAPI, and BHAPI after reaction with 5 mM H2O2 in PBS buffer, pH 7.4, 25 °C. Gray solid lines show the intermediate spectra of the reaction of BHAPI with H2O2. Insert shows a plot of kobs as a function of H2O2 concentration for its reaction with BHAPI (85 μM).
While the reactivity of aryl boronates with H2O2 is well recognized, it should be noted that these groups are very reactive with peroxynitrite as well, usually with much faster rates.24, 25 Preliminary investigations indicate that BHAPI indeed reacts rapidly with peroxynitrite to release HAPI as a product (unpublished results).
2.4. Differential metal binding by BHAPI and HAPI
Another critical characteristic of a well-designed prochelator is a significantly diminished affinity for metal ions in comparison to its parent chelator. We therefore investigated the interaction of BHAPI, HAPI and HAPI-CON with biologically important transition metal ions Fe3+, Fe2+, Cu2+, and Zn2+.
As shown in the UV-vis spectra in Fig. 7, no significant spectral change occurs after addition of Fe3+ to a buffered aqueous solution of BHAPI. Conversely, addition of Fe3+ to a solution of HAPI induces a significant change in spectrum that coincides with a color change from faint yellow to brown and indicates a metal-ligand binding interaction. Because HAPI can form both 1:2 and 1:1 metal:ligand complexes, the spectra of the 1:1 ratio of HAPI (BHAPI) to Fe3+ are provided in the ESI.
Fig 7.
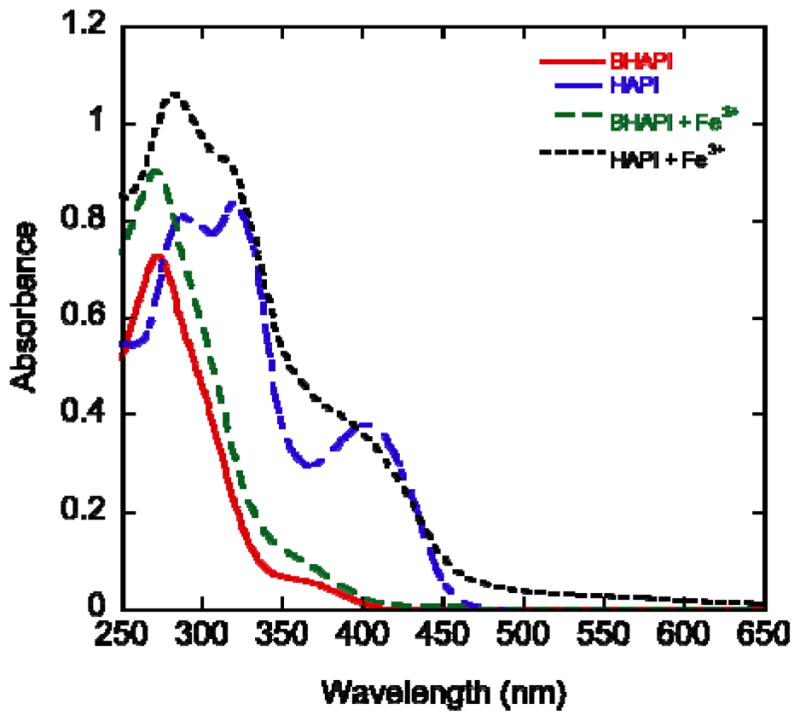
UV-vis spectra of BHAPI and HAPI (85 μM in PBS at pH 7.4) before and after addition of Fe3+ (42.5 μM), added as ferric ammonium citrate.
Addition of an Fe2+ source to a solution of either HAPI or BHAPI results in UV-Vis spectra that are essentially identical to those seen in Fig. 7 for Fe3+ (see ESI). These results imply that Fe2+ also fails to interact with BHAPI, but does complex with HAPI. The similarity in the iron–HAPI spectra regardless of whether the starting iron source is ferric ammonium citrate or ferrous ammonium sulfate suggests that Fe3+ is the preferred oxidation state to bind with HAPI and that HAPI readily favors the oxidation of Fe2+ to Fe3+ under these conditions.
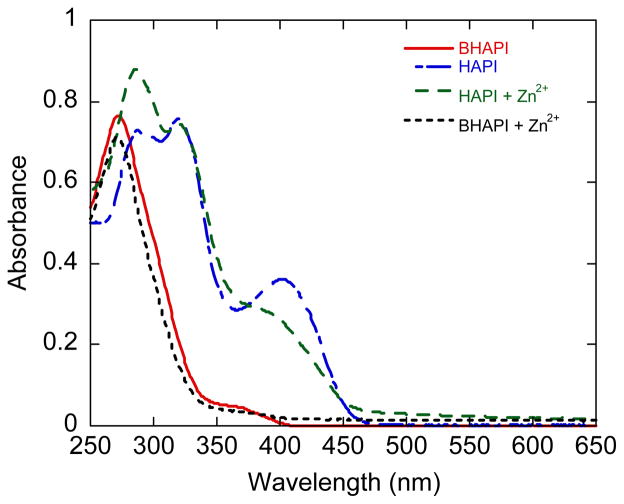
Similar to what is observed for Fe3+, addition of Zn2+ to a buffered aqueous solution of BHAPI results in virtually no spectral change, whereas significant change is observed when Zn2+ is added to solutions of HAPI (Fig. 8).
Fig 8.
UV-vis spectra of BHAPI and HAPI (85 μM in PBS at pH 7.4) before and after addition of one equivalent of Zn(SO4).
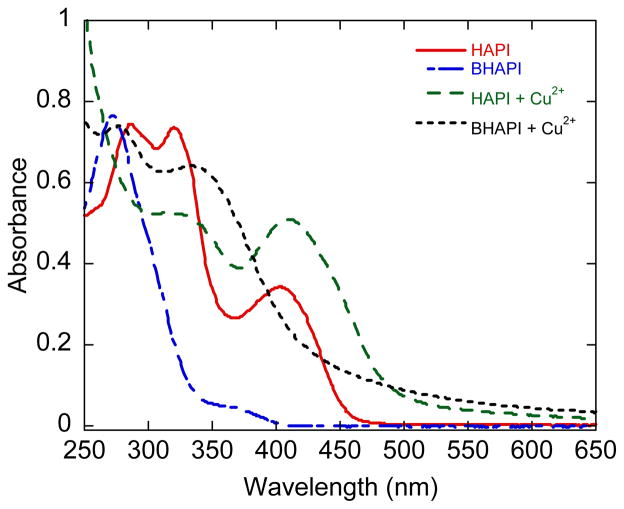
In contrast to the results for zinc and iron, addition of Cu2+ to solutions of either BHAPI or HAPI results in spectral changes in both cases, not just the HAPI case (Fig. 9). The change in spectrum of BHAPI upon the addition of Cu2+ suggests that even in its prochelator form, BHAPI retains some affinity for cupric ions. Because the carbonyl O and the imine N of hydrazones are known to form bidentate complexes with Cu2+,26 we explored whether this molecular unit is responsible for the Cu2+ interaction with BHAPI by investigating the spectral response of solutions of the control compound HAPI-CON in the presence of metal ions. As shown in the ESI, the spectrum of HAPI-CON in PBS buffer does not change in the presence of Cu2+, Zn2+, or Fe3+, suggesting that this unit on its own is insufficient for complexing these ions under these conditions. The interaction observed in aqueous solutions of BHAPI and Cu2+ is therefore dependent on the boronic acid unit of BHAPI. In previous studies with BSIH, we observed that the combination of a N/O unit of the aroyl hydrazone backbone along with a neighboring boronic acid moiety provides a weak but noticeable binding site for Cu2+.14 Others have also invoked boronic acid units as part of a Cu2+-chelating site.27
Fig 9.
UV-vis spectra of BHAPI and HAPI (85 μM in PBS at pH 7.4) before and after addition of one equivalent of Cu2+, supplied as [Cu(gly)2].
In order to gauge the relative strength of the BHAPI-Cu interaction, we used nitrilotriacetic acid (NTA) as a competitive chelator that has an apparent affinity for Cu2+ at pH 7.4 of 10.64 (log K′). The addition of one equivalent of NTA to a Cu–BHAPI solution results in full restoration of the original BHAPI spectrum, indicating that NTA readily competes with BHAPI for complete extraction of Cu2+ from BHAPI (see ESI). In contrast, one equivalent of NTA does not change the spectrum of a solution of Cu–HAPI at all, indicating that HAPI is significantly stronger than NTA for Cu2+ binding (see ESI). The weakness of the interaction between BHAPI and Cu2+ is further illustrated by the fact that histidine also competes with BHAPI for Cu2+ binding (see ESI), as just two equivalents of histidine reduce the Cu-BHAPI spectral feature significantly. These combined results indicate that the interaction of BHAPI with Cu2+ is significantly weaker than that of HAPI and that the presence of a simple copper chelating amino acid like histidine is sufficient to strip copper from BHAPI.
The differential ability to bind Fe3+ by BHAPI, HAPI, and HAPI-CON was further investigated by using calcein as a fluorescence indicator of competitive metal chelation. We prepared a 2-μM complex of calcein with Fe3+ in PBS, which resulted in 60 % quenching of calcein fluorescence. Only HAPI was able to restore calcein fluorescence upon addition to this complex (see ESI), lending further support to the conclusion that HAPI is the only compound having significant metal affinity and that BHAPI is indeed a prochelator of weak if any affinity for metal ions.
2.5. Protection of ARPE cells from oxidative stress
Having shown that BHAPI possesses favorable prochelator properties, we turned our attention to investigating its ability to protect cells subjected to oxidative stress. These experiments were conducted on retinal pigment epithelial ARPE-19 cells as they suffer from iron-induced oxidative stress during macular degeneration.28, 29 Initial cytotoxicity studies revealed that BHAPI, HAPI, and HAPI-CON were not cytotoxic at concentrations up to 100 μM for 24 h exposures (see ESI).
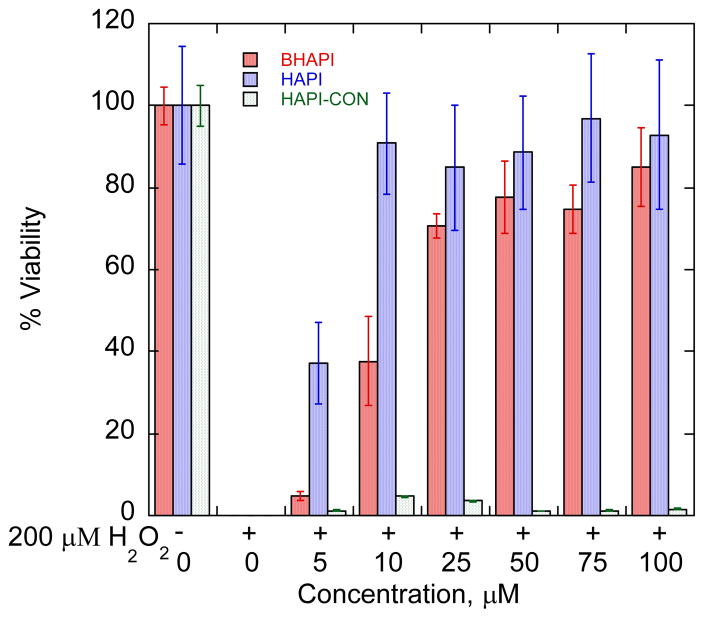
As shown in Fig. 10, cells exposed to a toxic 200-μM bolus of H2O2 are protected from cell death by both HAPI and BHAPI, but not by the non-chelating control HAPI-CON. While HAPI is more cytoprotective than BHAPI, being effective at concentrations between 5–10 μM vs 25 μM, respectively, it should also be noted that the protective effect of BHAPI is observed well below the concentration of added H2O2. These results imply that metal chelation is the probable mode of protective action for both BHAPI and HAPI even though consumption of H2O2 in reaction with BHAPI can be considered a supplementary mode of action. Similar protection was observed in our group using SIH and BSIH to protect ARPE cells stressed with H2O2.15 Furthermore SIH and HAPI were shown to protect against oxidative stress in H9c2 cell line by Simunek and coworkers.16, 30
Fig. 10.
Cell viability plot for ARPE cells stressed with 200 μM H2O2 in the presence of BHAPI, HAPI, and HAPI-CON. Cell viability was assessed 19 h after peroxide treatment.
Because these initial cytoprotection assays were done by stressing cells with exogenous H2O2, they do not test whether the prochelators are activated intracellularly or whether disease-like conditions that lead to oxidative stress can activate prochelators to an extent sufficient for cytoprotection. A better model for assessing the utility of prochelators is to test them under conditions where added stressors induce oxidative stress, but are not themselves reactive oxygen species. For these studies, we chose paraquat (methyl viologen) as the stressor, since it is an environmental risk factor for Parkinson’s disease and is known to induce overproduction of superoxide radicals with concomitant release of H2O2 and liberation of iron from iron-sulfur clusters such as aconitase.31, 32
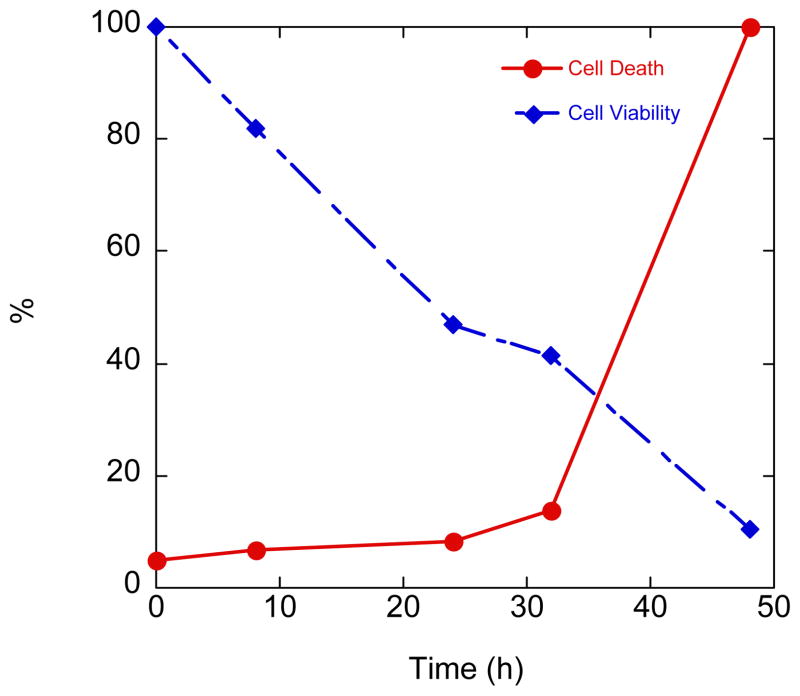
The time dependence of cellular damage induced by treatment of ARPE cells with paraquat was monitored using both cell viability and cell death assays and is shown in Fig. 11. The results appear slightly different depending on whether the assay reports on cell death, as evidenced by LDH release, or cell viability, as reported by the Celltitre Blue assay. The Celltitre Blue assay relies on reduction of the dye resazurin to resorufin by respiring cells, and therefore is an indicator of metabolic capacity, which does not necessarily imply a direct inverse relationship with cell death. Paraquat could interfere with the outcome of this assay as its mode of action involves removal of electrons from the mitochondrial electron transport chain,32 thereby competing with Celltitre reduction. While there is a steady decline over the course of 48 h in cell viability (i.e. metabolic capacity) as assayed by Celltitre Blue, the LDH release assay shows a sharp increase in cell death only after 30 h of paraquat exposure. This result implies that the build-up of oxidative stress does not become acute until a delay of at least 30 h after initial exposure.
Fig. 11.
Time course of damage to ARPE cells caused by 10 mM paraquat
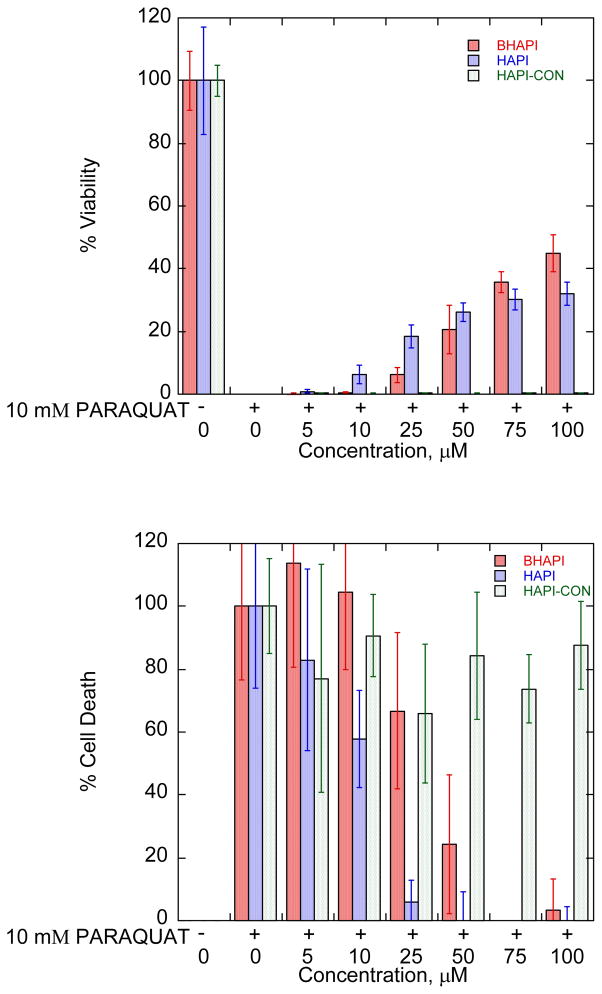
Given the results of the time-course experiment described above, experiments testing the protective effects of BHAPI in ARPE-19 cells treated with 10 mM paraquat were monitored after 48 h of exposure, which leads to complete cell death in unprotected cells. The data in Fig. 12 show that both HAPI and BHAPI have a protective effect against this paraquat-induced cytotoxicity, whereas HAPI-CON does not. The inability of HAPI-CON to protect cells from damage induced by paraquat (Fig. 12) suggests the importance of metal chelation for the protective effect. Iron chelation by desferrioxamine (DFO) and a deferiprone analogue (CP51) has been implied as a mode of protection to cells against paraquat cytotoxicity.33, 34
Fig. 12.
Cell viability (top) and cell death (bottom) plots for ARPE cells stressed with 10 mM paraquat in the presence of BHAPI, HAPI, and HAPI-CON. Assays conducted 48 h after paraquat exposure.
Interestingly, protection can be seen for both HAPI and BHAPI even after 72 h of treatment with paraquat (see ESI). This result clearly demonstrates the ability of HAPI and BHAPI to protect paraquat-treated cells, which are significantly nutritionally challenged, for extended periods of time. This result is especially interesting given the fact that complete cell death is observed for unprotected cells within 48h.
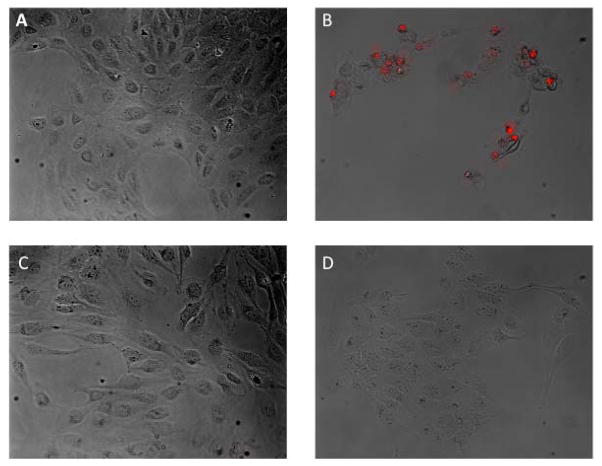
These results are further supported by an imaging experiment shown in Fig. 13 in which propidium iodide is used as a stain for cells with a compromised cellular membrane. The images show substantial propidium iodide staining in cells treated with paraquat only, but no observable staining for cells treated with paraquat and either HAPI or BHAPI. This further reinforces the conclusion that BHAPI and HAPI protect cells from oxidative cellular damage.
Fig. 13.
Overlay of brightfield and fluorescence images (propidium iodide) for untreated cells (a), cells treated with 10 mM paraquat (b), cells treated with paraquat and 100 μM BHAPI, and cells treated with paraquat and 100 μM HAPI. Images taken 48 h after paraquat exposure.
The increased oxidative stress in paraquat-treated cells and its reduction in response to treatment with HAPI or BHAPI was visualized using dichlorodihydrofluorescein diacetate (DCFH-DA), a nonfluorescent compound that becomes fluorescent after intracellular hydrolysis of the acetate groups and 2-electron oxidation to dichlorofluorescein.35 DCFH does not respond directly to ROS, but rather requires a catalyst like cytochrome c or a redox-active metal ion to become fluorescent in the presence of ROS, and is therefore useful as a redox indicator probe that responds to changes in intracellular iron.35 Cells treated for 24 h with paraquat prior to labeling with DCFH displayed noticeable fluorescence staining when imaged by fluorescence microscopy (see ESI). However, paraquat-treated cells that were co-treated with either HAPI or BHAPI did not show a fluorescence response to DCFH (see ESI). These results are consistent with the hypothesis that paraquat generates ROS and labilizes iron, and that the prochelator BHAPI can be converted under these conditions to HAPI, which chelates iron to prevent further oxidative stress.
2.6. Conversion of BHAPI in paraquat-stressed cells
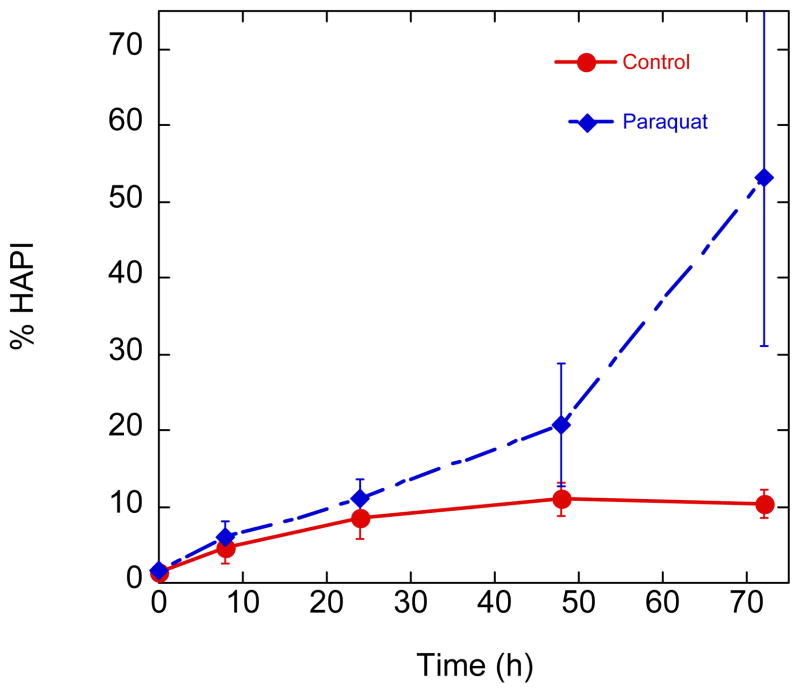
Having seen that BHAPI provides protection to cells treated with paraquat, we wished to investigate this system for evidence of BHAPI to HAPI conversion, which would allow metal chelation to be a plausible explanation for the protective effect. We therefore monitored, using HPLC-MS, the concentration of BHAPI and HAPI detectable in media of cells treated with BHAPI and paraquat or BHAPI only (Fig. 14). For cells not exposed to paraquat, a background level of HAPI was detected that never reached greater than 10% of the total detected HAPI/BHAPI combination. It should be noted that no HAPI was observed when 100 μM BHAPI was incubated in MEM with 10 mM paraquat but without cells. The amount of BHAPI converted to HAPI in paraquat-treated cells tracks similarly to the unexposed cells for the first 24 h, but then rises sharply, reaching 50% after 70 h. Interestingly, the time profile in Fig. 14 for HAPI conversion in paraquat-treated cells mirrors that shown in Fig. 11 for paraquat-induced cell death. These combined results imply that the mechanism of paraquat-induced cell death requires an incubation time (about 24 h in this case) before the level of ROS is sufficient either to cause death, or to convert BHAPI to HAPI. HAPI subsequently protects the cell from death, likely via iron chelation.
Fig. 14.
Time course of HAPI formation in control and paraquat (10 mM) stressed cells treated with BHAPI (100 μM).
2.7. Cellular iron status
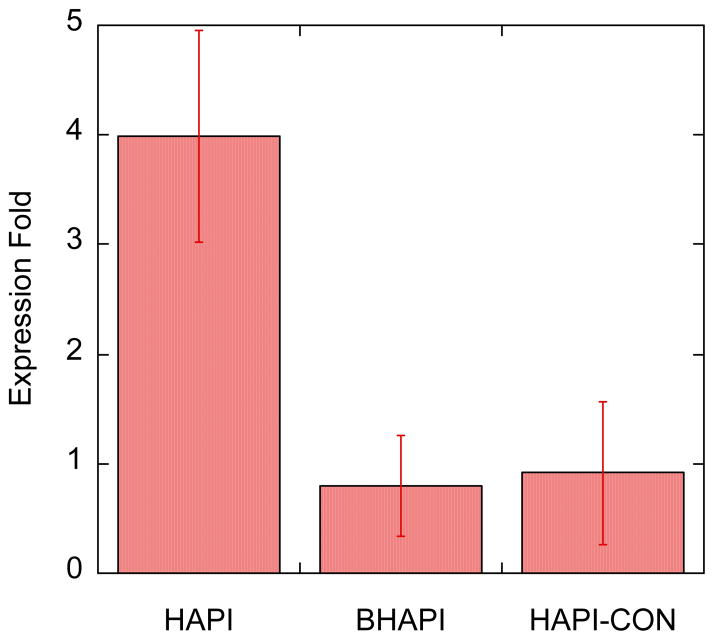
The concentration of cellular iron, especially the labile iron pool, is tightly regulated.36, 37 One of the points of regulation is the transferrin receptor (TfR), which is responsible for importing iron into the cell via receptor-mediated uptake of iron-loaded transferrin. The expression level of TfR is sensitive to cellular iron status, being upregulated in response to iron deficiency, and downregulated when iron levels are satiated. Consistent with this paradigm, the levels of TfR mRNA have been seen to increase in response to iron chelation.29, 37 We were therefore interested in determining the response in TfR mRNA levels in cells treated with 100 μM BHAPI, HAPI and HAPI-CON as a means of interrogating the differential iron sequestering capacity of the prochelator approach. We anticipated that treatment with a chelator (HAPI) would lead to iron deficiency in the cells and overexpression of the mRNA, whereas BHAPI would not. The results in Fig. 15 indeed show that treatment with HAPI results in a 4-fold increase in levels of TfR mRNA whereas BHAPI and HAPI-CON do not alter these levels significantly. These results are in line with changes in TfR mRNA levels observed in ARPE cells treated with SIH and its non-chelating control compound.29 Finally, these results support the claim that the diminished metal binding ability of the prochelator that is characterized in vitro translates to a minimal impact on the iron status of cells, which is in stark contrast to the more profound influence that a general metal chelator like HAPI has on the expression level of a key protein involved in cellular iron regulation.
Fig. 15.
Graph of expression fold of TFRC mRNA in cells treated with 100 μM HAPI, BHAPI and HAPI-CON
3. Conclusions
In conclusion we have prepared a later-generation prochelator derived from the stable aroyl hydrazone chelator HAPI. This prochelator BHAPI shows significantly reduced metal ion binding with respect to the chelator, transforms rapidly and efficiently into the chelator upon reaction with hydrogen peroxide, and protects cells against damage from reactive oxygen species, which are presented either directly as hydrogen peroxide, or indirectly as the redox-cycler paraquat. The prochelator does not perturb the iron status of treated cells unlike its chelator version. Importantly, this is the first time that an oxidant-triggered prochelator has been shown to be cytoprotective against an agent that promotes oxidative stress intracellularly, but is not itself an oxidant.
4. Experimental Section
4.1. General considerations
Unless otherwise noted, chemicals were purchased commercially (Sigma Aldrich) and used without further purification. BSIH and HAPI were synthesized by following previously published procedures.13, 16 NMR spectra were collected on a Varian Inova 400 or Varian Unity 500 spectrometer with chemical shifts reported in ppm and J values in Hz. Liquid chromatography/mass spectrometry (LC/MS) was performed using an Agilent 1100 Series apparatus with an LC/MSD trap and a Daly conversion dynode detector. A Varian Polaris C18 (150 × 1.0 mm) column was used and peaks were detected by UV absorption at 280 nm. A linear gradient from 15% B in A to 50% B in A was run from 2 to 12 min, then increased to 95% B in A over 4 min. The total run time was 22 min. A is water/2% MeCN/0.1 % formic acid and B is MeCN/2% water/0.1% formic acid. HRMS spectra were recorded on an Agilent G6224 LCMS-TOF system. Thin layer chromatography was performed on TLC sheets (silica gel 60 F254) from Merck (Darmstadt, Germany). Column chromatography was performed on silica gel (Silica gel 60) from Sigma Aldrich. HPLC analysis and purification was performed on a Waters 600 system using method 1 (Waters analytical XBridge column, 4.6 × 250 mm, 1 mL/min, with a 25-min gradient from 2–98 % B into A, where mobile phase B is acetonitrile and A is H2O or method 2 (semipreparative XBridge column, 19 × 250 mm, 20 mL/min 2–98 % B into A). UV-Vis spectra were recorded on a Varian Cary 50 spectrophotometer.
4.2. Synthesis
1. 1-(2-(4-(4,4,5,5-tetramethyl-1,3,2-dioxaborolan-2-yl)benzyloxy)phenyl)ethanone
A mixture of 2-hydroxyacetophenone (0.3 g, 2.2 mmol), 4-bromomethylphenylboronic acid pinacol ester (0.8 g, 2.7 mmol) and potassium carbonate (0.3 g, 2.2 mmol) in 5 mL DMF was heated to 110 °C for 24 h. An additional portion of 4-bromomethylphenylboronic acid pinacol ester (0.3 g, 1.0 mmol) was added and the reaction mixture was heated to 110 °C for another 24 h. The solvent was removed in vacuo. The crude product was purified by column chromatography on silica (CH2Cl2 with 4% MeOH) to give the desired product as an oil (0.51 g, 1.4 mmol, 64%). δH (CDCl3, 400 MHz): 1.24 (12H, s, CH3), 2.59 (3H, s, COCH3), 5.17 (2H, s, CH2), 6.98 (1H, dd, 3J = 9.2, 4J =1.6), 7.00 (1H, dd, 3J = 8.4, 4J = 0.8), 7.41 (1H, dd, 4J = 4), 7.43 (2H, d, 3J = 8.4), 7.74 (1H, dd, 3J = 7.6, 4J = 1.6), 7.83 (2H, d). δC (CDCl3, 125 MHz): 24.91 (CH3), 32.15 (COCH3), 70.62 (Cqart), 83.95 (CH2), 112.80 (CAr), 120.93 (CAr), 126.78 (CAr), 128.72 (CAr), 130.52 (CAr), 133.62 (CAr), 135.16 (CAr), 139.23 (CAr), 158.00 (CAr), 199.93 (CO). m/z (ES+) 391.1 [M + K]+ calc for C21H25BKO4 391.2.
2. N′-(1-(2-(4-(4,4,5,5-tetramethyl-1,3,2-dioxaborolan-2-yl)benzyloxy)phenyl)ethylidene)isonitotinohdrazide (BHAPI)
A mixture of 1-(2-(4-(4,4,5,5-tetramethyl-1,3,2-dioxaborolan-2-yl)benzyloxy)phenyl)ethanone (240 mg, 0.68 mmol) and isonicotinic hydrazide (93 mg, 0.68 mmol) was stirred under reflux in a mixture of toluene and DMF (9:1; 50 mL) for 32 h. The apparatus was equipped with a Dean-Stark adaptor for water removal from the reaction mixture. The solvent was removed in vacuo. The crude product was purified by column chromatography on silica and isolated as an yellowish solid (170 mg, 0.36 mmol, 53%). The product was isolated as a mixture of isomers. δH (DMSO, 400 MHz): 1.27 (24H, s, CH3), 2.28 (3H, s, COCH3), 2.32 (3H, s, COCH3), 5.19 (4H, s, CH2), 6.98–7.08 (2H, m), 7.15–7.28 (4H, m), 7.38–7.49 (8H, m), 7.62 (2H, d, 3J = 8.8), 7.70 (2H, d, 3J = 7.6), 7.78 (2H, d, 3J = 4.8), 8.61 (2H, d, 3J = 5.2), 8.74 (2H, d, 3J = 4.0). δC (DMSO, 125 MHz): 25.0, 25.1, 25.2, 25.3, 70.1, 84.2, 113.2, 120.9, 121.3, 122.2, 122.5, 127.6, 129.6, 129.9, 131.0, 135.0, 135.2, 140.7, 141.6, 150.5, 150.6, 156.6, 159.3, 162.9. HRMS (ES+) 471.2436 (C27H3110BN3O4 requires 471.2438) (MH+). UV/VIS (PBS pH 7.4) λmax/nm (ε/dm3 mol−1 cm−1) 270 (8,970).
N′-(1-(4-hydroxyphenyl)ethylidene)isonicotinohydrazide (HAPI-CON)
A mixture of 4-hydroxy acetophenone (200 mg, 1.5 mmol), isonicotinic hydrazide (200 mg, 1.5 mmol) and catalytic amount of acetic acid in 10 mL of EtOH was stirred at 90 °C for 3 h. The reaction mixture was allowed to cool and the precipitate formed was collected by vacuum filtration. The product was isolated as a yellowish solid (250 mg, 1.0 mmol, 67%). δH (DMSO, 400 MHz): 2.31 (3H, s, CH3), 6.81 (2H, d, 3J = 8.4), 7.72 (2H, d, 3J = 8.4), 7.90 (2H, d, 3J = 5.2), 8.75 (2H, d, 3J = 5.2), 9.86 (1H, s, OH), 10.92 (1H, s, NH). δC (DMSO, 100 MHz): 15.1 (CH3), 115.6 (CAr), 122.2 (CAr), 128.7 (CAr), 129.0 (CAr), 141.7 (CAr), 150.5 (CAr), 158.2 (CAr), 159.6 (CN), 162.5 (CO). HRMS (ES+) 256.1082 (C14H14N3O2 requires 256.1081) (MH+). UV/VIS (PBS pH 7.4) λmax/nm (ε/dm3 mol−1 cm−1) 305 (18,244).
3. N′-(1-(2-(3a,5,5-trimethylhexahydro-4,6-methanobenzo[d][1,3,2]dioxaborol-2-yl)phenyl)ethylidene)isonicotinohydrazide
A mixture of 2-acetylphenylboronic acid (1 g, 6.0 mmol) and (1R,2R,3S,5R)-(–)-pinanediol (1.2 g, 7 mmol) dissolved in toluene (60 mL) and DMF (6 mL) was heated to reflux in an apparatus equipped with a Dean-Stark adaptor for 6 h. Formation of the desired boronate ester was evidenced by ES-MS analysis. Isonicotinic hydrazide (0.85 g, 6.2 mmol) was added to the reaction mixture, which was heated to reflux for 24 h. The solvent was removed in vacuo and the residue was dissolved in 30 mL of warm CHCl3. The volume of the solution was reduced to half on a rotary evaporator, and addition of ether resulted in product precipitation. The product was isolated by vacuum filtration as a white solid (1.8 g, 4.3 mmol, 72%). δH (DMSO, 500 MHz): 0.80 (3H, s, CH3), 1.23 (3H, s, CH3), 1.31 (3H, s, CH3), 1.40 (1H, d, 3J = 10.0, CH), 1.82 (2H, m), 1.94 (1H, m), 2.14 (1H, m), 2.27 (1H, m), 2.40 (3H, s, CH3), 4.39 (1H, d, 3J = 8), 7.44–7.54 (3H, m), 7.67 (1H, d, 3J = 7.0), 7.80 (2H, d, 3J = 4.5), 8.77 (2H, d, 3J = 4.5), 11.26 (1H, s, NH). HRMS (ES+) 417.2339 (C24H2910BN3O3 requires 417.2333) (MH+).
4.3. BHAPI speciation
Stock solution of BHAPI (10 mM) was prepared in acetonitrile. Solutions of BHAPI (100 μM) in acetonitrile and water (1 % acetonitrile) were prepared by dilution of the stock solution. The composition of these solutions was investigated by HPLC on an analytical XBridge column running method 1.
4.4. Stability of BHAPI, HAPI and SIH
Stock solutions of BHAPI, HAPI and SIH (5 mM) in 50 mM aqueous NaOH were prepared and kept frozen at −18 °C until needed. BHAPI, HAPI and SIH solutions (100 μM) in MEM were prepared from the stocks. Caffeine was added to these solutions from a 10 mM stock solution in DMSO to achieve a final concentration of 100 μM. The pH of these solutions was adjusted to 7.4–7.8 using 0.2 M HCl. The solutions were incubated at 37 °C, and 100-μL aliquots were removed at 0, 2, 10, 24, and 48 h after the start of incubation, diluted with 300 μL of MeOH and analyzed by LC-MS.
4.5. Hydrogen peroxide triggered conversion of BHAPI to HAPI
Stock solutions of HAPI (33.3 mM) and BHAPI (20.5 mM) were prepared fresh in DMSO and diluted for experiments in PBS buffer, pH 7.4. The kinetics of BHAPI (85 μM) deprotection by H2O2 were investigated under pseudo first order conditions of 10–100 fold excess H2O2. The pseudo-first order rate constant (kobs) at each H2O2 concentration (1.0, 2.5, 5.0, 6.5, and 8.5 mM) was determined in triplicate from plots of Abs (at 408 nm) vs. time. Origin software was used to fit the data to equation 1, where A is Abs408, k is kobs, A1 is the difference of the initial minus Ainf, and Ainf is the absorbance at 408 at infinite reaction time. A plot of kobs vs. [H2O2] provides a linear plot where the slope is the second-order rate constant, k.
| Eq. 1 |
Stock solutions of BHAPI (10 mM) in DMSO and d6-DMSO were prepared for 1H NMR and HPLC investigations of the BHAPI reaction with H2O2. Reaction mixtures of 1 mM and 250 μM BHAPI in water/D2O with DMSO were prepared from this stock solution. The content of DMSO in the solvent mixture was 2.5 % and 20 % for the 250 μM and 1 mM reactions respectively. The reaction was initiated by addition of concentrated H2O2 to give a final concentration of 50 mM in each case.
Isolation of the products of the deprotection reaction was achieved by HPLC on an XBridge semi-preparative column using method 2.
4.6. Metal binding studies
Metal salt solutions of Cu2+ (as CuSO4 with two-fold excess glycine), Zn2+ (as ZnSO4), Fe3+ (as ferric ammonium citrate), or Fe2+ (as ferrous ammonium sulfate) were prepared fresh as 10 mM stock solutions in nanopure water. Solutions of 85 μM BHAPI/HAPI/HAPI-CON (5% DMSO in PBS, pH 7.4) were equilibrated for one hour with 1 or 0.5 equiv of a particular metal ion before UV-Vis spectra were recorded.
Solutions of calcein (2 μM) and calcein with ferric ammonium citrate (2 μM) in PBS (pH 7.4) were prepared. BHAPI, HAPI and HAPI-CON were added to the calcein iron complex solution from their 5 mM stock solutions in 50 mM NaOH to a final concentration of 4 μM. Calcein fluorescence from the mixtures was recorded on a Perkin Elmer Victor3 1420 plate reader.
4.7. Cell culture
All cell culture reagents, including minimal essential medium (MEM), Dulbecco’s modified eagle medium (DMEM), F12 Ham’s nutrient mix (F12), fetal bovine serum (FBS), pencillin–streptomycin (pen-strep), L-glutamine, and trypsin–EDTA were purchased from Gibco. The spontaneously immortalized human retinal pigment epithelial cell line ARPE-19 was purchased from American Type Culture Collection. The cells were grown in 1:1 DMEM and F12 medium with FBS (10%), pen-strep (1%), and glutamine (1%). Cells were cultured until confluent in 24-well Falcon plates. LDH Release Assay Kit was obtained from Roche Diagnostics and Cell Titer-Blue Cell Viability Assay from Promega. Cell viability assays were performed on a Perkin Elmer Victor3 1420 plate reader.
Stock solutions of BHAPI (5 mM) were prepared in 50 mM aqueous NaOH and stored at −20 °C. Working solutions were prepared by diluting the stock solution to 100 μM in MEM and adjusting the pH to 7.4–7.8 with dilute HCl. Solutions of lower concentration were prepared by further dilution in MEM.
For cytoprotection assays, the growth medium was removed when cells reached confluence, then they were washed three times with MEM and treated with BHAPI at final concentrations ranging from 0–100 μM in MEM. Cells were incubated for 5 h prior to addition of H2O2 (200 μM final concentration) or paraquat (10 mM final concentration). The cells were incubated further for 19 h (in the H2O2 case) or 12–48 h (for paraquat case) before viability was determined by the CellTiter-Blue Cell Viability Assay (cell life assay) and/or LDH release assay (cell death assay). The conditions compared in each experiment were: positive control (cells treated only with MEM), negative control (cells treated with MEM containing H2O2 or paraquat) and cells treated with a range of BHAPI concentrations and H2O2 (or paraquat). Each condition was run in triplicate and variability was determined as the standard deviation of the results.
4.8. Cell Imaging
Live cell images were taken on a Zeiss Axio Observer widefield fluorescence microscope under 20× magnification using a Plan Neofluar objective lens. Filter sets for green part of visible spectrum (FS38HE: BP470/40, FT495, BP525/50), and red part of visible spectrum (FS43HE: BP550/25, FT570, BP605/70) were used to collect fluorescence emission data.
Phase contrast and fluorescence imaging with propidium iodide was performed with cells treated with 10 mM paraquat for 48 h. Propidium iodide stains nuclei of cells with compromised integrity of their cell walls, thus providing visualization for dying cells. Cells were grown to 70 % confluence on a 12-well plate with a glass window (MatTek) and treated as described above for the paraquat experiment. Propidium idodide (7.5 μM) was added to the medium after 48 h and allowed to incubate for 30 min. The medium was drained, cells were washed three times with PBS, and fresh MEM was added for the imaging experiment. Cells with no treatment, paraquat treatment, and paraquat with BHAPI, HAPI or HAPI-CON treatment were visualized.
Imaging with 5-(and-6)-carboxy-2′,7′-dichlorodihydrofluorescein diacetate was carried out on cells grown to 70 % confluence on a 12-well plate with a glass window (MatTek) and treated as described above for paraquat treatment. The cells were incubated for 24 h and a DMSO solution of 5-(and-6)-carboxy-2′,7′-dichlorodihydrofluorescein diacetate (10 mM) was added to achieve a final concentration of 10 μM. The cells were incubated further for 1 h, washed twice with fresh PBS, placed in solutions corresponding to the initial experimental conditions, incubated for 2 h, and imaged. Cells with no treatment, paraquat treatment, and paraquat with BHAPI or HAPI treatment were visualized.
4.9. Conversion of BHAPI to HAPI in cells treated with paraquat
ARPE-19 cells were grown to confluence in 6-well plates and treated with BHAPI (100 μM) as described above. Conversion of BHAPI to HAPI was monitored for control cells and paraquat (10 mM) treated cells. Samples for HPLC-MS analysis were prepared by diluting 100 μl of cell media with 300 μl of MeOH. Areas of chromatographic peaks for BHAPI and HAPI were determined. The content of HAPI in the mixture was quantified as the percentage of the area of its peak in the summed area of peaks of HAPI and BHAPI.
4.10. Effect of BHAPI, HAPI and HAPI-CON on cellular iron status
ARPE cells were grown to confluence in 6-well plates and treated with BHAPI, HAPI and HAPI-CON (100 μM) for 3 h. Cells were washed 3 times with PBS and 300 μL RNALater (Qiagen) was added to each well. Total RNA was isolated using RNeasy Mini Kit (Qiagen) using manufactures instructions. The concentration of total isolated RNA was evaluated using a Nanodrop spectrometer. cDNA was synthesized from the isolated total RNA using SuperScript System (Invitrogen) using manufactures instructions. cDNA content was measured on a Nanodrop spectrometer. The cDNA solution was diluted to 10 ng/μL and stored at −20 °C. The real time PCR experiment was done with SsoFast EvaGreen Supermix kit from Bio-Rad using manufactures instructions. RT PCR measurement was performed on a BIO-RAD MiniOpticon instrument. The difference of expression levels from untreated cells was expressed using the ΔΔCt values.
Supplementary Material
Acknowledgments
We thank the National Institutes of Health (grant GM084176), the Sloan Foundation, and the Camille and Henry Dreyfus Foundation for supporting this work. We thank Dr. Paloma Liton and Dr. Jeyabalan Nallathambi of the Duke Eye Center for providing instruments and expertise for performing the qPCR experiment. We also thank Dr. George Dubay for measuring high-resolution mass spectra, which were obtained on an instrument funded by NSF Grant: Award Number: 0923097. We also thank the Duke LMCF for the use of the fluorescence microscopes (grant 1S10RR027528-01).
Footnotes
Electronic Supplementary Information (ESI) containing additional spectroscopic and cellular data is available.
References
- 1.Kell D. Arch Toxicol. 2010;84:825–889. doi: 10.1007/s00204-010-0577-x. [DOI] [PMC free article] [PubMed] [Google Scholar]
- 2.Zatta P, Drago D, Bolognin S, Sensi SL. Trends Pharmacol Sci. 2009;30:346–355. doi: 10.1016/j.tips.2009.05.002. [DOI] [PubMed] [Google Scholar]
- 3.Duce JA, Bush AI. Prog Neurobiol. 2010;92:1–18. doi: 10.1016/j.pneurobio.2010.04.003. [DOI] [PubMed] [Google Scholar]
- 4.Zecca L, Youdim MBH, Riederer P, Connor JR, Crichton RR. Nat Rev Neurosci. 2004;5:863–873. doi: 10.1038/nrn1537. [DOI] [PubMed] [Google Scholar]
- 5.Zhou T, Ma Y, Kong X, Hider RC. Dalton Trans. 2012 doi: 10.1039/c2dt12159j. [DOI] [PubMed] [Google Scholar]
- 6.Delangle P, Mintz E. Dalton Trans. 2012 doi: 10.1039/c2dt12188c. [DOI] [PubMed] [Google Scholar]
- 7.Dunaief JL. Invest Ophthalmol Vis Sci. 2006;47:4660–4664. doi: 10.1167/iovs.06-0568. [DOI] [PubMed] [Google Scholar]
- 8.Rodríguez-Rodríguez C, Telpoukhovskaia M, Orvig C. Coord Chem Rev [Google Scholar]
- 9.Perez LR, Franz KJ. Dalton Trans. 2010;39:2177–2187. doi: 10.1039/b919237a. [DOI] [PMC free article] [PubMed] [Google Scholar]
- 10.Dunford HB. Coord Chem Rev. 2002;233:311–318. [Google Scholar]
- 11.Pierre JL, Fontecave M. Biometals. 1999;12:195–199. doi: 10.1023/a:1009252919854. [DOI] [PubMed] [Google Scholar]
- 12.Simunek T, Boer C, Bouwman RA, Vlasblom R, Versteilen AMG, Sterba M, Gersl V, Hrdina R, Ponka P, de Lange JJ, Paulus WJ, Musters RJP. J Mol Cell Cardiol. 2005;39:345–354. doi: 10.1016/j.yjmcc.2005.05.008. [DOI] [PubMed] [Google Scholar]
- 13.Charkoudian LK, Pham DM, Franz KJ. J Am Chem Soc. 2006;128:12424–12425. doi: 10.1021/ja064806w. [DOI] [PubMed] [Google Scholar]
- 14.Charkoudian LK, Pham DM, Kwon AM, Vangeloff AD, Franz KJ. Dalton Trans. 2007:5031–5042. doi: 10.1039/b705199a. [DOI] [PubMed] [Google Scholar]
- 15.Charkoudian LK, Dentchev T, Lukinova N, Wolkow N, Dunaief JL, Franz KJ. J Inorg Biochem. 2008;102:2130–2135. doi: 10.1016/j.jinorgbio.2008.08.001. [DOI] [PMC free article] [PubMed] [Google Scholar]
- 16.Hruskova K, Kovarikova P, Bendova P, Haskova P, Mackova E, Stariat J, Vavrova A, Vavrova K, Simunek T. Chem Res Toxicol. 2011;24:290–302. doi: 10.1021/tx100359t. [DOI] [PubMed] [Google Scholar]
- 17.Major-Jourden J, Cohen S. Angew Chem Int Ed. 2010;49:6795–6797. doi: 10.1002/anie.201003819. [DOI] [PMC free article] [PubMed] [Google Scholar]
- 18.Sun J, Perfetti MT, Santos WL. J Org Chem. 2011;76:3571–3575. doi: 10.1021/jo200250y. [DOI] [PMC free article] [PubMed] [Google Scholar]
- 19.Yan J, Jin S, Wang B. Tetrahedron Lett. 2005;46:8503–8505. [Google Scholar]
- 20.Yan J, Springsteen G, Deeter S, Wang BH. Tetrahedron. 2004;60:11205–11209. [Google Scholar]
- 21.Buss JL, Ponka P. Biochim Biophys Acta. 2003;1619:177–186. doi: 10.1016/s0304-4165(02)00478-6. [DOI] [PubMed] [Google Scholar]
- 22.Hagen H, Marzenell P, Jentzsch E, Wenz F, Veldwijk MR, Mokhir A. J Med Chem. 2012;55:924–34. doi: 10.1021/jm2014937. [DOI] [PubMed] [Google Scholar]
- 23.Hulsman N, Medema JP, Bos C, Jongejan A, Leurs R, Smit MJ, de Esch IJ, Richel D, Wijtmans M. J Med Chem. 2007;50:2424–31. doi: 10.1021/jm061371e. [DOI] [PubMed] [Google Scholar]
- 24.Sikora A, Zielonka J, Lopez M, Dybala-Defratyka A, Joseph J, Marcinek A, Kalyanaraman B. Chem Res Toxicol. 2011;24:687–697. doi: 10.1021/tx100439a. [DOI] [PMC free article] [PubMed] [Google Scholar]
- 25.Sikora A, Zielonka J, Lopez M, Joseph J, Kalyanaraman B. Free Radical Biology and Medicine. 2009;47:1401–1407. doi: 10.1016/j.freeradbiomed.2009.08.006. [DOI] [PMC free article] [PubMed] [Google Scholar]
- 26.Kapor A, Ribar B, Leovac VM, Argay G, Kalman A, Chundak SY. J Coord Chem. 1996;38:139–144. [Google Scholar]
- 27.Swamy KMK, Ko S, Kwon SK, Lee HN, Mao C, Kim J, Lee K, Kim J, Shin I, Yoon J. Chem Commun. 2008;45:5915–5917. doi: 10.1039/b814167c. [DOI] [PubMed] [Google Scholar]
- 28.Hadziahmetovic M, Song Y, Wolkow N, Iacovelli J, Grieco S, Lee J, Lyubarsky A, Pratico D, Connelly J, Spino M, Harris ZL, Dunaief JL. Invest Ophthalmol Vis Sci. 2011;52:959–968. doi: 10.1167/iovs.10-6207. [DOI] [PMC free article] [PubMed] [Google Scholar]
- 29.Lukinova N, Iacovelli J, Dentchev T, Wolkow N, Hunter A, Amado D, Ying GS, Sparrow JR, Dunaief JL. Invest Ophthalmol Vis Sci. 2009;50:1440–1447. doi: 10.1167/iovs.08-2545. [DOI] [PMC free article] [PubMed] [Google Scholar]
- 30.Bendova P, Mackova E, Haskova P, Vavrova A, Jirkovsky E, Sterba M, Popelova O, Kalinowski DS, Kovarikova P, Vavrova K, Richardson DR, Simunek T. Chem Res Toxicol. 2010;23:1105–1114. doi: 10.1021/tx100125t. [DOI] [PubMed] [Google Scholar]
- 31.Patel M, Cantu D, Fulton RE, Drechsel DA. J Neurochem. 2011;118:79–92. doi: 10.1111/j.1471-4159.2011.07290.x. [DOI] [PMC free article] [PubMed] [Google Scholar]
- 32.Patel M, Drechsel DA. Toxicol Sci. 2009;112:427–434. doi: 10.1093/toxsci/kfp223. [DOI] [PMC free article] [PubMed] [Google Scholar]
- 33.Ayaki H, Lee MJ, Sumino K, Nishio H. Toxicol. 2005;208:73–79. doi: 10.1016/j.tox.2004.11.008. [DOI] [PubMed] [Google Scholar]
- 34.Vanderwal NAA, Smith LL, Vanoirschot JFLM, Vanasbeck BS. Am Rev Respir Dis. 1992;145:180–186. doi: 10.1164/ajrccm/145.1.180. [DOI] [PubMed] [Google Scholar]
- 35.Kalyanaraman B, Darley-Usmar V, Davies KJ, Dennery PA, Forman HJ, Grisham MB, Mann GE, Moore K, Roberts LJ, 2nd, Ischiropoulos H. Free Radical Biol Med. 2012;52:1–6. doi: 10.1016/j.freeradbiomed.2011.09.030. [DOI] [PMC free article] [PubMed] [Google Scholar]
- 36.Munoz M, Garcia-Erce JA, Remacha AF. J Clin Pathol. 2011;64:281–286. doi: 10.1136/jcp.2010.079046. [DOI] [PubMed] [Google Scholar]
- 37.Rouault T, Klausner R. Curr Top Cell Reg. 1997;35:1–19. doi: 10.1016/s0070-2137(97)80001-5. [DOI] [PubMed] [Google Scholar]
Associated Data
This section collects any data citations, data availability statements, or supplementary materials included in this article.


