Abstract
The specific recognition between monoclonal antibody (anti-human prostate-specific antigen, anti-hPSA) and its antigen (human prostate-specific antigen, hPSA) has promising applications in prostate cancer diagnostics and other biosensor applications. However, because of steric constraints associated with interfacial packing and molecular orientations, the binding efficiency is often very low. In this study, spectroscopic ellipsometry and neutron reflection have been used to investigate how solution pH, salt concentration and surface chemistry affect antibody adsorption and subsequent antigen binding. The adsorbed amount of antibody was found to vary with pH and the maximum adsorption occurred between pH 5 and 6, close to the isoelectric point of the antibody. By contrast, the highest antigen binding efficiency occurred close to the neutral pH. Increasing the ionic strength reduced antibody adsorbed amount at the silica–water interface but had little effect on antigen binding. Further studies of antibody adsorption on hydrophobic C8 (octyltrimethoxysilane) surface and chemical attachment of antibody on (3-mercaptopropyl)trimethoxysilane/4-maleimidobutyric acid N-hydroxysuccinimide ester-modified surface have also been undertaken. It was found that on all surfaces studied, the antibody predominantly adopted the ‘flat on’ orientation, and antigen-binding capabilities were comparable. The results indicate that antibody immobilization via appropriate physical adsorption can replace elaborate interfacial molecular engineering involving complex covalent attachments.
Keywords: biointerface, interfacial binding, antibody binding, antigen recognition, neutron reflection, antibody conformation
1. Introduction
The specific recognition between antibody and antigen has been widely used for biomedical and biotechnological applications such as cancer diagnostics, pregnancy tests and immunoassays. The detection of antigens relies on the bioactivities or binding efficiencies of the antibodies that have been pre-immobilized on a support surface. However, in most cases, the binding efficiencies of the antigens to surface-immobilized antibodies are very low. Although each antibody molecule has two antigen binding fragments (Fabs) and can theoretically bind two antigens, the typical binding ratio is only 0.1 or even less in most practical situations. This is in contrast to the typical binding ratio of 0.1 or even less in most practical situations. The low interfacial-binding efficiency arises mainly from the steric hindrance and improper orientation of the antibodies upon immobilization onto substrates [1]. Much effort has therefore been devoted to studying the interfacial orientation of the antibodies at different support interfaces aiming at improving antigen-binding efficiency.
An antibody is a Y-shaped molecule with two Fabs and a crystallizable fragment (Fc). Its crystalline structure has approximate dimensions of 142 Å × 85 Å × 38 Å [2]. Because of the delicate location of the antigen-binding site located in the two variable domains in each Fab fragment, the interfacial orientation of the antibody on the support interface hugely affects the site accessibility. Surface charge and hydrophobicity can be used to tune antibody orientation. The preferred orientation is called ‘end on’, with Fc attached to the support surface and the two Fabs extended into the solution. This orientation allows the easiest access of antigen molecules to the binding sites from the solution side. However, in many cases, the real situation is a combination of different orientations with the ‘flat on’ orientation dominant (all three fragments attached to the support) [1,3–6].
In addition to the studies of effects of different surface properties, many elaborate approaches such as chemical bonding, proteins G and A support, polymer coating and calixcrown linkers have been used to control antibody immobilization so that antigen binding can be improved [7–18]. For example, Karyakin et al. [19] immobilized antibodies onto gold surfaces via different thiol groups. They also split the antibody into two half-immunoglobulin G (IgG) fragments without destroying the binding sites. The half-IgG fragments were then immobilized on gold surfaces by simple adsorption. The antigen-binding capacities of the half-IgG-modified gold surfaces were found to be much higher than those obtained from non-specifically adsorbed IgGs. In another example, Lowe et al. [20] covalently immobilized antibenzodiazepine antibodies onto porous silicon surfaces via isocyanate chemistry. Fast-response and selective mass spectrometric detection of illicit drugs (benzodiazepines) on a porous silicon surface was achieved. Meanwhile, genetically engineered recombinant antibody fragments have also been fabricated [21]. These molecules contained only two fragments, one specifically bound to gold and the other to the target molecule. Surface plasmon resonance analysis demonstrated that the gold-binding fragments have a high affinity to gold surfaces and resulted in over 70 per cent of the biospecific antibody fragments immobilized with higher active target-binding efficiencies than those from conventional immobilization methods. Recently, Tajima et al. [14] demonstrated that antibodies immobilized through the staphylococcal protein A that had been pre-immobilized on the well-defined phospholipid polymer surfaces prepared on silicon substrate had a binding ratio over 0.8.
Although these elaborate antibody immobilization approaches can achieve relatively higher antigen-binding efficiencies, most of them need complicated molecular engineering or dedicated laboratory skills, making them limited for widespread, fast and cost-effective applications [8]. The current industry prefers to use either direct printing or solution adsorption as efficient means for antibody immobilization. Therefore, it is of both fundamental and practical significance to explore interfacial molecular orientations of physically adsorbed antibodies and their antigen-binding activities.
In the past few years, we have devoted extensive effort to study antibody adsorption and subsequent antigen binding. Silicon oxide–water interface has been extensively used to facilitate three key techniques: spectroscopic ellipsometry (SE), atomic force microscopy and neutron reflection (NR). These studies together have led to useful insights into interfacial orientations of different antibodies [1,4–6,22,23]. Under almost all conditions studied, surface-parking density of antibody molecules has a significant effect on the subsequent antigen binding owing to the steric effect. Optimal antigen binding can be adjusted by regulating the solution concentration and adsorption time of the antibody. However, the precise control of antibody immobilization to meet the need in a real application requires a systematic evaluation of the effects of common physiochemical parameters such as solution pH, salt type and ionic strength. In this paper, SE and NR have been combined to investigate the effects of solution environment and surface chemistry on the interfacial immobilization of prostate-specific antigen (PSA) antibody (mouse monoclonal anti-human prostate-specific antigen, anti-hPSA) at the solid–water interface and the subsequent in situ antigen binding. These findings will extend our understanding of the antibody behaviour at interface in different physiological conditions. This part of the study is particularly relevant for developing PSA biosensors towards real biomedical applications.
2. Experimental section
2.1. Materials
Silicon 〈111〉 wafers were purchased from Compact Technology Ltd., and were cut into 12 mm × 12 mm pieces for ellipsometric measurements. The phosphate buffers were made from Na2HPO4 and NaH2PO4 (Sigma, UK) with total ionic strength fixed at 20 mM and pH variations from 4 to 8. The solutions with high ionic strength were obtained by the addition of NaCl (Sigma-Aldrich). Decon90 solution was from Decon Laboratories Limited, East Sussex, UK. The mouse monoclonal antibody anti-hPSA (Clone: 214) and native hPSA were purchased from AbD Serotec, Oxford, UK. The concentrations of the antibody and antigen were determined by ultraviolet at A280 using the coefficients of 1.4 for the antibody and 1.84 for the antigen [24]. Bovine serum albumin (BSA), octyltrimethoxysilane (C8), (3-mercaptopropyl)trimethoxysilane (MTS), 4-maleimidobutyric acid N-hydroxysuccinimide ester (GMBS), toluene, ethanol, sulphuric acid and hydrogen peroxide were purchased from Sigma-Aldrich, UK.
2.2. Hydrophobic surface modification
Silicon wafers (12 mm × 12 mm) or blocks (6 cm × 5 cm × 1.2 cm) were cleaned by Piranha treatment (H2SO4 (97.5%): H2O2 (35%) = 10 : 1, 90°C for 1 min) followed by 5% (v/v) Decon90 wash, rinsed with plenty of ultra-high-quality (UHQ) water and dried. The silicon dioxide layer thickness was found to be 12 ± 2 Å as determined by ellipsometry. The hydrophobic C8 surfaces were produced by immersing overnight the silicon wafers or blocks into 100 mM octyltrimethoxysilane in chloroform. The wafers or blocks were then rinsed by ethanol and dried, followed by annealing at 150°C overnight in a vacuum oven [25]. The coated surfaces were then rinsed with ethanol and UHQ water and were stored dry for subsequent use.
2.3. Covalent attachment of antibodies
Clean wafers or blocks with oxide layer thickness of 12 ± 2 Å were placed overnight in sealed glass containers containing 4% (v/v) of MTS in toluene. The samples were then rinsed with ethanol, dried and placed overnight in sealed glass containers containing 2 mM GMBS in ethanol. The MTS + GMBS-coated samples were removed from the GMBS solution and then rinsed with ethanol and stored dry for subsequent use. All surface modification steps were performed at room temperature. Antibody solution (10 mg l–1) was incubated with the modified surface for 1 h followed by a buffer wash.
2.4. Spectroscopic ellipsometry
The principle of ellipsometric measurements has been described in our previous work [25,26]. Silicon wafers (12 mm × 12 mm) were used in the ellipsometric cell (containing 1 ml sample) fitted with a pair of fused quartz windows [27] specially designed for solid–liquid interface measurements. The incoming and exiting beams were at 70° to the surface normal, and the windows were aligned to be perpendicular to the two beams. Wafers were cleaned and the thickness of the oxide layers were determined as described already. Ellipsometric measurements of interfacial adsorption of the antibody, BSA blocking and antigen binding were carried out by using a Jobin-Yvon UVISEL spectroscopic ellipsometer, with wavelength ranging between 300 and 600 nm. Data were analysed using software DeltaPsi II developed by Jobin-Yvon Ltd. The surface-adsorbed amount Γ (mg m–2) of the sample is finally calculated from nf and τf (in ångström) through equation (2.1) [28,29]:
 |
2.1 |
where nf and τf are the measured layer refractive index and thickness, n0 is the refractive index of the buffer, dn/dc stands for the change of refractive index against solution concentration and a value of 0.18 ml g–1 was used in this work.
2.5. Neutron reflection
NR measurements were carried out on the SURF reflectometer at ISIS Neutron Facility, Rutherford Appleton Laboratory (RAL), Oxford, UK using neutron wavelength ranging from 0.5 to 6.5 Å. A 3 ml sample was filled into a cell made by clamping a Perspex trough against the polished face of a silicon 〈111〉 block with dimensions of 6 cm × 5 cm × 1.2 cm. The sample cell was mounted on a goniometer stage controlled by computers. The neutron beam was defined by two sets of horizontal and vertical slits placed before the sample cell, providing a typical beam illuminating an area around 4 cm × 3 cm on the centre of the polished surface. The neutron beam entering the small face of the silicon block was reflected from the solid–solution interface, exited from the opposite end of the small face and collected by the detector. Each reflectivity was carried out at three incidence angles of 0.35°, 0.8° and 1.8°, and the resulting reflectivity profiles were combined to cover a wavevector (Q) ranging between 0.012 and 0.5 Å−1. Reflectivity profiles below the critical angle were theoretically equal to unity, and all the data measured were scaled accordingly. Constant background was subtracted using the average reflectivity between 0.3 and 0.5 Å−1. The background was found to be typically around 3 × 10⁻⁶ in D2O. The software called Datafit using the kinematic approximation as outlined in the previous review papers has been used to analyse reflectivity profiles by means of partial structure factors [22,23,30,31]. Fitting was initiated with a uniform layer followed by adding additional layers until a satisfactory fit was obtained.
3. Results and discussion
3.1. Solution pH affects both antibody adsorption and antigen binding
We started this work by examining how the interfacial adsorption of the antibody and antigen binding occurred with time and concentration at the silica–buffer interface [6]. It was found that the interfacial adsorption of the mouse monoclonal antibody (anti-hPSA) were both time- and concentration-dependent, which is common to the general adsorption behaviour of other proteins. The molecular orientation at the substrate surface is also in good agreement with our previous studies using other antibodies [1,5]. Over the low concentration range, the time-dependent interfacial process was slow. However, adsorption became faster as antibody concentration increased. Over all the concentrations studied, adsorption reached a plateau within about 1 h. Hence, all the adsorbed amounts quoted refer to the values at 1 h adsorption.
Solution pH could also affect antibody adsorption [1,5]. Figure 1 shows the time-dependent adsorption of anti-PSA antibody at the silica–buffer interface at pH 4, 6 and 8, with antibody concentration and ionic strength fixed at 10 mg l–1 and 20 mM, respectively. It can be seen that adsorption reached an equilibrium state in about 40 min at pH 4, while at the two other pH values, it took almost 1 h. Figure 2 shows the changes in adsorbed amount against pH after 1 h adsorption. Clearly, pH affects both dynamic adsorption and the equilibrated adsorbed amount. The adsorption maximum occurred around pH 5.5–6, close to the isoelectric point (pI) of the anti-hPSA. Buijs et al. [32] have studied the adsorption of two monoclonal IgGs (IgG 1B, pI = 5.8 and IgG 2A, pI = 6.9) on silica surfaces at different pH values. They also found adsorption maxima around the isoelectric points of the antibodies. The adsorbed amount of IgG 1B at pH 4 is less than that at pH 6 but more than that at pH 8. These findings are highly consistent with our results.
Figure 1.
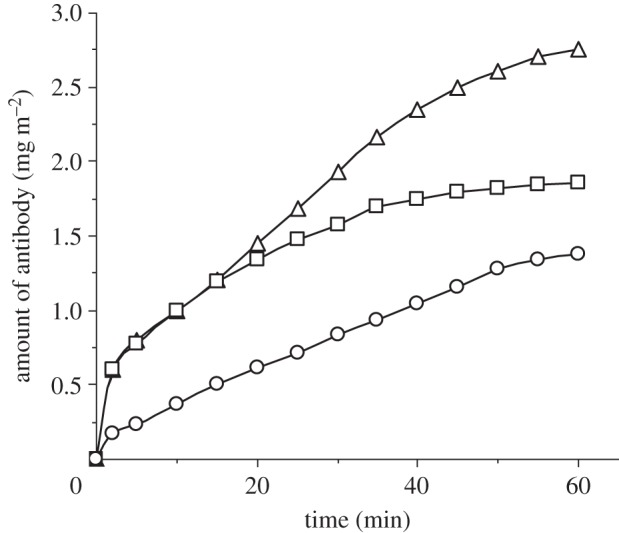
Time-dependent adsorption of the anti-hPSA antibody (10 mg l–1, I = 20 mM) at pH 4 (open squares), 6 (open triangles) and 8 (open circles).
Figure 2.
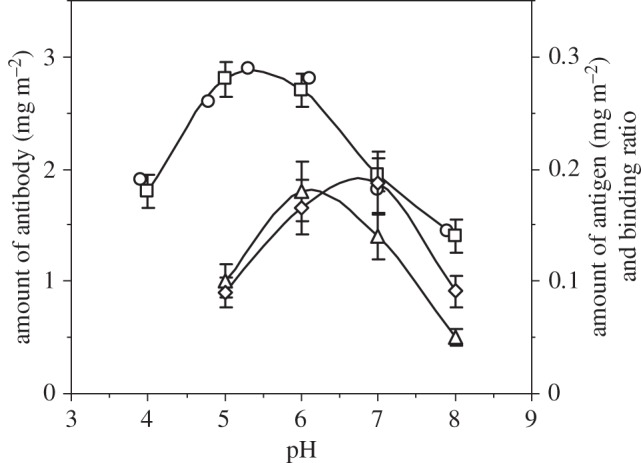
Surface-adsorbed amount of antibody (left axis) obtained from ellipsometry (open squares) and NR (open circles), antigen binding amount (open triangles, right axis) and binding ratio (open diamonds, right axis) at different pH (ionic strength fixed at 20 mM) values. In each case, the amount of antibody adsorbed was taken at 1 h after the adsorption started. Lines are drawn for eye guidance.
The reversibility of adsorption serves as a useful indication of the extent of interaction of antibodies with substrate surfaces. The adsorption started at pH 4, and then the antibody solution was removed and replaced by the antibody solution at pH 6, followed by washing with a pH 6 buffer. The amount of the adsorbed antibody increased to the same level as that started initially by an antibody solution at pH 6. The solution was then replaced by a pH 4 buffer, followed by a pH 4 antibody solution. Desorption was observed, and the amount of the adsorbed antibody reduced to the previous level at pH 4, showing that the adsorption was entirely reproducible under the experimental conditions. These results are highly consistent with our previous investigations of anti-human chorionic gonadotropin (anti-hCG) systems, in which the solution pH was changed from 4 to 8, then brought back to 4 again [5]. In these cases, the changes in the antibody amount at the interface arose from the variations of the charges on proteins and surfaces in response to pH alterations.
Interfacial structural conformations of the anti-hPSA antibody layers adsorbed at different solution pH have been investigated by NR, with the reflectivity data shown in figure 3 and fitted parameters listed in table 1. NR is sensitive to the thickness and composition of the protein layer and has been widely used for studying biomolecular assembly at the solid–water interface [1,4–6,23,25,26,33–35]. Before each measurement, the thickness of the silicon oxide was determined and was all found to be around 12 ± 2 Å. No roughness was required to fit the layer, indicating a high degree of surface smoothness. Data fitting was initiated with a uniform layer, followed by adding additional layers until a satisfied fit with clear physical meaning was obtained. The use of two or more layers was to incorporate the changing volume fraction along the surface normal. At pH 7.9, a single layer model was appropriate for producing good fit to the adsorbed antibody layer with the thickness of 55 ± 2 Å and scattering length density (SLD, ρ) of 5.8 × 10⁻⁶ Å−2. The molecular volume fraction (φ) in the layer can be obtained through equation (3.1) below:
| 3.1 |
where ρ, ρp and ρw are the SLDs for the layer, the antibody (3.4 × 10⁻⁶ Å−2 for anti-hPSA antibody in D2O) and the water (6.35 × 10⁻⁶ Å−2 for D2O), respectively. The labile hydrogens in these proteins were assumed to be fully exchangeable with the solvent. Area per molecule (A) can be expressed as
 |
3.2 |
where Vp is the volume of the protein. The surface-adsorbed amount Γ (in mg m–2) can be obtained from
| 3.3 |
where MW is the molecular weight of the protein in g mol−1 and A is in Å2.
Figure 3.
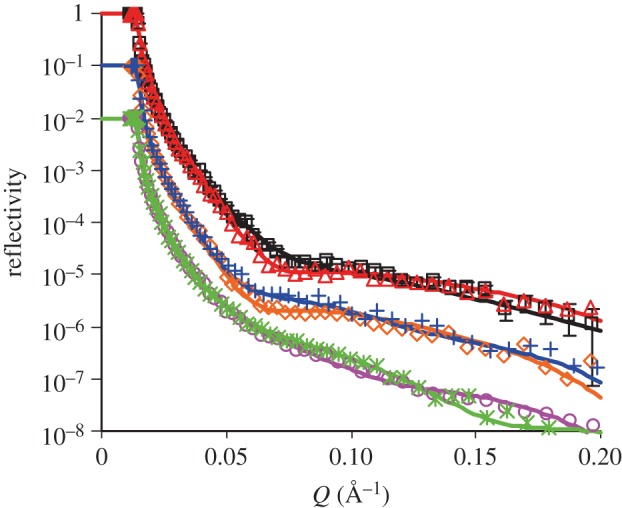
Adsorption of anti-hPSA antibody (10 mg l–1) at pH 3.9 (open squares), 4.8 (open triangles), 5.3 (open diamonds), 6.1 (plus symbols), 7 (open circles) and 7.9 (cross symbols) at the SiO2–buffer interface after 1 h equilibration, followed by a buffer wash. The ionic strength of the buffer was fixed at 20 mM. The solid lines are the best fits, while the symbols are the measured data. Some data have been shifted down 1–2 magnitudes along the vertical axis for clarity. Error bars are shown only for the pH 3.9 data. The level of experimental errors was similar between different reflectivity profiles shown. Parameters obtained by data fitting are shown in table 1. (Online version in colour.)
Table 1.
Structural parameters of the anti-hPSA antibody layer at the SiO2–buffer interface at different pH values (ionic strength at 20 mM). (τ is the thickness of the layer, ρ is the scattering length density, φ is the volume fraction, A is the area per molecule and the Γ is the interfacially adsorbed amount.)
| pH | τ ± 2 (Å) | (ρ ± 0.05) ×10−6 (Å−2) | φ (±2%) | A ± 300 (Å2) | Γ ± 0.2 (mg m−2) |
|---|---|---|---|---|---|
| 3.9 | 8 | 5.6 | 25.4 | 13 060 | 1.91 |
| 25 | 5.2 | 39.0 | |||
| 20 | 6.1 | 8.5 | |||
| 4.8 | 9 | 5.6 | 25.4 | 9570 | 2.6 |
| 25 | 4.7 | 55.9 | |||
| 25 | 6.1 | 8.5 | |||
| 5.3 | 10 | 5.6 | 25.4 | 8620 | 2.9 |
| 30 | 4.8 | 52.5 | |||
| 25 | 6.1 | 8.5 | |||
| 6.1 | 12 | 5.6 | 25.4 | 8940 | 2.8 |
| 28 | 5.0 | 45.8 | |||
| 25 | 5.9 | 15.3 | |||
| 7.0 | 12 | 5.7 | 22.0 | 13 740 | 1.81 |
| 25 | 5.5 | 28.8 | |||
| 35 | 6.1 | 8.5 | |||
| 7.9 | 55 | 5.8 | 18.6 | 17 160 | 1.45 |
The volume fraction of the antibody adsorbed in the layer was mostly under 20 per cent, with the rest of the layer filled with water. The area per molecule was about 17 000 Å2 and was bigger than the footprint of the flat-on antibody (approx. 12 000 Å2). These structural details together suggest that the antibodies stayed predominantly flat-on at the interface and that the entire layer was loose. This is consistent with the strong repulsive interactions between antibody molecules and the weak interactions between antibodies and substrate surface at high pH.
At all other pH values studied, the structure of antibody layers must be described by a minimum of three layers owing to the structural inhomogeneity along the surface normal direction. At pH 3.9, the thickness for the inner layer on the oxide surface is 8 Å, that for the middle layer is 25 Å and that for the outer layer on the solution side is 20 Å, and their corresponding SLDs are 5.6 × 10⁻⁶, 5.2 × 10⁻⁶ and 6.1 × 10⁻⁶ Å−2. The antibody occupied 25 per cent in the inner layer, 40 per cent in the middle layer and only 8 per cent in the outer layer. Thus, water fills most of the space, and the outer layer is predominantly water. In comparison with the structural features at pH 8, the total layer thicknesses are close, but an increase in surface-adsorbed amount increases the packing in the middle of the layer, with a very diffuse region on the outer surface.
Upon pH increase from 3.9 to 4.8, the thicknesses of inner and middle layers did not change much, but the thickness of the outer layer was slightly increased to 25 Å. The middle layer became more crowded with the antibody volume fraction up to 56 per cent. A similar situation also occurred at pH 5.3. The volume fraction of the middle layer was reduced slightly to 52.5 per cent, but its thickness was increased to 30 Å, showing that this layer was dominant and contained the majority of the antibody. The total surface-adsorbed amount reached a maximum of 2.9 mg m–2, which is consistent with the proximity to the pI of the antibody of around 5.5 [4]. A further increase in pH to 6.1 reduced both thickness and volume fraction of the middle layer, which is consistent with the decline of surface adsorption beyond the pI. Still, over this pH region, the amount of antibody at the interface remained very high (2.6–2.9 mg m–2), and the equivalent area per molecule in a monolayer was reduced to just about 9000 Å2 and was thus smaller than the minimum value of 12 000 Å2, suggesting that while the antibodies adopted a predominantly flat-on conformation, some of the antibody fragments must become overlapped.
When the pH was around 7, both the thickness and the volume fraction of the middle layer became reduced, indicating clear structural transition. The increase in the thickness of the third layer reflected this process with little antibody in it (8.5%). The total amount of antibody at this pH reduced to 1.8 mg m–2. Further pH increase led to more reduction in interfacial adsorption as a result of repulsive interaction within the layer and against the interface, and the distribution of different fragments across the interface became rather homogeneous, leading to the good representation of a single uniform layer for antibody adsorption at pH 8. This pH-dependent transition in an interfacially adsorbed amount is similar to mouse monoclonal anti-β-hCG antibody [5], IgG 1B [32,36] and other proteins such as BSA [37,38] at the silica–buffer interface. The NR work described earlier provided detailed changes of layer structure for the anti-hPSA antibody, and is highly relevant for explaining the binding efficiency of the antigen as shown later.
Apart from showing a good agreement in pH-dependent adsorption from both SE and NR, figure 2 also shows pH-dependent binding of antigen in terms of the amount of antigen binding to the immobilized antibody and the binding ratio between antigen and antibody (as each antibody has two Fabs, the binding ratio = mol of antigen/(mol of antibody × 2)). Although antibody adsorption peaks around its pI of pH 5.5, the amount of antigen binding to the antibody does not follow the same trend. The amount of antigen-binding peaks around pH 6. This difference may result from the change of molecular orientation owing to the rise in pH. The reducing volume fraction of the antibody layer (particularly in the middle layer) above pH 5.5 also increases the accessibility of the antigen to the binding sites. In addition, the outer layer at pH 6 has slightly more antibody compared with that at pH 5.3. This may also contribute to the enhanced antigen binding because the outer layer is more accessible. The best binding ratio was observed at pH 7, although the amount of antigen bound is not as high as that at pH 6.1. Further reduction in antibody adsorption must improve binding site accessibility, thereby further improving the binding ratio over this pH region. But the amount of antigen bound was limited by the amount of antibody at the interface. Therefore, there is a balance between the antigen-binding amount and the binding ratio. Hence, with an increase in pH, antibody adsorption goes from heavily packed to loosely packed, and the amount of antigen-binding benefits from conformational changes of the antibody and a reduced steric effect. As the amount of antibody further reduces, decreases in antigen binding resulted from the reduction of surface-immobilized antibody and its worsened conformation for binding.
3.2. Salt addition reduces antibody adsorption
The earlier-mentioned results clearly demonstrated the effect of antibody adsorption on antibody conformation and steric effect, both of which affect antigen binding. In addition to antibody concentration, adsorption time and solution pH, ionic strength is another factor affecting protein adsorption [1,23,33,39,40]. The presence of counterions causes screening effect and may reduce protein adsorption [39]. The time-dependent adsorption of the antibody (10 mg l–1, pH 7) with the presence of different ionic strengths is shown in figure 4, where it is clear that addition of salt does reduce antibody adsorption on the silica surface. At low ionic strength (5 mM), it takes more than 1 h to reach the adsorption plateau, while increasing ionic strengths shortens the time needed, as a result of the increased screening of electrostatic effect and associated structural rearrangement. These features are consistent with the interfacial adsorption of peptides [26] and globular proteins such as lysozyme [41], lactoferrin [33] and serum albumins [39].
Figure 4.
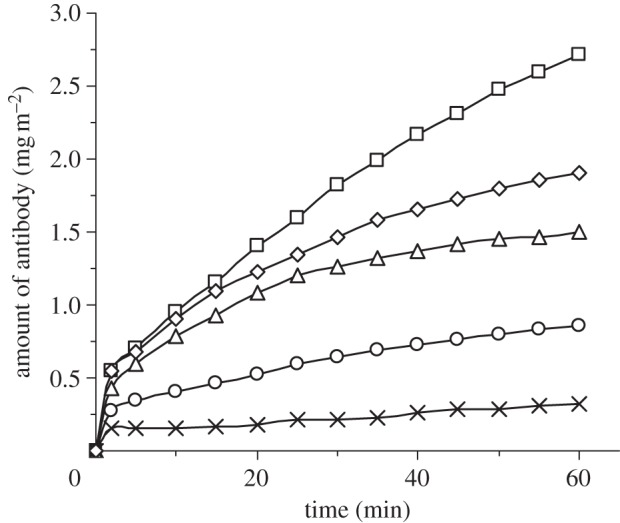
Time-dependent adsorption of antibody (10 mg l–1, pH 7) with ionic strength of 5 (open squares), 20 (open diamonds), 50 (open triangles), 100 (open circles) and 150 mM (cross symbols).
NR has also been carried out to explore the interfacial layer structure of the antibody at different ionic strengths. Figure 5 shows the reflectivity profiles of the antibody after 1 h adsorption at the silica–buffer interface under different ionic strengths from 5 to 100 mM. It was found that at the ionic strength of 5 mM, a three-layer model is needed to fit the profile. The inner layer near the oxide surface has a thickness of 10 Å and contains 32 per cent of antibody, while the middle layer is much thicker (35 Å) and contains more antibodies (39%). The outer layer near the water phase has a thickness of 25 Å but contains only 12 per cent antibody. Owing to the low ionic strength, there is a relatively high amount of antibody adsorbed at the interface (2.8 mg m–2). The small area per molecule (approx. 9000 Å2) indicates strong segment overlapping between the molecules. At the ionic strength of 20 mM, the middle layer becomes thinner (25 Å) but the outer layer becomes thicker (35 Å). Less amount of antibody exists in each layer, indicating the increased screening of the antibody molecules by the counterions. Further increase of the ionic strength to 50 and 100 mM results in the further reduction of the adsorbed amount at the interface. At 50 mM, a uniform layer model is sufficient to describe the interfacial structure, with the layer thickness around 58 Å containing 19 per cent of the antibody. The thickness is slightly thicker than the short axial length of the antibody, again indicating that the molecules stay flat on the surface with some fragments projected into the solution side. At 100 mM of salt, the amount of adsorption further reduces and the layer thickness becomes 42 Å, almost the same as the short axial length of the antibody. At high ionic strengths, the area per molecule is much bigger than the footprint of the flat-on molecule, consistent with low antibody surface coverage.
Figure 5.
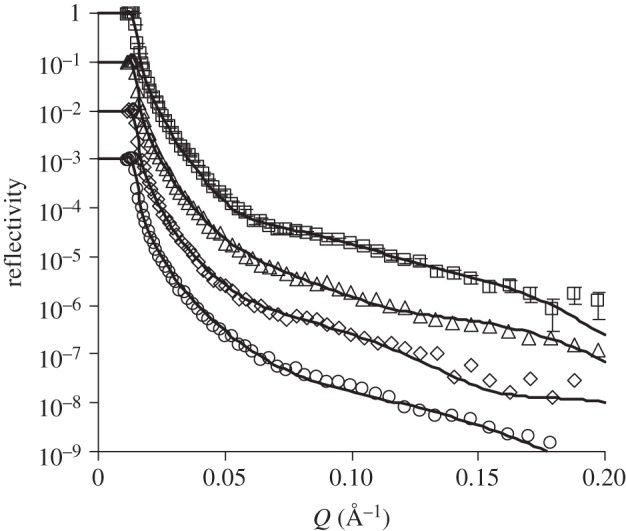
NR profiles at the SiO2–buffer interface measured from anti-hPSA antibody adsorption (10 mg l–1, pH 7) with ionic strengths of 5 (open squares), 20 (open triangles), 50 (open diamonds) and 100 (open circles) mM. The solid lines are the best fits, while the symbols are the measured data. For clarity, data at 20, 50 and 100 mM of salt have been shifted down 1–3 magnitudes along the vertical axis. Error bars are shown for only one dataset. The levels of experimental errors are similar between the different reflectivity profiles as shown in the figure. Parameters obtained by data fitting are shown in table 2.
The ionic strength-dependent antibody adsorption from NR and SE is shown in figure 6, where the results show a clear trend of reduction of interfacial adsorption with increasing ionic strength. The amount of antigen binding to the surface-immobilized antibody is fairly constant when the ionic strength is 20–100 mM. This demonstrates that antigen binding was not significantly affected by the ionic strength in this range. Higher antigen binding was observed at very low ionic strength (5 mM). This may arise partly from less counterion screening (making the binding easier) and partly from a greater amount of antibody adsorbed (providing more binding sites). In contrast, the binding ratio increased with ionic strength. This is mainly attributed to the steady decrease of antibody-adsorbed amount, consistent with the less packing constraint.
Table 2.
Structural parameters of the anti-hPSA antibody layer at the SiO2–buffer interface under different ionic strengths. (Symbols are the same as defined in table 1.)
| ionic strengths (mM) | τ (Å) | (ρ ± 0.05) e−6 (Å−2) | φ (±2) (%) | A ± 300 (Å2) | Γ ± 0.2 (mg m−2) |
|---|---|---|---|---|---|
| 5 | 10 ± 2 | 5.4 | 32.2 | 8875 | 2.81 |
| 35 ± 3 | 5.2 | 39.0 | |||
| 25 ± 3 | 6.0 | 11.9 | |||
| 20 | 12 ± 3 | 5.7 | 22.0 | 13 736 | 1.81 |
| 25 ± 2 | 5.5 | 28.8 | |||
| 35 ± 5 | 6.1 | 8.50 | |||
| 50 | 58 ± 2 | 5.8 | 18.6 | 16 276 | 1.5 |
| 100 | 42 ± 2 | 5.8 | 18.6 | 22 476 | 1.1 |
Figure 6.
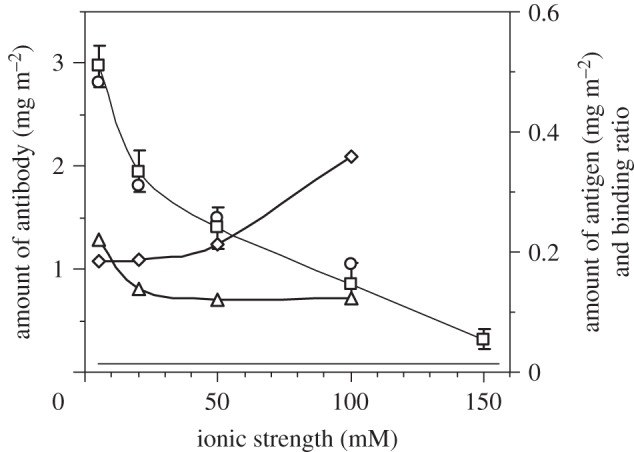
The amount of the surface-adsorbed antibody (left axis) obtained by ellipsometry (open squares) and NR (open circles) under different ionic strengths with their corresponding antigen-binding amount (open triangles, right axis) and binding ratio (open diamonds, right axis). Lines are for eye guidance.
3.3. Adsorption and binding on hydrophobic surface
Although surface properties are known to affect protein adsorption, previous studies have been devoted to the investigation of model proteins (BSA, human serum albumin and lysozyme) on modified surfaces such as hydrophobic C8 or C18, [42] phospholipid monolayer [43] and pentadecyl-1-ol [44]. In this work, we have examined antibody adsorption on hydrophobic C8 modified surface using trimethoxy(octyl)silane (C8) to initiate chemical grafting on a clean silicon wafer or block with a native oxide layer of 12 ± 2 Å. The contact angles of the coated surfaces were above 90° and the thicknesses of the C8 layers were 7–8 Å, as determined by NR. Antibody was adsorbed at the C8–buffer interface through hydrophobic interactions. Similar to that at the SiO2–buffer interface, adsorption increased with antibody concentration and tended to plateau at concentrations above 50 mg l–1. At a given concentration, the adsorbed amount of antibody on the C8 surface was higher than that on the SiO2 surface. The difference arises from different adsorption driving forces at the two surfaces. Figure 7a shows the amount of antigen bound to the different amount of antibody immobilized on the hydrophobic C8 modified surface. The increase of the antibody amount on the C8 surface reduces the antigen-binding ratio markedly. The maximum amount of antigen binding to the surface-immobilized antibody occurs at an antibody amount of less than 3 mg m–2 at the C8 surface, while at the SiO2 surface, the maximum antigen binding occurs at an antibody amount around 1.5 mg m–2. Both the amount of antigen and the binding ratio on the C8 surface are lower than on the SiO2 surface. The maximum amount of antigen binding to the immobilized antibody on the SiO2 surface is around 0.22 mg m–2 while on the C8 surface is only around 0.15 mg m–2. The optimal antigen-binding ratio on the SiO2 surface is around 60 per cent compared with 30 per cent on the C8 surface. Lower antigen binding may arise from the hydrophobic interaction between the C8 surface and the antibody molecules, resulting in the conformational changes of the antibody molecules [14,45].
Figure 7.
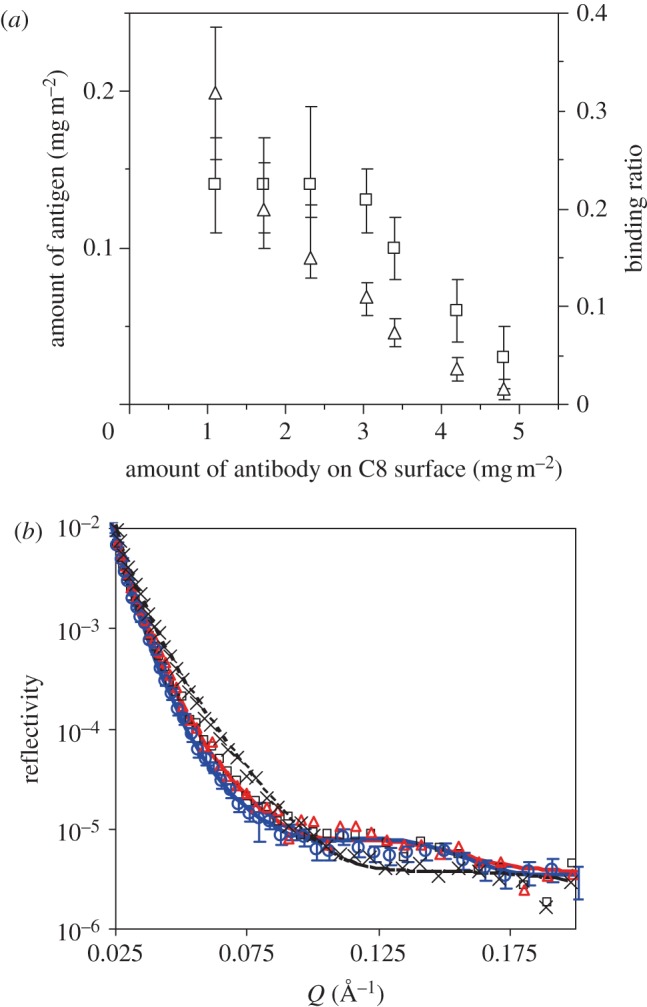
(a) Antigen-binding amount (left axis, open squares) and binding ratio (right axis, open triangles) against surface-immobilized antibody at the C8–buffer interface obtained by ellipsometry. For each experiment, antigen was allowed to bind for 15–20 min. (b) NR profiles measured at the C8–buffer interface (cross symbols), followed by antibody adsorption (open squares), BSA blocking (open triangles) and then antigen binding (open circles). The concentrations for antibody, BSA and antigen are 10, 50 and 5 mg l–1, respectively. For each step, adsorption is allowed for 1 h, followed by a buffer wash. Phosphate buffer in D2O at I = 20 mM, pH 7 was used for the experiments. The lines are the best fits, while the symbols are the measured data. For clarity, error bars are shown only for the last dataset. The levels of experimental errors are similar between the different reflectivity profiles shown in the figure. Parameters obtained by the data fitting are shown in table 3. (Online version in colour.)
To compare with the molecular orientation of the antibody immobilized at SiO2 surfaces, NR has also been carried out at the hydrophobic C8–buffer interface. Figure 7b shows antigen binding to the antibody immobilized on the C8 surface. The clean silicon block was coated with C8 as described earlier, and the layer was found to be about 7 Å with over 80 per cent coverage from NR, indicating that a good hydrophobic layer was coated. Adsorption of 10 mg l–1 of antibody at the C8–buffer interface for 1 h resulted in a uniform layer of antibody with a thickness of 56 Å and volume fraction of 15.3 per cent. The layer is slightly thicker than that on the SiO2 surface (42 Å) [6]. The molecules must have tilted on the surface owing to the repulsion between the hydrophobic surface and hydrophilic parts on the molecules. The amount of antibody adsorbed at the hydrophobic surface was 1.21 mg m–2. A BSA blocking step was then carried out. The neutron measurement was performed again after buffer wash. However, no significant adsorption of BSA was observed even from 50 mg l–1 BSA solution. Finally, antigen solution (5 mg l–1) was applied for 1 h, and then washed by buffer rinsing. Antigen binding resulted in a slight left shift of the reflectivity curve. It was found that antigen binding did not change layer thickness but reduced its SLD, indicating the insertion of antigen into the antibody layer, although the amount of antigen bound was relatively small (0.2 mg m–2).
Table 3.
Structural parameters obtained from fitting models to reflectivity profiles shown in figure 7b. (Symbols are the same as defined in table 1, with φantibody, φBSA, φantigen denoting the volume fractions of each protein in the layer, Γantibody, ΓBSA, Γantigen denoting their respective surface-adsorbed amount and Γtotal denoting the total surface-adsorbed amount.)
| sample/concentration (mg l−1) | τ (Å) | (ρ ± 0.05) e−6 (Å−2) | φantibody/φBSA/φantigen (±2) (%) | Γantibody/ΓBSA/Γantigen (mg m−2) | Γtotal ± 0.2 (mg m−2) |
|---|---|---|---|---|---|
| C8 | 7 ± 1 | 1 | 82.3 | ||
| antibody/10 | 56 ± 2 | 5.90 | 15.3/0/0 | 1.21/0/0 | 1.21 |
| antibody/5 | 56 ± 2 | 5.90 | 15.3/0/0 | 1.21/0/0 | 1.21 |
| BSA/50 | |||||
| antibody/10 | 56 ± 2 | 5.80 | 15.3/0/3 | 1.21/0/0.2 | 1.41 |
| BSA/50 | |||||
| antigen/5 |
3.4. Antibody immobilization through chemical binding
Although physical adsorption is simple and practical, extensive studies have reported that chemical attachment of antibodies onto substrate surfaces can improve binding efficiency [9,11,15,18,46]. In this work, we have used chemical attachment of anti-hPSA onto SiO2 surfaces via MTS and GMBS attachments to compare with the physical adsorption on hydrophilic silica and hydrophobic C8 surfaces. The interfacial chemistry and the subsequent protein adsorption are schematically outlined in figure 8 for clarity. Figure 9 shows NR profiles measured at different stages, with fitted parameters listed in table 4. The thickness of the freshly cleaned SiO2 layer was again 12 Å with SLD of 3.4 × 10⁻⁶ Å−2, consistent with the formation of a smooth native oxide surface. After grafting of MTS and GMBS, an additional layer of 20 Å with SLD of 3.95 × 10⁻⁶ Å−2 in D2O was formed, equivalent to the volume fraction of 51 per cent. Antibody was then incubated with the modified surface, followed by buffer washing and then rinsing by 0.15 M NaCl solution. Subsequent NR measurements revealed a thickness of 48 Å from antibody attachment through chemical grafting, with the surface coverage of 1.5 mg m–2. As already described, rinsing of preadsorbed antibody by 0.15 M NaCl on silica surfaces resulted in almost complete desorption (with only 0.3 mg m–2 antibody left). The difference must thus be attributed to the successful attachment of the antibody molecules from chemical grafting. The thickness of the antibody layer revealed that the molecules stayed predominantly flat on the surface in spite of chemical attachment. BSA blocking led to little additional mass onto the layer, but extensive buffer rinsing then caused a slight drop in layer thickness. Antigen was then incubated with the surface and then rinsed by buffer again. Subsequent NR measurements revealed that while the thickness did not change much, the reduction in the SLD layer indicated the binding of antigen within the antibody layer. The amount of antigen bound to the chemically attached antibody layer was found to be 0.19 ± 0.03 mg m–2.
Figure 8.
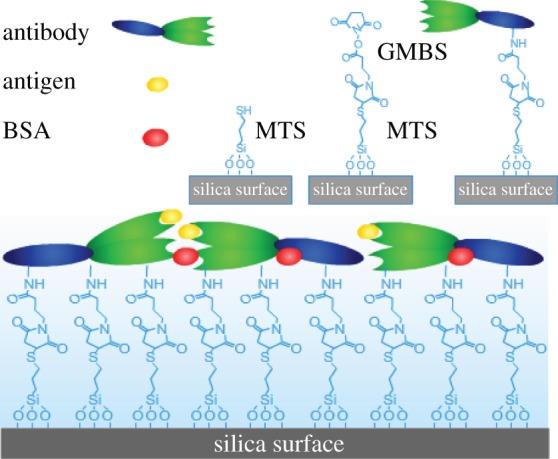
A schematic representation of interfacial chemistry involving the attachment of MTS, the grafting of GMBS and the subsequent protein adsorption. (Online version in colour.)
Figure 9.
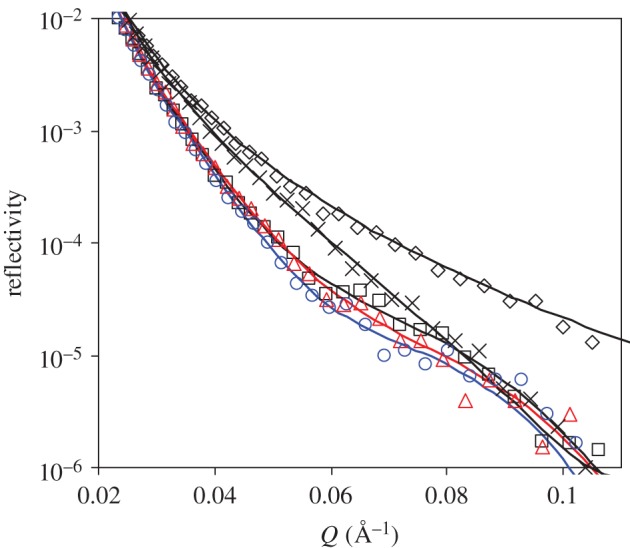
NR profiles at the SiO2–D2O interface before (open diamonds) and after MTS and GMBS modification (cross symbols), followed by adsorption of antibody (open squares), BSA blocking (open triangles) and then antigen binding (open circles). The concentrations for antibody, BSA and antigen are 10, 50 and 5 mg l–1, respectively. For each step, adsorption is allowed for 1 h, followed by a buffer wash (phosphate buffer in D2O at I = 20 mM, pH 7). An additional step of 0.15 M NaCl wash was carried out after antibody binding. The solid lines are the best fits, while the symbols are the measured data. For clarity, error bars are not shown. The level of the experimental errors is similar between different reflectivity profiles, as shown in previous figures. Parameters obtained by data fitting are shown in table 4. (Online version in colour.)
Table 4.
Structural parameters obtained from fitting of reflectivity profiles shown in figure 9, relating to the binding of the MTS and GMBS layer and the subsequent anti-hPSA antibody layer at the solid–buffer interface. (Symbols are the same as defined in table 3.)
| sample/concentration (mg l−1) | τ (Å) | (ρ ± 0.05) e−6 (Å−2) | φantibody/φBSA/φantigen (±2) (%) | Γantibody/ΓBSA/Γantigen (mg m−2) | Γtotal ± 0.1 (mg m−2) |
|---|---|---|---|---|---|
| SiO2 | 12 ± 2 | 3.41 | |||
| MTS and GMBS | 20 ± 2 | 3.95 | 51 | ||
| antibody/10 | 48 ± 2 | 5.7 | 22 | 1.5 ± 0.1 | 1.5 |
| antibody/10 + BSA/50 | 46 ± 2 | 5.7 | 22 | 1.44 ± 0.1 | 1.44 |
| antibody/10 + BSA/50 + antigen/5 | 46 ± 2 | 5.6 | 22/0/3 | 1.44 ± 0.1/0/0.19 ± 0.03 | 1.63 |
It is useful to compare the relative bioactivity of the immobilized antibody. On SiO2 surfaces, a maximum amount of antigen binding (0.22 mg m–2) has been achieved under optimal surface and solution conditions [6]. On the hydrophobic C8 surface, a similar amount (0.2 mg m–2) of antigen binding has also been achieved. By contrast, the amount of antigen binding from the chemically attached antibody surface is 0.19 mg m–2, showing no obvious improvement. Thus, by optimizing the condition of antigen binding, the physical adsorption method has comparable antigen-binding efficiency to chemically grafted antibody molecules at the interface. The similarity in optimal surface antigen binding shows that the interaction with substrate surface is less significant. Instead, lateral antibody-packing density associated with antibody adsorption has far greater influence in absolute antigen-binding amount and in relative binding efficiency.
4. Conclusions
We have examined the effects of solution pH, ionic strength and surface chemistry on antibody immobilization and antigen binding using in situ measurements of SE for dynamic adsorption and of NR for interfacial structure. Shifting pH away from the isoelectric point resulted in a reduction in antibody adsorption onto silica surfaces. Antigen binding followed a similar trend. The highest antigen-binding amount occurred around pH 6. The addition of salt effectively reduced antibody immobilization at the SiO2–buffer interface, but the amount of antigen binding was found to be fairly constant up to an ionic strength of 150 mM.
Modifications of silicon surface by hydrophobic C8 and chemical attachment through GMBS have enabled us to further explore the effects of surface chemistry on antibody adsorption and antigen binding. It was found that on all surfaces, antibody adopted the predominant ‘flat-on’ orientation. Antigen-binding capabilities on these surfaces were found to be similar, consistent with comparable antibody adsorption. Thus, the dominant influence on antigen binding arose from lateral interactions between protein molecules within the adsorbed layers.
Acknowledgements
The authors thank EPSRC for financial support under grants EP/F062966/1, EP/F063865/1 and EP/F06294X/1 and ISIS Neutron Facility at RAL for the beam time.
References
- 1.Xu H., Lu J. R., Williams D. E. 2006. Effect of surface packing density of interfacially adsorbed monoclonal antibody on the binding of hormonal antigen human chorionic gonadotrophin . J. Phys. Chem. B 110, 1907–1914 10.1021/jp0538161 (doi:10.1021/jp0538161) [DOI] [PubMed] [Google Scholar]
- 2.Silverton E. W., Navia M. A., Davies D. R. 1977. Three-dimensional structure of an intact human immunoglobulin. Proc. Natl Acad. Sci. USA 74, 5140–5144 10.1073/pnas.74.11.5140 (doi:10.1073/pnas.74.11.5140) [DOI] [PMC free article] [PubMed] [Google Scholar]
- 3.Lin S., Lee C. K., Lin Y. H., Lee S. Y., Sheu B. C., Tsai J. C., Hsu S. M. 2006. Homopolyvalent antibody–antigen interaction kinetic studies with use of a dual-polarization interferometric biosensor . Biosens. Bioelectron. 22, 715–721 10.1016/j.bios.2006.02.011 (doi:10.1016/j.bios.2006.02.011) [DOI] [PubMed] [Google Scholar]
- 4.Xu H., Zhao X., Grant C., Lu J. R., Williams D. E., Penfold J. 2006. Orientation of a monoclonal antibody adsorbed at the solid/solution interface: a combined study using atomic force microscopy and neutron reflectivity . Langmuir 22, 6313–6320 10.1021/la0532454 (doi:10.1021/la0532454) [DOI] [PubMed] [Google Scholar]
- 5.Xu H., Zhao X., Lu J. R., Williams D. E. 2007. Relationship between the structural conformation of monoclonal antibody layers and antigen binding capacity . Biomacromolecules 8, 2422–2428 10.1021/bm070297u (doi:10.1021/bm070297u) [DOI] [PubMed] [Google Scholar]
- 6.Zhao X., Pan F., Cowsill B., Lu J. R., Garcia-Gancedo L., Flewitt A. J., Ashley G. M., Luo J. 2011. Interfacial immobilization of monoclonal antibody and detection of human prostate-specific antigen . Langmuir 27, 7654–7662 10.1021/la201245q (doi:10.1021/la201245q) [DOI] [PubMed] [Google Scholar]
- 7.Cao T., Wang A., Liang X., Tang H., Auner G. W., Salley S. O., Ng K. Y. S. 2008. Functionalization of AlN surface and effect of spacer density on Escherichia coli pili-antibody molecular recognition . Colloids Surf. B Biointerfaces 63, 176–182 10.1016/j.colsurfb.2007.11.023 (doi:10.1016/j.colsurfb.2007.11.023) [DOI] [PubMed] [Google Scholar]
- 8.Choi J. M., An J. Y., Kim B. W. 2009. Effect of biolinker on the detection of prostate specific antigen in an interferometry . Biotechnol. Bioprocess Eng. 14, 6–12 10.1007/s12257-008-0108-2 (doi:10.1007/s12257-008-0108-2) [DOI] [Google Scholar]
- 9.Corso C. D., Dickherber A., Hunt W. D. 2008. An investigation of antibody immobilization methods employing organosilanes on planar ZnO surfaces for biosensor applications . Biosens. Bioelectron. 24, 805–811 10.1016/j.bios.2008.07.011 (doi:10.1016/j.bios.2008.07.011) [DOI] [PubMed] [Google Scholar]
- 10.Le-Brun A. P., Holt S. A., Shah D. S., Majkrzak C. F., Lakey J. H. 2008. Monitoring the assembly of antibody-binding membrane protein arrays using polarised neutron reflection . Eur. Biophys J. 37, 639–645 10.1007/s00249-008-0291-2 (doi:10.1007/s00249-008-0291-2) [DOI] [PubMed] [Google Scholar]
- 11.Maraldo D., Mutharasan R. 2007. Optimization of antibody immobilization for sensing using piezoelectrically excited-millimeter-sized cantilever (PEMC) sensors . Sens. Actuators B 123, 474–479 10.1016/j.snb.2006.09.034 (doi:10.1016/j.snb.2006.09.034) [DOI] [Google Scholar]
- 12.Oh S. W., Moon J. D., Lim H. J., Park S. Y., Kim T., Park J., Han M. H., Snyder M., Choi E. Y. 2005. Calixarene derivative as a tool for highly sensitive detection and oriented immobilization of proteins in a microarray format through noncovalent molecular interaction . FASEB J. 19, 1335–1337 [DOI] [PubMed] [Google Scholar]
- 13.Park J., Kurosawa S., Takai M., Ishihara K. 2007. Antibody immobilization to phospholipid polymer layer on gold substrate of quartz crystal microbalance immunosensor . Colloids Surf. B Biointerfaces 55, 164–172 10.1016/j.colsurfb.2006.11.032 (doi:10.1016/j.colsurfb.2006.11.032) [DOI] [PubMed] [Google Scholar]
- 14.Tajima N., Takai M., Ishihara K. 2011. Significance of antibody orientation unraveled: well-oriented antibodies recorded high binding affinity . Anal. Chem. 83, 1969–1976 10.1021/ac1026786 (doi:10.1021/ac1026786) [DOI] [PubMed] [Google Scholar]
- 15.Tedeschi L., Domenici C., Ahluwalia A., Baldini F., Mencaglia A. 2003. Antibody immobilisation on fibre optic TIRF sensors . Biosens. Bioelectron. 19, 85–93 10.1016/S0956-5663(03)00173-8 (doi:10.1016/S0956-5663(03)00173-8) [DOI] [PubMed] [Google Scholar]
- 16.Wu P., Hogrebe P., Grainger D. W. 2006. DNA and protein microarray printing on silicon nitride waveguide surfaces . Biosens. Bioelectron. 21, 1252–1263 10.1016/j.bios.2005.05.010 (doi:10.1016/j.bios.2005.05.010) [DOI] [PubMed] [Google Scholar]
- 17.Yakovleva J., Davidsson R., Lobanova A., Bengtsson M., Eremin S., Laurell T., Emnéus J. 2002. Microfluidic enzyme immunoassay using silicon microchip with immobilized antibodies and chemiluminescence detection . Anal. Chem. 74, 2994–3004 10.1021/ac015645b (doi:10.1021/ac015645b) [DOI] [PubMed] [Google Scholar]
- 18.Yang L., Li Y. 2005. AFM and impedance spectroscopy characterization of the immobilization of antibodies on indium–tin oxide electrode through self-assembled monolayer of epoxysilane and their capture of Escherichia coli O157:H7 . Biosens. Bioelectron. 20, 1407–1416 10.1016/j.bios.2004.06.024 (doi:10.1016/j.bios.2004.06.024) [DOI] [PubMed] [Google Scholar]
- 19.Karyakin A. A., Presnova G. V., Rubtsova M. Y., Egorov A. M. 2000. Oriented mobilization of antibodies onto the gold surfaces via their native thiol groups . Anal. Chem. 72, 3805–3811 10.1021/ac9907890 (doi:10.1021/ac9907890) [DOI] [PubMed] [Google Scholar]
- 20.Lowe R. D., Szili E. J., Kirkbride P., Thissen H., Siuzdak G., Voelcker N. H. 2010. Combined immunocapture and laser desorption/ionization mass spectrometry on porous silicon . Anal. Chem. 82, 4201–4208 10.1021/ac100455x (doi:10.1021/ac100455x) [DOI] [PubMed] [Google Scholar]
- 21.Ibii T., Kaieda M., Hatakeyama S., Shiotsuka H., Watanabe H., Umetsu M., Kumagai I., Imamura T. 2010. Direct immobilization of gold-binding antibody fragments for immunosensor applications . Anal. Chem. 82, 4229–4235 10.1021/ac100557k (doi:10.1021/ac100557k) [DOI] [PubMed] [Google Scholar]
- 22.Lu J. R., Zhao X., Yaseen M. 2007. Protein adsorption studied by neutron reflection . Curr. Opin. Colloid Interface Sci. 12, 9–16 10.1016/j.cocis.2007.02.001 (doi:10.1016/j.cocis.2007.02.001) [DOI] [Google Scholar]
- 23.Zhao X., Pan F., Lu J. R. 2009. Interfacial assembly of proteins and peptides: recent examples studied by neutron reflection. J. R. Soc. Interface 6, S659–S670 10.1098/rsif.2009.0168.focus (doi:10.1098/rsif.2009.0168.focus) [DOI] [PMC free article] [PubMed] [Google Scholar]
- 24.Chen Z., Prestiglacomo A., Stamey T. A. 1995. Purification and characterization of prostate-specific antigen (PSA) complexed to α1-antichymotrypsin: potential reference material for international standardization of PSA immunoassays . Clin. Chem. 41, 1273–1282 [PubMed] [Google Scholar]
- 25.Zhao X., Pan F., Coffey P., Lu J. R. 2008. Cationic copolymer-mediated DNA immobilization: interfacial structure and composition as determined by ellipsometry, dual polarization interferometry, and neutron reflection . Langmuir 24, 13 556–13 564 10.1021/la8024974 (doi:10.1021/la8024974) [DOI] [PubMed] [Google Scholar]
- 26.Pan F., Zhao X., Perumal S., Waigh T. A., Lu J. R., Webster J. R. P. 2010. Interfacial dynamic adsorption and structure of molecular layers of peptide surfactants. Langmuir 26, 5690–5696 10.1021/la9037952 (doi:10.1021/la9037952) [DOI] [PubMed] [Google Scholar]
- 27.Tang Y., Lu J. R., Lewis A. L., Vick T. A., Stratford P. W. 2001. Swelling of zwitterionic polymer films characterized by spectroscopic ellipsometry . Macromolecules 34, 8768–8776 10.1021/ma010476i (doi:10.1021/ma010476i) [DOI] [Google Scholar]
- 28.De-Feijter J. A., Benjamins J., Veer F. A. 1978. Ellipsometry as a tool to study the adsorption behavior of synthetic and biopolymers at the air–water interface . Biopolymers 17, 1759–1772 10.1002/bip.1978.360170711 (doi:10.1002/bip.1978.360170711) [DOI] [Google Scholar]
- 29.Martin M. 1994. Ellipsometry studies of protein layers adsorbed at hydrophobic surfaces . J. Colloid Interface Sci. 166, 333–342 10.1006/jcis.1994.1303 (doi:10.1006/jcis.1994.1303) [DOI] [Google Scholar]
- 30.Lu J. R., Lee E. M., Thomas R. K. 1996. The analysis and interpretation of neutron and X-ray specular reflection . Acta Cryst. A52, 11–41 [Google Scholar]
- 31.Penfold J., et al. 1997. Recent advances in the study of chemical surfaces and interfaces by specular neutron reflection . J. Chem. Soc., Faraday Trans. 93, 3899–3917 10.1039/a702836i (doi:10.1039/a702836i) [DOI] [Google Scholar]
- 32.Buijs J., van-den-Berg P. A. W., Lichtenbelt J. W. T., Norde W., Lyklema J. 1996. Adsorption dynamics of IgG and Its F(ab’)2 and Fc fragments studied by reflectometry. J. Colloid Interface Sci. 178, 594–605 10.1006/jcis.1996.0156 (doi:10.1006/jcis.1996.0156) [DOI] [Google Scholar]
- 33.Pan F., Zhao X., Waigh T. A., Lu J. R., Miano F. 2008. Interfacial adsorption and denaturization of human milk and recombinant rice lactoferrin. Biointerphases 3, FB36–FB43 10.1116/1.2965135 (doi:10.1116/1.2965135) [DOI] [PubMed] [Google Scholar]
- 34.Zhao X., Pan F., Lu J. R. 2008. Recent development of peptide self-assembly . Prog. Nat. Sci. 18, 653–660 10.1016/j.pnsc.2008.01.012 (doi:10.1016/j.pnsc.2008.01.012) [DOI] [Google Scholar]
- 35.Zhao X., Pan F., Perumal S., Xu H., Lu J. R., Webster J. R. P. 2009. Interfacial assembly of cationic peptide surfactants . Soft Matter 5, 1630–1638 10.1039/b807149g (doi:10.1039/b807149g) [DOI] [Google Scholar]
- 36.Buijs J., White D. D., Norde W. 1997. The effect of adsorption on the antigen binding by IgG and its F(ab’)2 fragments. Colloids Surf. B Biointerfaces 8, 239–249 10.1016/S0927-7765(96)01327-6 (doi:10.1016/S0927-7765(96)01327-6) [DOI] [Google Scholar]
- 37.Su T. J., Lu J. R., Thomas R. K., Cui Z. F. 1999. Effect of pH on the adsorption of bovine serum albumin at the silica/water interface studied by neutron reflection . J. Phys. Chem. B 103, 3727–3736 10.1021/jp983580j (doi:10.1021/jp983580j) [DOI] [Google Scholar]
- 38.Su T. J., Lu J. R., Thomas R. K., Cui Z. F., Penfold J. 1998. The conformational structure of bovine serum albumin layers adsorbed at the silica–water interface . J. Phys. Chem. B 102, 8100–8108 10.1021/jp981239t (doi:10.1021/jp981239t) [DOI] [Google Scholar]
- 39.Lu J. R. 1999. Neutron reflection study of globular protein adsorption at planar interfaces . Annu. Rep. Prog. Chem. C 95, 3–45 10.1039/pc095003 (doi:10.1039/pc095003) [DOI] [Google Scholar]
- 40.Lu J. R., Perumal S., Zhao X. B., Miano F., Enea V., Heenan R. R., Penfold J. 2005. Surface-induced unfolding of human lactoferrin . Langmuir 21, 3354–3361 10.1021/la047162j (doi:10.1021/la047162j) [DOI] [PubMed] [Google Scholar]
- 41.Su T. J., Lu J. R., Thomas R. K., Cui Z. F., Penfold J. 1998. The adsorption of lysozyme at the silica–water interface: a neutron reflection study . J. Colloid Interface Sci. 203, 419–429 10.1006/jcis.1998.5545 (doi:10.1006/jcis.1998.5545) [DOI] [PubMed] [Google Scholar]
- 42.Lu J. R., Su T. J., Thomas R. K., Rennie A. R., Cubit R. 1998. The denaturation of lysozyme layers adsorbed at the hydrophobic solid/liquid surface studied by neutron reflection . J. Colloid Interface Sci. 206, 212–223 10.1006/jcis.1998.5680 (doi:10.1006/jcis.1998.5680) [DOI] [PubMed] [Google Scholar]
- 43.Lu J. R., Murphy E. F., Su T. J., Lewis A. L., Stratford P. W., Satija S. K. 2001. Reduced protein adsorption on the surface of a chemically grafted phospholipid monolayer . Langmuir 17, 3382–3389 10.1021/la0017429 (doi:10.1021/la0017429) [DOI] [Google Scholar]
- 44.Su T. J., Green R. J., Wang Y., Murphy E. F., Lu J. R. 2000. Adsorption of lysozyme onto the silicon oxide surface chemically grafted with a monolayer of pentadecyl-1-ol . Langmuir 16, 4999–5007 10.1021/la991559j (doi:10.1021/la991559j) [DOI] [Google Scholar]
- 45.Lu D. R., Lee S. J., Park K. 1991. Calculation of solvation interaction energies for protein adsorption on polymer surfaces. J. Biomater. Sci. Polym. Ed. 3, 127–147 [DOI] [PubMed] [Google Scholar]
- 46.Shriver-Lake L. C., Donner B., Edelstein R., Breslin K., Bhatia S. K., Ligler F. S. 1997. Antibody immobilization using heterobifunctional crosslinkers . Biosens. Bioelectron. 12, 1101–1106 10.1016/S0956-5663(97)00070-5 (doi:10.1016/S0956-5663(97)00070-5) [DOI] [PubMed] [Google Scholar]


