Abstract
Poly(lactic-co-glycolic acid) (PLGA) microspheres containing celecoxib were prepared via electrospraying, and the influence of three processing parameters namely flow rate, solute concentration and drug loading, on the physico-chemical properties of the particles and the drug-release profile was studied. Microspheres with diameters between 2 and 8 μm were produced and a near-monodisperse size distribution was achieved (polydispersivity indices of 6–12%). Further, the inner structure of the particles showed that the internal porosity of the particles increased with increasing solvent concentration. X-ray powder diffraction (XRPD) analysis indicated that the drug was amorphous and remained stable after eight months of storage. Drug release was studied in USP 2 (United States Pharmacopeia Dissolution Apparatus 2) dissolution chambers, and differences in release profiles were observed depending on the parametric values. Changes in release rate were found to be directly related to the influence of the studied parameters on particle size and porosity. The results indicate that electrospraying is an attractive technique for producing drug-loaded microspheres that can be tailored towards an intended drug-delivery application. Compared with the more conventional spray-drying process, it provides better control of particle characteristics and less aggregation during particle formation. In particular, this study demonstrated its suitability for preparing capsules in which the drug is molecularly dispersed and released in a sustained manner to facilitate improved bioavailability.
Keywords: controlled release, microspheres, electrospraying, low solubility, celecoxib, porosity
1. Introduction
A large number of new drugs currently under development are classified as being poorly soluble, and this critically limits their absorption and hence effectiveness when administered orally. These drugs dissolve slowly, irregularly and incompletely, resulting in low bioavailability and poor pharmacokinetics in vivo [1,2].
Many solubilization techniques and dissolution-enhancing strategies have been employed to address these issues, including solid dispersions [3], micronization [4], lipid formulations [5] and solid-state alterations [6]. Although these methods generally provide enhancements in solubility and/or dissolution rate to enable increased absorption during intestinal transit, they also suffer from a number of disadvantages when used in isolation [5,7]. Lipid formulations are effective but are limited to highly lipophilic or very potent drugs [8]. Particle-size reduction by different means results in an increase in the dissolution rate, but the drug's inherent solubility remains low [3]. Amorphous systems have enhanced solubility owing to their thermodynamic properties and lower energy barrier than crystalline systems [9]. However, the actual solubility enhancement is limited owing to a devitrification process that takes place upon exposure to an aqueous environment. This effect is believed to be overcome by preparing solid dispersions using polymers with a high glass transition temperature (Tg) [10]. Despite their sometimes poor physical stability, solid dispersions have been shown to slow down devitrification, enhance wettability and effectively disperse drugs in polymer matrices [5,11].
Drug-loaded microspheres fabricated with biodegradable polymers typically form a matrix structure in which the drug is supposedly molecularly dispersed, resulting in amorphous characteristics [12]. This thus combines the advantages of amorphous systems with those of micronization. However, the drug distribution in the microspheres will depend on the miscibility of the drug with the polymer and the drug loading of the particles, and these may affect the state of the drug [13]. Drug-loaded microspheres are often investigated for controlled release applications, where a continuous release of the drug from the microspheres is sustained over a period of time. This type of release mechanism is desirable to maintain a certain therapeutic level of the drug in the required time span, in particular for drugs with low aqueous solubility [14].
In biodegradable microparticle systems, the drug-release kinetics can be controlled partly by altering their polymer composition such as molecular weight and ratios of monomers for co-polymer systems [15]. Also, several studies have shown that the properties of the microparticles such as size [16], morphology and porosity [17,18] as well as drug loading [16,19] are important factors in determining the drug-release profile of these particles. By adjusting different parameters in the processing operation, solvent system and formulation, these properties can often be controlled to some degree. However, control of particle properties and their drug-release behaviour are still limited and better control is necessary to tailor drug release towards a specific purpose [20,21].
There are various methods for preparing solid dispersions, including hot-melt extrusion, solvent wetting and spray drying [11]. Of these now conventional techniques, spray drying is considered the most attractive for controlling particle size and structural features and further allows for the production of dry particle powder on an industrial scale [22]. Yet, spray drying also has its limitations such as a broad particle-size distribution, particle agglomeration owing to insufficient dispersion, low particle yield at the laboratory scale and the potential instability of materials sensitive to high temperatures [23,24]. In this paper, an alternative approach somewhat similar to spray drying, but overcoming these limitations, is considered and optimized for the purpose of producing microspheres loaded with hydrophobic drugs. Drug microspheres were prepared using the electrospraying technique where the biodegradable polymer poly(lactic-co-glycolic acid) (PLGA) and the drug celecoxib (CEL) were used. CEL is a hydrophobic, non-steroidal anti-inflammatory drug, which was chosen because of its low aqueous solubility (approx. 5 µg ml−1) and solubility-limited bioavailability [25]. An increase in bioavailability is typically a consequence of higher peak serum concentration of a therapeutic drug, Cmax, but this is not always an advantage. For CEL, an elevated Cmax is associated with serious side effects and a slow release may be more suitable, further reducing the pill burden for the patient [26]. As with spray drying, it is hypothesized that solid dispersion and generation of an amorphous state can both be achieved using electrospraying.
In its cone-jet mode, electrospraying can produce near-monodisperse microdroplets, which then solidify into microspheres, in a passive one-step process. Electrospraying also has the advantage that the droplets are self-dispersing owing to Coulombic repulsion and therefore, particle aggregation can be avoided under the right conditions [27,28]. Finally, high drug encapsulation efficiencies of around 90 per cent have been reported using electrospraying [29,30]. Several research groups have studied the use of electrospraying to prepare polymeric particles for drug-delivery purposes (including [31–33]). Drug-loaded microparticles have been produced in sizes ranging between 250 nm and 100 µm depending on the materials used and the processing parameters applied but are most often observed between 1 and 10 µm in diameter [34]. These microparticles are typically intended for pulmonary, nasal or systemic delivery for which they have a suitable size [28]. However, they may also be useful for oral delivery, and in fact, most drug molecule studies with electrospraying have been conducted on drugs with low aqueous solubility such as paclitaxel [32] and itraconazole [35] or protein drugs [36], both of which are challenging but desirable classes of drugs to deliver orally. Most studies have reported spherical particles with a smooth surface and narrow particle-size distributions with some control of particle diameter and a drug-release profile following the Higuchi model [34,37]. Yet, some studies have reported low-density particles such as hollow spheres and porous particles, which could be useful for pulmonary delivery [21,38]. Further, other studies have demonstrated that particles can be prepared with wrinkled or porous surface morphology or in different shapes such as ellipsoid, disc or rods [33,39]. This may be useful for modifying drug release or for promoting or preventing its interaction with cells [40,41]. Although, these studies have examined many aspects of the electrospraying system and control of particle dimensions and morphology, there are still a number of aspects relating to system processing, formulation and the influence on particles properties that have yet to be fully examined [21,42].
CEL-loaded PLGA microparticles have been prepared by several researchers by use of different techniques, including emulsion and solvent evaporation-based methods [26,43,44] as well as a vibrating nozzle device [45]. In these studies, microparticles of sizes 0.1–5 µm were obtained depending on the study, and drug release took place at different rates, with the release time ranging between a few hours [43] and several weeks [26], indicating the influence of particle size on drug release. In a previous study by the authors, it was shown that PLGA microspheres loaded with CEL could be prepared using electrospraying and that particle characteristics were dependent on the processing parameters [46]. The aim of this investigation was to determine quantitatively the specific influence of selected processing and formulation parameters on the resulting particle physico-chemical properties and drug-release profile. The overall objective is to determine how these properties could be tailored to a specific application through appropriate specification of the preparation protocol.
2. Material and methods
2.1. Materials
PLGA (50 : 50 Resomer RG503H, Mw = 33 000) was purchased from Boehringer Ingelheim (Ingelheim, Germany). CEL crystalline powder was acquired from Dr Reddy, Hyderabad, India (Mw = 381.38 g mol−1). Acetone (99.9% high-performance liquid chromatography (HPLC) grade) and acetonitrile (99.9% HPLC grade) were purchased from Sigma Aldrich (Poole, UK). Phosphate-buffered saline (PBS, 0.01 M, pH 6.8) was made from sodium phosphate monobasic and sodium hydroxide purchased from Sigma Aldrich (Poole, UK), and sodium lauryl sulphate (SLS) was purchased from Fagron (Waregem, Belgium). All other chemicals and solvents were of analytical grade and used without further purification.
2.2. Particle preparation
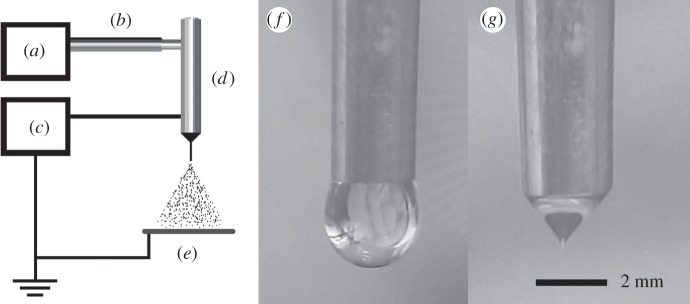
CEL-loaded PLGA microspheres were fabricated using single-nozzle electrospraying (figure 1). The spraying apparatus consisted of three main components, a high-voltage electrical power supply (Glassman Europe Ltd, Tadley, UK), a mechanical syringe pump (PHD 4400, Harvard Apparatus, Edenbridge, UK) and a custom-built, stainless steel nozzle with an inner and outer diameter of 1.77 and 2.34 mm respectively. A video camera with an in-built magnifying lens (Leica S6D JVC-color) was used to monitor the jet at the nozzle tip during particle generation (figure 2).
Figure 1.
Schematic of the electrospraying apparatus with: (a) pump, (b) tubing, (c) voltage source, (d) stainless steel nozzle, (e) collection plate and video camera single frames of jetting behaviour: (f) dripping mode and (g) stable cone jet.
Figure 2.
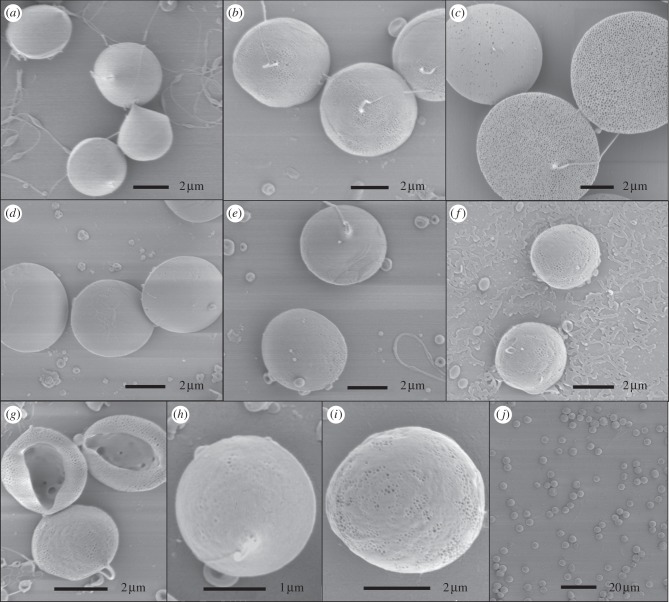
(a–h) Representative SEM images of different microsphere samples: samples 1 (a), 2 (b), 3 (c), 4 (d), 5 (e), 6 (f), 7 (g), 8 (h), 9 (i) and a low resolution view of sample 5(j).
Solutions with specified solute concentrations and drug loading were prepared by dissolving appropriate amounts of PLGA and CEL in acetonitrile and mixing until a clear solution was formed. Three experimental parameters were varied and the corresponding variation in particle properties examined: solute concentration (3, 5 and 7 wt%) drug loading (10, 20 and 30 wt%) and flow rate (10, 30 and 50 µl min−1) of the solution through the nozzle. Of the possible 27 combinations, nine sets of parameters were investigated (table 1). All solutions were electrosprayed with an applied electrical potential difference ranging between 10 and 13 kV and collected at a distance of 70 mm from the nozzle onto a collection plate. The particles were either collected onto a sheet of aluminium foil or onto glass slides. The samples were then stored in a desiccator under slight vacuum, immediately after preparation, to reduce any residual solvent in the sample.
Table 1.
List of microsphere samples prepared.
| sample | solute concentration (%) | drug loading (%) | polymer concentration (%) | flow rate (µl min−1) |
|---|---|---|---|---|
| 1 | 7 | 10 | 6.3 | 10 |
| 2 | 7 | 10 | 6.3 | 30 |
| 3 | 7 | 10 | 6.3 | 50 |
| 4 | 7 | 30 | 4.9 | 30 |
| 5 | 5 | 10 | 4.5 | 30 |
| 6 | 3 | 10 | 2.7 | 30 |
| 7 | 3 | 30 | 2.1 | 30 |
| 8 | 3 | 10 | 2.7 | 10 |
| 9 | 3 | 10 | 2.7 | 50 |
2.3. Particle size and morphology
Particle morphology and size were characterized using a scanning electron microscope (JEOL JSM-6301F and Hitachi VP-SEM S-3400N). The prepared samples, consisting of a thin layer of particles, were sputter-coated with gold, mounted on metallic stubs with double-sided carbon tape and viewed at an accelerating voltage of 3 kV (for JEOL JSM-6301F) or 10 kV (for Hitachi VP-SEM S-3400N). The images obtained were used to calculate the mean diameter and polydispersivity index for the different particle samples. For each sample, 300 particles were measured from different sites of the sample, using the software ImageJ. The sizes were calculated as the Feret's diameter based on the circumference of the particles [47].
2.4. System yield and drug entrapment efficiency
The particle yield of the system was determined gravimetrically as the ratio between the mass of dried particles collected and the theoretical mass of solid content sprayed during the collection time.
 |
Drug entrapment efficiency (EE) was determined by measuring the total amount of drug in the collected samples. Samples with 10–20 mg microspheres were weighed, dissolved in acetonitrile (10 ml) and agitated for 1 h. This solution was then diluted 1 : 10 in acetonitrile : water (20 : 80 v/v) and centrifuged at 3000 r.p.m. for 10 min. The drug content in the supernatant was analysed using an HPLC unit with Pump P680 and ASI 100 sample injector and UVD340U (Dionex, Germany) equipped with Kromasil 126 column (Kromasil, Sweden). A mobile phase of acetonitrile : water (60 : 40 v/v) was used at a flow rate of 0.5 ml min−1 and the injection volume of 10 µl was detected at wavelength 230 nm and a run time of approximately 15 min. A calibration curve was obtained from reference CEL solutions between 0.5 and 50 µg ml−1, and good linear correlation was achieved over the entire range. The drug EE was then determined using the following equation:
2.5. Cross-sectional images of microspheres
Cross-sectional images of the drug-loaded microspheres were prepared using a combined dual beam focused ion beam (FIB)—scanning electron microscopy (SEM) (Zeiss XB 1540) with a Gemini SEM column. Samples were sputter-coated with gold and mounted on metallic studs with double-sided carbon tape. FIB milling of samples was undertaken with a Ga+ ion beam at an accelerating voltage of 30 kV. Layer-by-layer milling of the microspheres was done at a beam current of 30–100 pA, with the final thinning being in the lower range. Secondary electrons formed during the milling process enabled simultaneous imaging of the sample. Reducing the beam current generally helped to reduce sample damage during ion beam.
2.6. X-ray diffraction
XRPD patterns of samples were analysed using a PANalytical X'Pert PROMPD system (PW3040/60, Philips, The Netherlands) using Cu Kα radiation (λ = 1.542Å). The samples were measured in reflection mode in the 2θ range 2°–40° on flat aluminium sample holders and scanned at an operating voltage and current of 40 kV and 30 mA, respectively. Each diffractogram was recorded at a scanning speed of 4° min−1 with a step size of 0.02. The diffraction patterns were generated using X'Pert High Score v. 2.2.0 (Philips, The Netherlands).
2.7. Drug dissolution
It is recommended that characterization of the drug-release profile of a poorly water-soluble drug is undertaken under sink conditions and the drug concentration is kept below 10 per cent of saturation to be safe [48,49]. In this study, the CEL-loaded microspheres were suspended in a PBS release medium containing 1.5% wt/v SLS to ensure sink conditions. Dissolution studies were performed on a Sotax AT7 dissolution station (Sotax, Switzerland) equipped with a United States Pharmacopeia dissolution apparatus 2 (USP 2; paddle) apparatus and 1000 ml glass vessels. Samples were drawn through 2.7 μm glass microfibre filters (Whatman Ltd, UK) using an autosampler, Biolab/Gilson GX-271 (Biolab, UK). Samples of drug-loaded microspheres were weighed (10–20 mg) and placed in a dissolution medium of 500 ml PBS (0.01 M, pH 6.8) + 1.5% SLS at a paddle rotation of 50 r.p.m., in a constant temperature bath at 37°C. Samples of 5 ml were taken at 17 time points over 24 h and later poured into HPLC vials. HPLC analysis was conducted as previously described for drug EE. A minimum of four experiments was performed for each sample condition and the results combined to construct cumulative drug-release profiles. The drug EE was taken into consideration when analysing the drug-release data, and the release data were corrected by linear scaling of each data point. Moreover, selected release curves were evaluated using the Higuchi model for drug release, a simplified model based on Fick's first law, with the following equation [37]:
where Q is the amount of drug released at the time (t) and kh is the Higuchi dissolution constant.
3. Results and discussion
3.1. Fabrication of microspheres
A series of drug-loaded microsphere samples were successfully prepared via electrospraying with different formulation and operating conditions. The model drug CEL was entrapped in particles predominantly composed of PLGA by co-dissolving in acetonitrile before atomizing the solution into fine droplets. Different formulation and operating parameters and their influence on particle physico-chemical properties and drug-release kinetics were investigated prior to this study, and specific parameters of interest were selected for a detailed investigation (table 1). The electrospraying flow rate, solute concentration and drug loading were chosen as the parameters of interest for this study. The effects of these parameters and their combinations were evaluated by characterization of the particle physico-chemical properties and drug-release profile. Other important parameters such as system voltage and sample collection distance were optimized to achieve a stable cone jet and uniform particles and otherwise kept constant during the study.
The solvent evaporation process plays an important role in electrospraying where droplets are formed into particles via a passive-drying process. Solvent evaporation from these droplets involves a combination of heat/mass transfer processes and results in particle shrinkage. This is due to the difference between the vapour pressure of the solvent and the partial pressure of the gas phase [50]. The electrostatic charge on the droplets is further believed to increase the evaporation rate of the solvent to accelerate particle formation. Also, the droplets produced are typically sufficiently small that complete solvent evaporation takes place over characteristic times of milliseconds and thus pre-heating of the solution is not required [51]. These may be important features of electrospraying that compensate for the otherwise passive-drying process. The evaporation process is critical for determining particle properties such as size and morphology and must therefore be carefully studied [52]. The applied voltage during spraying has also been shown to have an influence on the particle characteristics such as particle morphology [53]. However, in this work, the voltage was kept in the earlier specified range to reduce its influence on the particle characteristics.
3.2. Characterization of microspheres
3.2.1. Particle size and morphology
Particle size and morphology were studied using SEM, and representative SEM images of each sample produced are shown in figure 2a–j. Generally, the particles fabricated were spherical and some had visible pores on their surface while others appeared to have a smooth surface. Particles from samples 3, 6, 7 and 9 all appeared to have small pores on their surfaces and particularly those of sample 3 were covered with homogeneously distributed pores around 100 nm in size (figure 2c). The presence of such small pores on the surface can perhaps be explained by a pressure developing inside the particles. Assuming that the particle shell was initially formed and was rigid enough not to collapse, small pores may have formed to release some of that pressure stored inside [21]. Particles from sample 7 were collapsed with an opening on one side, resulting in a cup-like morphology and making visible the inner particle structure. Large pore channels were observed on the inside of these particles. The collapse of these particles is explained by the low polymer concentration in the processed solution (approx. 2%). When the polymer concentration is this low, it can result in the particle membrane becoming unstable and collapsing owing to a lack of structural support, during solvent evaporation [54].
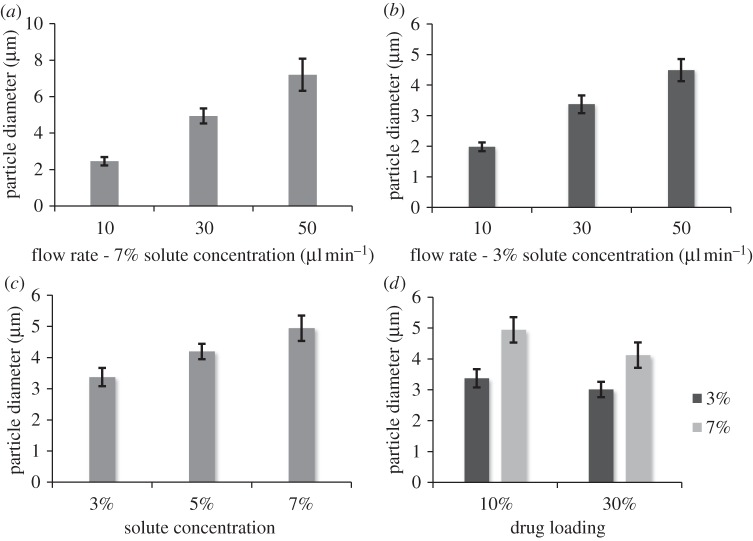
The outer diameter of the particles ranged between 2 and 8 µm depending on the sample conditions, and all samples had a relatively narrow particle-size distribution with a polydispersivity index between 6.0 and 12.3 per cent (table 2). Figure 3a–d demonstrates that the particle size was dependent on the combination of processing parameters. Flow rate had the greatest influence on particle size with a more than threefold size increase being produced by an increase in flow rate from 10 to 50 µl min−1 (figure 4a). This result is consistent with previous studies [38,55]. The solute concentration also showed a clear trend with an increase in particle size as the solute concentration was increased. This is explained by the increase in viscosity of the solution seen with an increase in solute concentration [55,56]. Finally, the drug loading also had an influence on the particle size with the particle size decreasing as the drug loading was increased. Moreover, the effect observed was relative to the solute concentration. A greater effect was observed between samples 2 and 4 than between samples 6 and 7. The influence of drug loading on particle size may be explained by the less-significant contribution of the drug compared with the polymer on the viscosity of the solution, as shown in a previous study by the authors [46]. Most of the samples prepared were near-monodisperse (see example on figure 2j), and this is one of the advantages of the electrospraying technique. In some cases, sputter coating a particle surface with gold may have an influence on the size and the morphology of the particles observed. Yet, in this study, a gold coating of a few nanometres was applied and is believed to have had a negligible effect on the particle size measurements but may have had an influence on the surface porosity observed by making the smaller pores less visible.
Table 2.
Characteristics of particle samples.
| sample | yield (%) | drug entrapment efficiency (%) | drug loading (mg g−1) | samples studied (n)a | particle size (µm)a | polydispersivity index |
|---|---|---|---|---|---|---|
| 1 | 85 ± 2 | 94 ± 3 | 94 | 1 | 2.5 ± 0.23 | 9.3 |
| 2 | 87 ± 3 | 88 ± 1 | 88 | 2 | 4.9 ± 0.41 | 8.3 |
| 3 | 86 ± 3 | 92 ± 2 | 92 | 1 | 7.2 ± 0.88 | 12.3 |
| 4 | 93 ± 1 | 98 ± 1 | 294 | 2 | 4.1 ± 0.41 | 9.9 |
| 5 | 81 ± 3 | 89 ± 1 | 89 | 1 | 4.2 ± 0.25 | 6.0 |
| 6 | 91 ± 2 | 99 ± 1 | 99 | 2 | 3.4 ± 0.30 | 8.7 |
| 7 | 85 ± 3 | 90 ± 1 | 279 | 2 | 3.0 ± 0.25 | 8.3 |
| 8 | 89 ± 3 | 97 ± 2 | 97 | 2 | 2.0 ± 0.14 | 7.3 |
| 9 | 86 ± 2 | 95 ± 1 | 95 | 2 | 4.5 ± 0.36 | 8.1 |
aThe number of samples indicates the number (n) of independent SEM samples prepared for each of the parametric conditions. In each case, 100–300 measurements of particle size were made for each sample prepared. The particle size values quoted are the means of each of the individual sample means and the s.d. quoted are the means of each of the individual sample s.d.
Figure 3.
(a,b) Mean diameter of particles prepared at different flow rates, (c) solute concentrations and (d) drug loading. Error bars indicate s.d. from the mean. n ≈ 200–300 particles.
Figure 4.
FIB/SEM images of microspheres showing the cross-sectional structure of sample 6 (a) before and (b) after milling, (c) sample 5 and (d) sample 2.
3.2.2. System yield and entrapment efficiency
The collection yield of particles ranged between 81 and 93 wt% of the initially electrosprayed solute mass depending on the processing conditions. The microspheres were collected onto an electrically conductive collection sheet and, owing to the electric charge of the particles, most were attracted onto the grounded sheet. Yet, a portion of the particles was either attached to the nozzle wall or dispersed out in the surroundings. The collection yield can be optimized by coating the surface of the nozzle with a hydrophobic material and by increasing the area of the collection sheet. In a manufacturing scenario, the particles would be sprayed into a closed chamber as with a standard spray-drying set-up, and further loss of materials could be avoided at large-scale production. There was no obvious correlation between the measured yield and the different conditions. However, the yield values in wt% obtained are comparable to or slightly higher than other liquid atomization techniques such as spray drying and ultrasonic atomization [54,57,58].
The entrapment efficiencies of CEL in the particles were found to be in the range 88–99%. These values are significantly higher than the values typically reported for other encapsulation methods such as emulsion methods [59,60]. Although differences in EE were observed, there did not seem to be any correlation between the EE and the processing conditions. Other studies have shown that a fast precipitation of the polymer during microsphere formation is advantageous for achieving high entrapment efficiencies, as the polymer will act as a diffusion barrier for the hydrophobic drug [12]. Moreover, the solubility of the drug in the polymer and the size of the particles influence the EE [30]. Thus, the high entrapment efficiencies achieved can be explained by the fast precipitation of PLGA, the hydrophobicity of CEL, the relatively large size of the particles and also the premixing of PLGA with CEL. It is also interesting to note that no correlation was observed between the EE and flow rate.
3.2.3. Compositional features
The internal structure of the microspheres was studied using FIB/SEM to determine whether the particles had a porous or a solid internal structure (figure 4). It was demonstrated that the particles could be sectioned using a weak FIB beam without melting or collapse of the internal particle structure. It was not possible to see from the images whether the drug was distributed evenly within the microspheres or as aggregates. The images in figure 4 indicate that all the samples examined had a porous interior to some degree. Sample 7 was the most porous of the three samples with large holes dominating its interior. The other two samples had a less porous profile with sample 5 being slightly more porous than sample 2. This indicates that the inner porosity decreases with an increase in solute concentration and thereby with increasing solution viscosity.
The creation of pores inside the particles can be explained by several factors that have an influence on the formation of particles from droplets. A droplet initially shrinks as the solvent evaporates from its surface and the solutes diffuse towards its core until a shell forms. When the solvent evaporation takes place quicker than the solute diffusion, the particle shell forms at an early stage resulting in solvent trapped within the shell [61]. As solvent evaporates through the shell, it may leave behind pores and further lead to pores on the particle surface. A study by Park & Lee [21] demonstrated that the type of solvent used for electrospraying also influenced the porosity of the particles, with low-boiling-point solvent resulting in more porous particles than high-boiling-point solvents. The solvent used in this study, acetonitrile, has a relatively low boiling point of 82°C and is likely to have evaporated more quickly than the diffusion of solutes towards the core resulting in early shell formation. The higher degree of porosity observed for particles prepared at 3 per cent solute concentration compared with particles prepared at 5 and 7 per cent solute concentration is most probably due to the larger volume of solvent that needed to escape the particle core and the lower polymer concentration present to maintain the inner particle structure. The drug loading is likely to have had a similar but smaller effect on particle porosity by altering the polymer concentration of the solution, with high drug loading resulting in more porosity. The flow rate has been demonstrated to have a great influence on droplet size, and with a lower surface-to-volume ratio of large droplets these result in slower particle formation and would have more solvent entrapped within their shell. Particles prepared at high flow rates are thus likely to be more porous than particles prepared at low flow rates. This is also indicated by the porous surfaces of particles prepared at 50 µl min−1 (figure 2c,i).
The presence of pores increases the surface-area-to-volume ratio of the particles and also increases the diffusivity of molecules through the polymer matrix. This is bound to have a significant effect on the drug-release profile but has also been suggested to reduce the autocatalytic effect of PLGA by increasing the diffusivity of acids, therefore limiting polymer degradation [62]. Porous drug-loaded particles have in some cases produced a more linear release profile than non-porous particles [17].
The physical form of the drug and polymer was studied using XRPD and selected diffractograms are shown in figure 5. The curves indicate that CEL is crystalline both in its pure form and when physically mixed with PLGA, shown by the strong characteristic peaks. PLGA is amorphous on its own and does not contribute to the crystallinity observed when mixed with CEL. The electrosprayed microspheres (figure 5d) do not show any crystalline peaks whatsoever and are thus assumed to be amorphous. Particles with drug loading between 10 and 30 wt% were tested and although some are not included in this figure, all samples showed similar curves without any peaks. This indicates that CEL is molecularly dispersed within the polymer matrix.
Figure 5.
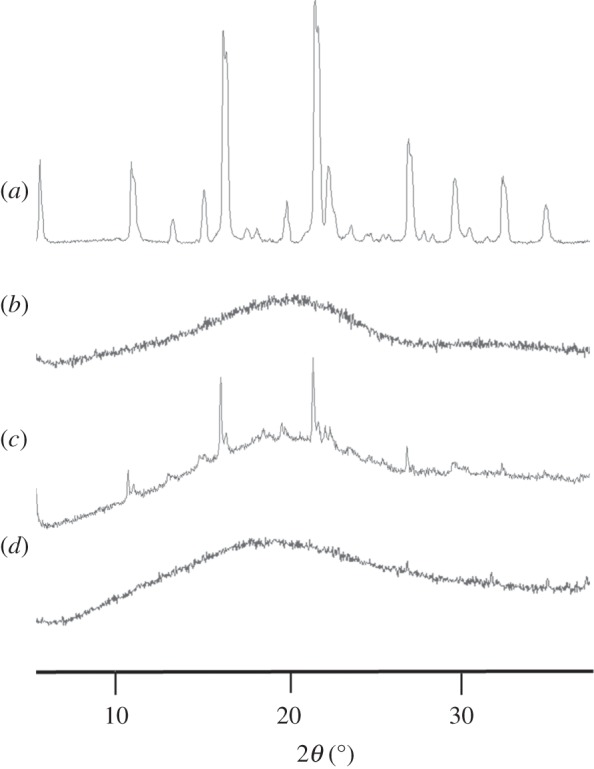
XRPD diffractograms of (a) pure CEL, (b) pure PLGA, (c) physical mixture of CEL and PLGA (20 wt% drug) and (d) electrosprayed CEL and PLGA (20 wt% drug).
3.3. Physical stability
The drug-loaded microspheres were kept in a climate chamber at a temperature of 20°C and a relative humidity of 60 per cent at all times after particle preparation for physical stability studies. A well-known disadvantage of solid dispersions and amorphous drugs, in general, is their instability under storage [63]. With this in mind, the solid-state stability of the produced particles was studied for a period of eight months using XRPD analysis to detect possible changes in crystallinity.
Figure 6 shows XRPD diffractograms of microspheres captured with two months intervals. No visible changes were observed during the eight months in storage, which indicates good physical stability. To further support these findings, SEM images were taken from samples after eight months of storage and it was observed that the particles still maintained their shape and size, indicating no crystalline growth or agglomeration.
Figure 6.
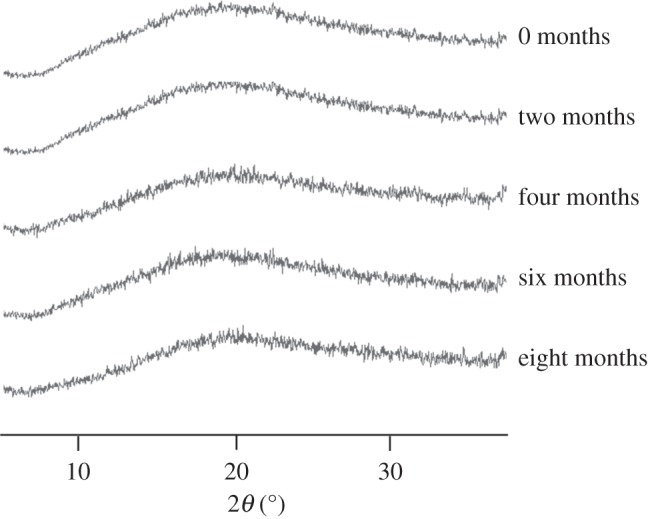
XRPD diffractograms of microspheres taken over a time span of eight months.
3.4. Drug-release study
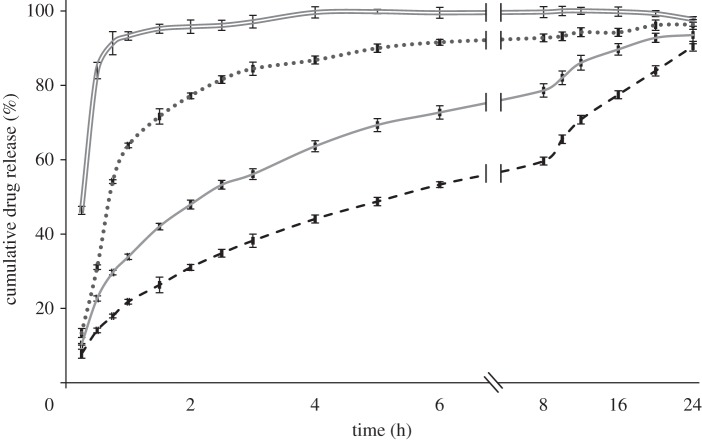
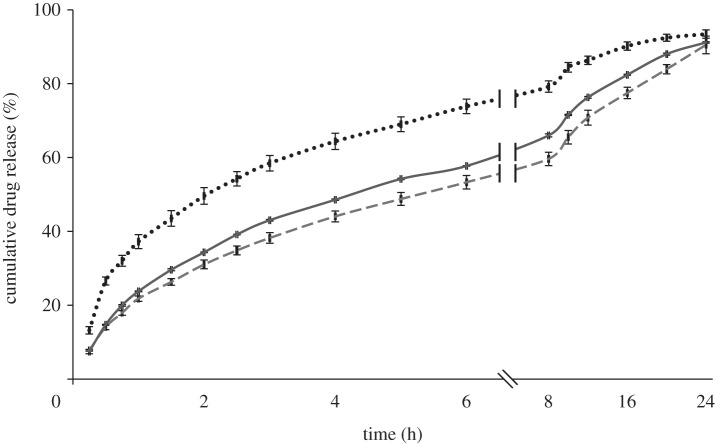
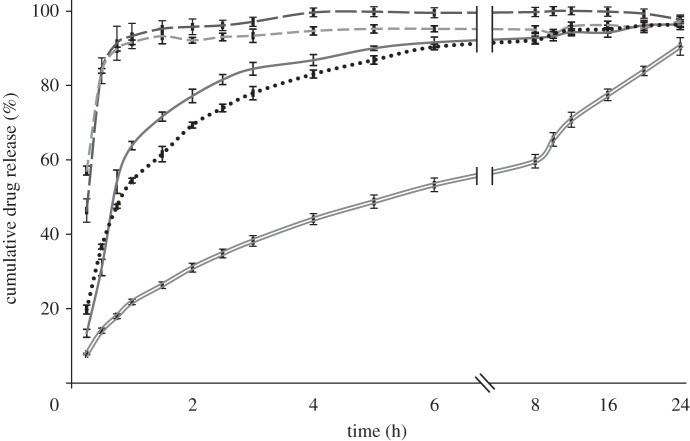
The influence of the different operating and formulation parameters on the drug-release kinetics was studied using a standard USP 2. In order to investigate the effect of different particle properties such as size and porosity, release studies were conducted for all samples. CEL release profiles from the microspheres are shown in figures 7–9. As observed, drug release from the polymer matrix took place at a rate that varied over time, involving an initial burst release followed by a diffusion-driven release. Generally, a small burst release was observed, of the order of 10 per cent, with some exceptions. This was then followed by a high initial release rate of the drug located near the surface. Finally, a diffusion-dependent release was seen over a period of hours. Figure 7 shows that pure CEL dissolves almost instantaneously, while the microspheres released between 90 and 96 per cent of the drug during the 24 h of measurement. The drug-release rates increased as the solute concentration was reduced, and sample 2 with the highest solute concentration showed the closest to linear release. The influence of drug loading on drug release (figure 8) showed a significant difference for both the solute concentrations examined. An increase in drug loading resulted in increased drug-release rates in both cases. The influence of flow rate on drug release (figure 9) did not show as clear a trend as the other two figures did. Both samples 1 and 3 released their payload more quickly than sample 2.
Figure 7.
Drug-release profile of microspheres prepared with different solute concentrations, with 10% drug loading and at a flow rate of 30 µl min−1, measured over 24 h. Double solid line, pure CEL; dotted line, 3% solute; solid line, 5% solute; dashed line, 7% solute.
Figure 9.
Drug-release profile of microspheres prepared at different flow rates, with 7% solute concentration and 10% drug loading, measured over 24 h. Dotted line, 10 μl min−1; dashed lines, 30 μl min−1; solid line, 50 μl min−1.
Figure 8.
Drug-release profile of microspheres prepared with different drug loading at a flow rate of 30 µl min−1, measured over 24 h. Long dashed lines, pure CEL; dashed lines, 3% solute, 30% CEL; grey solid line, 3% solute, 10% CEL; dotted line, 7% solute, 30% CEL; double solid lines, 7% solute, 10% CEL.
Figures 7 and 8 indicate that size, porosity and drug loading of the particles all have an influence on the measured drug-release patterns. As the size of the particles was reduced, an increase in the drug-release rate was observed. This is a result of an increase in the surface-area-to-volume ratio of the particles as the size is reduced, which increases the dissolution rate according to the Noyes–Whitney equation and is not surprising [63]. The degree of porosity observed from the cross-section images was inversely proportional to the size of the particles in figure 7 and also seemed to influence the release rate. The drug release increased with an increase in porosity, which can again be explained by an increase in the surface-area-to-volume ratio, but this time due to increased access to the core of the particle through the pores. It is however difficult to distinguish between the effect of size and porosity based on the data available. The effect of drug loading on drug release is consistent with other similar studies [16,48] and may have two explanations; that the increased drug loading reduces the relative amount of polymer acting as a diffusional barrier; or that the drug is phase-separated from the polymer matrix and increased release occurs via pores created by the drug. Both of these phenomena may play a role in the increased release rate observed. There were some discrepancies in the relationship between particle size and drug-release rate observed in figure 9, where particles from sample 3 given their larger size were expected to release drug more slowly than particles from sample 2. This finding is likely a result of the highly porous surface observed for particles from sample 3. Again, the porosity resulted in an increased surface-area-to-volume ratio, which in turn increased the release rate.
Most of the samples did not reach above 90 per cent release during the 24 h of measurement, indicating that there was still drug entrapped within the polymer matrix. Degradation of PLGA typically does not take place within this time span and this explains the residual drug trapped within the polymer network.
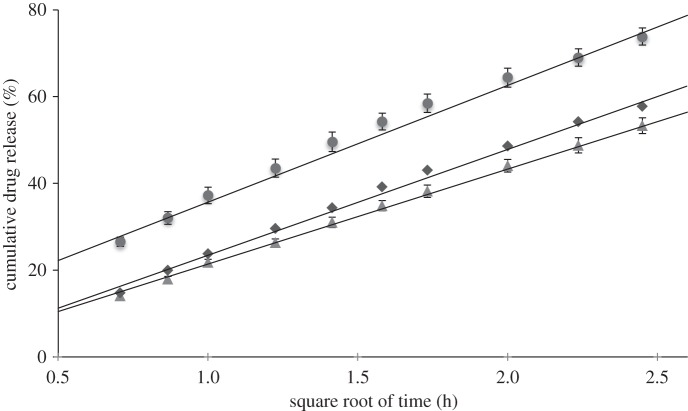
Release of CEL from the microspheres mainly takes place via diffusion-dependent release and this is demonstrated by fitting the release data from figure 9 with the Higuchi model. Drug release in the Higuchi model is based under the assumptions that the drug molecules are homogeneously distributed within a solid matrix and are released from the surface via diffusion mediated by the surrounding solvent. According to this model, drug release takes place linearly as a function of the square root of time. Figure 10 shows the release curves of microspheres prepared with 7 per cent solute concentration and 10 per cent drug loading as a function of the square root of time. All three curves were fitted with linear regression and gave the dissolution constants 27, 22 and 24 for 10, 30 and 50 µl min−1, respectively. It is observed that the curves can be fitted to a linear trend line over the first 6 h of drug release as shown in the figure. From then onwards, drug release slows down and does not follow the model in the last 18 h. The fitted curves confirm that the major part of the drug release from these particle samples is controlled by diffusion. However, the Higuchi model did not apply well on the drug release from microspheres prepared with less than 5 per cent solute concentration and with drug loading above 20 per cent and the fitted release curves for these samples are therefore not shown. It is believed that the model did not fit on these samples owing to their larger degree of porosity inside the particles and the lower diffusion barrier provided by PLGA with increasing drug loading.
Figure 10.
Drug-release curves fitted to the Higuchi model for microspheres prepared with 7% solute concentration and 10% drug loading. Circles, 10 μl min−1; triangles, 30 μl min−1; diamonds, 50 μl min−1.
Different processing parameters and their influence on particle characteristics and drug release were studied to determine the optimal parameters for this experimental set-up. However, this would depend on the specific application of the microparticles. It was noticed that the jet was less stable when prepared at 50 µl min−1 and thus resulted in less monodisperse particles, especially at higher drug loading. Amorphous CEL was found for all samples and physical stability between the samples could not be distinguished. It was observed that even small changes in particle size and porosity resulted in significant differences in their release profile. Particles prepared at a solute concentration of 3 per cent and/or a drug loading of 30 per cent resulted in quick release owing to their smaller size, high porosity or reduced diffusion barrier and could not be fitted to a common release curve. Particles prepared at 5 or 7 per cent solute concentration with a drug loading of 10 per cent and at a flow rate of 10–30 µl min−1 thus seem the most suitable and depending on the desired release rate, these parameters can be chosen accordingly.
4. Conclusions
This study demonstrates that electrospraying is a precise and controllable technique for producing microparticles with pharmaceutically useful physico-chemical properties. The size and morphology of CEL-loaded electrosprayed PLGA microparticles particles can be controlled by adjusting the flow rate, solute concentration and drug loading, with flow rate having the greatest influence. The porous inner structure of the particles was explained by an early shell formation and subsequent evaporation of acetonitrile during particle formation. Particle porosity was found to be dependent on solvent concentration, but this remains to be investigated in detail. Although, XRPD analysis demonstrated that CEL was amorphous within the PLGA matrix, the particles were physically stable for more than eight months. In addition, high entrapment efficiencies were observed compared with conventional fabrication techniques, indicating that electrospraying is potentially attractive for the processing of expensive pharmaceutical ingredients. The release of CEL from the particles could be controlled to provide a rapid release over a few hours or a sustained release over 24 h. Particle size, porosity and drug loading had the greatest influence on the release rate. Careful control of the drug distribution within particles would greatly impact the drug-release mechanism, possibly resulting in a more useful delayed release behaviour with improved bioavailability and therapeutic efficacy.
Acknowledgments
The authors thank the Danish Agency for Science Technology and Innovation and Veloxis Pharmaceuticals A/S for financial support of this project. Further, we thank Prof. Jukka Rantanen, University of Copenhagen, and Dr Suguo Huo, London Centre for Nanotechnology, for the use of XRPD and FIB/SEM respectively.
References
- 1.Lipinski C. A., Lombardo F., Dominy B. W., Feeney P. J. 1997. Experimental and computational approaches to estimate solubility and permeability in drug discovery and development settings. Adv. Drug Deliv. Rev. 23, 3–25 10.1016/S0169-409X(96)00423-1 (doi:10.1016/S0169-409X(96)00423-1) [DOI] [PubMed] [Google Scholar]
- 2.Lobenberg R., Amidon G. L. 2000. Modern bioavailability, bioequivalence and biopharmaceutics classification system. New scientific approaches to international regulatory standards. Eur. J. Pharm. Biopharm. 50, 3–12 10.1016/S0939-6411(00)00091-6 (doi:10.1016/S0939-6411(00)00091-6) [DOI] [PubMed] [Google Scholar]
- 3.Leuner C., Dressman J. 2000. Improving drug solubility for oral delivery using solid dispersions. Eur. J. Pharm. Biopharm. 50, 47–60 10.1016/S0939-6411(00)00076-X (doi:10.1016/S0939-6411(00)00076-X) [DOI] [PubMed] [Google Scholar]
- 4.Rasenack N., Müller B. W. 2004. Micron-size drug particles: common and novel micronization techniques. Pharm. Dev. Technol. 9, 1–13 10.1081/PDT-120027417 (doi:10.1081/PDT-120027417) [DOI] [PubMed] [Google Scholar]
- 5.Pouton C. W. 2006. Formulation of poorly water-soluble drugs for oral administration: physicochemical and physiological issues and the lipid formulation classification system. Eur. J. Pharm. Sci. 29, 278–287 10.1016/j.ejps.2006.04.016 (doi:10.1016/j.ejps.2006.04.016) [DOI] [PubMed] [Google Scholar]
- 6.Huang L. F., Tong W. Q. 2004. Impact of solid state properties on developability assessment of drug candidates. Adv. Drug Deliv. Rev. 56, 321–334 10.1016/j.addr.2003.10.007 (doi:10.1016/j.addr.2003.10.007) [DOI] [PubMed] [Google Scholar]
- 7.Saharan V., Kukkar V., Kataria M., Gera M., Choudhury P. 2009. Dissolution enhancement of drugs. I. technologies and effect of carriers. Int. J. Health Res. 2, 107–124 [Google Scholar]
- 8.Pouton C. W. 2000. Lipid formulations for oral administration of drugs: non-emulsifying, self-emulsifying and self-microemulsifying drug delivery systems. Eur. J. Pharm. Sci. 11, 93–98 10.1016/S0928-0987(00)00167-6 (doi:10.1016/S0928-0987(00)00167-6) [DOI] [PubMed] [Google Scholar]
- 9.Hancock B. C., Parks M. 2000. What is the true solubility advantage for amorphous pharmaceuticals? Pharm. Res. 17, 397–404 10.1023/A:1007516718048 (doi:10.1023/A:1007516718048) [DOI] [PubMed] [Google Scholar]
- 10.Chawla G., Bansal A. K. 2007. A comparative assessment of solubility advantage from glassy and crystalline forms of a water-insoluble drug. Eur. J. Pharm. Sci. 32, 45–57 10.1016/j.ejps.2007.05.111 (doi:10.1016/j.ejps.2007.05.111) [DOI] [PubMed] [Google Scholar]
- 11.Serajuddin A. T. 1999. Solid dispersion of poorly water-soluble drugs: early promises, subsequent problems, and recent breakthroughs. J. Pharm. Sci. 88, 1058–1066 10.1021/js980403l (doi:10.1021/js980403l) [DOI] [PubMed] [Google Scholar]
- 12.Wischke C., Schwendeman S. P. 2008. Principles of encapsulating hydrophobic drugs in PLA/PLGA microparticles. Int. J. Pharm. 364, 298–327 10.1016/j.ijpharm.2008.04.042 (doi:10.1016/j.ijpharm.2008.04.042) [DOI] [PubMed] [Google Scholar]
- 13.Hill V., Passerini N., Craig D., Vickers M., Anwar J., Feely L. 1998. Investigation of progesterone loaded poly(d,l-lactide) microspheres using TMDSC, SEM and PXRD. J. Thermal Anal. Calorimetry 54, 673–685 10.1023/A:1010167214806 (doi:10.1023/A:1010167214806) [DOI] [Google Scholar]
- 14.Edlund U., Albertsson A. 2002. Degradable polymer microspheres for controlled drug delivery. Degradable aliphatic polyesters, pp. 67–112, 157 edn. Berlin, Germany: Springer [Google Scholar]
- 15.Uhrich K. E., Cannizzaro S. M., Langer R. S., Shakesheff K. M. 1999. Polymeric systems for controlled drug release. Chem. Rev. 99, 3181–3198 10.1021/cr940351u (doi:10.1021/cr940351u) [DOI] [PubMed] [Google Scholar]
- 16.Berkland C., King M., Cox A., Kim K., Pack D. W. 2002. Precise control of PLG microsphere size provides enhanced control of drug release rate. J. Control. Release 82, 137–147 10.1016/S0168-3659(02)00136-0 (doi:10.1016/S0168-3659(02)00136-0) [DOI] [PMC free article] [PubMed] [Google Scholar]
- 17.Klose D., Siepmann F., Elkharraz K., Krenzlin S., Siepmann J. 2006. How porosity and size affect the drug release mechanisms from PLGA-based microparticles. Int. J. Pharm. 314, 198–206 10.1016/j.ijpharm.2005.07.031 (doi:10.1016/j.ijpharm.2005.07.031) [DOI] [PubMed] [Google Scholar]
- 18.Kim H. K., Chung H. J., Park T. G. 2006. Biodegradable polymeric microspheres with ‘open/closed’ pores for sustained release of human growth hormone. J. Control. Release 112, 167–174 10.1016/j.jconrel.2006.02.004 (doi:10.1016/j.jconrel.2006.02.004) [DOI] [PubMed] [Google Scholar]
- 19.Choi H. S., Seo S. A., Khang G., Rhee J. M., Lee H. B. 2002. Preparation and characterization of fentanyl-loaded PLGA microspheres: in vitro release profiles. Int. J. Pharm. 234, 195–203 10.1016/S0378-5173(01)00968-1 (doi:10.1016/S0378-5173(01)00968-1) [DOI] [PubMed] [Google Scholar]
- 20.Ding L., Lee T., Wang C. H. 2005. Fabrication of monodispersed Taxol-loaded particles using electrohydrodynamic atomization. J. Control. Release 102, 395–413 10.1016/j.jconrel.2004.10.011 (doi:10.1016/j.jconrel.2004.10.011) [DOI] [PubMed] [Google Scholar]
- 21.Park C. H., Lee J. 2009. Electrosprayed polymer particles: effect of the solvent properties. J. Appl. Polym. Sci. 114, 430–437 10.1002/app.30498 (doi:10.1002/app.30498) [DOI] [Google Scholar]
- 22.Mu L., Feng S. S. 2001. Fabrication, characterization and in vitro release of paclitaxel (Taxol) loaded poly (lactic-co-glycolic acid) microspheres prepared by spray drying technique with lipid/cholesterol emulsifiers. J. Control. Release 76, 239–254 10.1016/S0168-3659(01)00440-0 (doi:10.1016/S0168-3659(01)00440-0) [DOI] [PubMed] [Google Scholar]
- 23.Zgoulli S. 1999. Microencapsulation of erythromycin and clarithromycin using a spray-drying technique. J. Microencapsul. 16, 565–571 10.1080/026520499288762 (doi:10.1080/026520499288762) [DOI] [PubMed] [Google Scholar]
- 24.Ambike A. A., Mahadik K. R., Paradkar A. 2005. Spray-dried amorphous solid dispersions of simvastatin, a low TG drug: in vitro and in vivo evaluations. Pharm. Res. 22, 990–998 10.1007/s11095-005-4594-z (doi:10.1007/s11095-005-4594-z) [DOI] [PubMed] [Google Scholar]
- 25.Chawla G., Gupta P., Thilagavathi R., Chakraborti A. K., Bansal A. K. 2003. Characterization of solid-state forms of celecoxib. Eur. J. Pharm. Sci. 20, 305–317 10.1016/S0928-0987(03)00201-X (doi:10.1016/S0928-0987(03)00201-X) [DOI] [PubMed] [Google Scholar]
- 26.Amrite A. C., Ayalasomayajula S. P., Cheruvu N. P. S., Kompella U. B. 2006. Single periocular injection of celecoxib-PLGA microparticles inhibits diabetes-induced elevations in retinal PGE2, VEGF, and vascular leakage. Invest. Ophthalmol. Vis. Sci. 47, 1149–1160 10.1167/iovs.05-0531 (doi:10.1167/iovs.05-0531) [DOI] [PMC free article] [PubMed] [Google Scholar]
- 27.Ganan-Calvo A. M., Gordillo J. M. 2001. Perfectly monodisperse microbubbling by capillary flow focusing. Phys. Rev. Lett. 87, 274 501. 10.1103/PhysRevLett.87.274501 (doi:10.1103/PhysRevLett.87.274501) [DOI] [PubMed] [Google Scholar]
- 28.Yurteri C. U., Hartman R. P. A., Marijnissen J. C. M. 2010. Producing pharmaceutical particles via electrospraying with an emphasis on nano and nano structured particles—a review. KONA Powder Part J. 28, 91–115 [Google Scholar]
- 29.Xie J., Ng W. J., Lee L. Y., Wang C. H. 2008. Encapsulation of protein drugs in biodegradable microparticles by co-axial electrospray. J. Colloid Interface Sci. 317, 469–476 10.1016/j.jcis.2007.09.082 (doi:10.1016/j.jcis.2007.09.082) [DOI] [PubMed] [Google Scholar]
- 30.Lee Y. H., Mei F., Bai M. Y., Zhao S., Chen D. R. 2010. Release profile characteristics of biodegradable-polymer-coated drug particles fabricated by dual-capillary electrospray. J. Control. Release 145, 58–65 10.1016/j.jconrel.2010.03.014 (doi:10.1016/j.jconrel.2010.03.014) [DOI] [PubMed] [Google Scholar]
- 31.Valo H., Peltonen L., Vehvilainen S., Karjalainen M., Kostiainen R., Laaksonen T., Hirvonen J. 2009. Electrospray encapsulation of hydrophilic and hydrophobic drugs in poly(l-lactic acid) nanoparticles. Small 5, 1791–1798 10.1002/smll.200801907 (doi:10.1002/smll.200801907) [DOI] [PubMed] [Google Scholar]
- 32.Xie J., Marijnissen J. C., Wang C. H. 2006. Microparticles developed by electrohydrodynamic atomization for the local delivery of anticancer drug to treat C6 glioma in vitro. Biomaterials 27, 3321–3332 10.1016/j.biomaterials.2006.01.034 (doi:10.1016/j.biomaterials.2006.01.034) [DOI] [PubMed] [Google Scholar]
- 33.Enayati M., Ahmad Z., Stride E., Edirisinghe M. 2009. Preparation of polymeric carriers for drug delivery with different shape and size using an electric jet. Curr. Pharm. Biotechnol. 10, 600–608 10.2174/138920109789069323 (doi:10.2174/138920109789069323) [DOI] [PubMed] [Google Scholar]
- 34.Jaworek A. 2008. Electrostatic micro- and nanoencapsulation and electroemulsification: a brief review. J. Microencapsul. 25, 443–468 10.1080/02652040802049109 (doi:10.1080/02652040802049109) [DOI] [PubMed] [Google Scholar]
- 35.Verreck G., Chun I., Peeters J., Rosenblatt J., Brewster M. E. 2003. Preparation and characterization of nanofibers containing amorphous drug dispersions generated by electrostatic spinning. Pharm. Res. 20, 810–817 10.1023/A:1023450006281 (doi:10.1023/A:1023450006281) [DOI] [PubMed] [Google Scholar]
- 36.Xu Y., Hanna M. A. 2006. Electrospray encapsulation of water-soluble protein with polylactide. Effects of formulations on morphology, encapsulation efficiency and release profile of particles. Int. J. Pharm. 320, 30–36 10.1016/j.ijpharm.2006.03.046 (doi:10.1016/j.ijpharm.2006.03.046) [DOI] [PubMed] [Google Scholar]
- 37.Higuchi T. 1963. Mechanism of sustained-action medication. Theoretical analysis of rate of release of solid drugs dispersed in solid matrices. J. Pharm. Sci. 52, 1145–1149 10.1002/jps.2600521210 (doi:10.1002/jps.2600521210) [DOI] [PubMed] [Google Scholar]
- 38.Chang M. W., Stride E., Edirisinghe M. 2010. A new method for the preparation of monoporous hollow microspheres. Langmuir 26, 5115–5121 10.1021/la903592s (doi:10.1021/la903592s) [DOI] [PubMed] [Google Scholar]
- 39.Almería B., Deng W., Fahmy T. M., Gomez A. 2010. Controlling the morphology of electrospray-generated PLGA microparticles for drug delivery. J. Colloid Interface Sci. 343, 125–133 10.1016/j.jcis.2009.10.002 (doi:10.1016/j.jcis.2009.10.002) [DOI] [PubMed] [Google Scholar]
- 40.Champion J. A., Katare Y. K., Mitragotri S. 2007. Particle shape: a new design parameter for micro- and nanoscale drug delivery carriers. J. Control. Release 121, 3–9 10.1016/j.jconrel.2007.03.022 (doi:10.1016/j.jconrel.2007.03.022) [DOI] [PMC free article] [PubMed] [Google Scholar]
- 41.Klose D., Siepmann F., Elkharraz K., Siepmann J. 2008. PLGA-based drug delivery systems: importance of the type of drug and device geometry. Int. J. Pharm. 354, 95–103 10.1016/j.ijpharm.2007.10.030 (doi:10.1016/j.ijpharm.2007.10.030) [DOI] [PubMed] [Google Scholar]
- 42.Xie J., Wang C. H. 2007. Encapsulation of proteins in biodegradable polymeric microparticles using electrospray in the Taylor cone-jet mode. Biotechnol. Bioeng. 97, 1278–1290 10.1002/bit.21334 (doi:10.1002/bit.21334) [DOI] [PubMed] [Google Scholar]
- 43.McCarron P. A., Donnelly R. F., Marouf W. 2006. Celecoxib-loaded poly(d,l-lactide-co-glycolide) nanoparticles prepared using a novel and controllable combination of diffusion and emulsification steps as part of the salting-out procedure. J. Microencapsul. 23, 480–498 10.1080/02652040600682390 (doi:10.1080/02652040600682390) [DOI] [PubMed] [Google Scholar]
- 44.Kim T. H., Jeong Y. I., Jin S. G., Pei J., Jung T. Y., Kim I. Y., Kang S. S., Jung S. 2011. Preparation of polylactide-co-glycolide nanoparticles incorporating celecoxib and their antitumor activity against brain tumor cells. Int. J. Nanomed. 6, 2621–2631 10.2147/IJN.S19497 (doi:10.2147/IJN.S19497) [DOI] [PMC free article] [PubMed] [Google Scholar]
- 45.Zvonar A., Kristl J., Ker-ì J., Grabnar P. A. 2009. High celecoxib-loaded nanoparticles prepared by a vibrating nozzle device. J. Microencapsul. 26, 748–759 10.3109/02652040802584402 (doi:10.3109/02652040802584402) [DOI] [PubMed] [Google Scholar]
- 46.Bohr A., Kristensen J., Stride E., Dyas M., Edirisinghe M. 2011. Preparation of microspheres containing low solubility drug compound by electrohydrodynamic spraying. Int. J. Pharm. 412, 59–67 10.1016/j.ijpharm.2011.04.005 (doi:10.1016/j.ijpharm.2011.04.005) [DOI] [PubMed] [Google Scholar]
- 47.Walton W. H. 1948. Feret's statistical diameter as a measure of particle size. Nature 1, 329–330 10.1038/162329b0 (doi:10.1038/162329b0) [DOI] [Google Scholar]
- 48.Pinon-Segundo E., Ganem-Quintanar A., Alonso-Perez V., Quintanar-Guerrero D. 2005. Preparation and characterization of triclosan nanoparticles for periodontal treatment. Int. J. Pharm. 294, 217–232 10.1016/j.ijpharm.2004.11.010 (doi:10.1016/j.ijpharm.2004.11.010) [DOI] [PubMed] [Google Scholar]
- 49.Washington C. 1990. Drug release from microdisperse systems: a critical review. Int. J. Pharm. 58, 1–12 10.1016/0378-5173(90)90280-H (doi:10.1016/0378-5173(90)90280-H) [DOI] [Google Scholar]
- 50.Vehring R. 2008. Pharmaceutical particle engineering via spray drying. Pharm. Res. 25, 999–1022 10.1007/s11095-007-9475-1 (doi:10.1007/s11095-007-9475-1) [DOI] [PMC free article] [PubMed] [Google Scholar]
- 51.Gomez A., Bingham D., Juan L. D., Tang K. 1998. Production of protein nanoparticles by electrospray drying. J. Aerosol Sci. 29, 561–574 10.1016/S0021-8502(97)10031-3 (doi:10.1016/S0021-8502(97)10031-3) [DOI] [Google Scholar]
- 52.Smith J. N., Flagan R. C., Beauchamp J. L. 2002. Droplet evaporation and discharge dynamics in electrospray ionization. J. Phys. Chem. A 106, 9957–9967 10.1021/jp025723e (doi:10.1021/jp025723e) [DOI] [Google Scholar]
- 53.Enayati M., Ahmad Z., Stride E., Edirisinghe M. 2010. One-step electrohydrodynamic production of drug-loaded micro- and nanoparticles. J. R. Soc. Interface 7, 667–675 10.1098/rsif.2009.0348 (doi:10.1098/rsif.2009.0348) [DOI] [PMC free article] [PubMed] [Google Scholar]
- 54.Bittner B., Kissel T. 1999. Ultrasonic atomization for spray drying: a versatile technique for the preparation of protein loaded biodegradable microspheres. J. Microencapsul. 16, 325–341 10.1080/026520499289059 (doi:10.1080/026520499289059) [DOI] [PubMed] [Google Scholar]
- 55.Jaworek A., Sobczyk A. T. 2008. Electrospraying route to nanotechnology: an overview. J. Electrost. 66, 197–219 10.1016/j.elstat.2007.10.001 (doi:10.1016/j.elstat.2007.10.001) [DOI] [Google Scholar]
- 56.Rohner T. C., Lion N., Girault H. H. 2004. Electrochemical and theoretical aspects of electrospray ionisation. Phys. Chem. Chem. Phys. 6, 3056–3068 10.1039/b316836k (doi:10.1039/b316836k) [DOI] [Google Scholar]
- 57.Maa Y. F., Nguyen P. A., Hsu S. W. 1998. Spray-drying of air–liquid interface sensitive recombinant human growth hormone. J. Pharm. Sci. 87, 152–159 10.1021/js970308x (doi:10.1021/js970308x) [DOI] [PubMed] [Google Scholar]
- 58.Sollohub K., Cal K. 2010. Spray drying technique. II. Current applications in pharmaceutical technology. J. Pharm. Sci. 99, 587–597 10.1002/jps.21963 (doi:10.1002/jps.21963) [DOI] [PubMed] [Google Scholar]
- 59.Delie F., Berton M., Allemann E., Gurny R. 2001. Comparison of two methods of encapsulation of an oligonucleotide into poly(d,l-lactic acid) particles. Int. J. Pharm. 214, 25–30 10.1016/S0378-5173(00)00627-X (doi:10.1016/S0378-5173(00)00627-X) [DOI] [PubMed] [Google Scholar]
- 60.Tewes F., et al. 2007. Comparative study of doxorubicin-loaded poly(lactide-co-glycolide) nanoparticles prepared by single and double emulsion methods. Eur. J. Pharm. Biopharm. 66, 488–492 10.1016/j.ejpb.2007.02.016 (doi:10.1016/j.ejpb.2007.02.016) [DOI] [PubMed] [Google Scholar]
- 61.Yao J., Kuang Lim L., Xie J., Hua J., Wang C. H. 2008. Characterization of electrospraying process for polymeric particle fabrication. J. Aerosol Sci. 39, 987–1002 10.1016/j.jaerosci.2008.07.003 (doi:10.1016/j.jaerosci.2008.07.003) [DOI] [Google Scholar]
- 62.Siepmann J., Elkharraz K., Siepmann F., Klose D. 2005. How autocatalysis accelerates drug release from PLGA-based microparticles: a quantitative treatment. Biomacromolecules 6, 2312–2319 10.1021/bm050228k (doi:10.1021/bm050228k) [DOI] [PubMed] [Google Scholar]
- 63.Kaushal A. M., Gupta P., Bansal A. K. 2004. Amorphous drug delivery systems: molecular aspects, design, and performance. Crit. Rev. Ther. Drug Carrier Syst. 21, 133–193 10.1615/CritRevTherDrugCarrierSyst.v21.i3.10 (doi:10.1615/CritRevTherDrugCarrierSyst.v21.i3.10) [DOI] [PubMed] [Google Scholar]


