

Abstract
Antigenically evolving pathogens such as influenza viruses are difficult to control owing to their ability to evade host immunity by producing immune escape variants. Experimental studies have repeatedly demonstrated that viral immune escape variants emerge more often from immunized hosts than from naive hosts. This empirical relationship between host immune status and within-host immune escape is not fully understood theoretically, nor has its impact on antigenic evolution at the population level been evaluated. Here, we show that this relationship can be understood as a trade-off between the probability that a new antigenic variant is produced and the level of viraemia it reaches within a host. Scaling up this intra-host level trade-off to a simple population level model, we obtain a distribution for variant persistence times that is consistent with influenza A/H3N2 antigenic variant data. At the within-host level, our results show that target cell limitation, or a functional equivalent, provides a parsimonious explanation for how host immune status drives the generation of immune escape mutants. At the population level, our analysis also offers an alternative explanation for the observed tempo of antigenic evolution, namely that the production rate of immune escape variants is driven by the accumulation of herd immunity. Overall, our results suggest that disease control strategies should be further assessed by considering the impact that increased immunity—through vaccination—has on the production of new antigenic variants.
Keywords: viral evolution, intra-host dynamics, immune escape
1. Introduction
Many important infectious diseases of humans as well as non-human animals are caused by pathogens exhibiting antigenic variation. Some, such as malaria and dengue, consist of antigenically distinct, co-circulating strains that persist in a population over time. In others, antigenic variants appear de novo, resulting in the turnover of viral lineages or the accumulation of viral diversity. This de novo production of antigenic variants is observed especially in acute, semi-immunizing infectious pathogens such as influenza viruses, coronaviruses, norovirus and foot-and-mouth disease virus (FMDV). Understanding these patterns of viral antigenic variation has been a major topic of theoretical interest, and has led to a well-established understanding of the role of host immunity at the population level in selecting for antigenic strains [1–4]. However, the role of host immune status, defined as a host's prior immunity to an infecting strain, acquired through either vaccination or natural infection, in generating antigenic variants at the within-host level is still not well understood, despite experimental evidence clearly indicating that it is an important factor [5–10].
Support for the importance of host immune status in driving within-host antigenic change comes from multiple passage experiments. In one experiment, influenza strains Puerto Rico 8 (PR8) and 965 were passaged through chick embryos in either the absence or presence of partially immunizing antisera (figure 1a) [5]. The strain passaged in the presence of antisera evolved to be antigenically distinct from the original strain, whereas the strain passaged in the absence of antisera did not. In a similar series of experiments, PR8 was passaged through either non-vaccinated or homologously vaccinated mice [6–8]. The conclusions were consistent with the earlier findings in chick embryos: strains passaged serially through vaccinated mice demonstrated immune escape, whereas no such escape was detected in serial passages through naive mice (figure 1b). A recent study revisiting these experiments reported similar results (figure 1c(i)) [10]. Similar observations have also been made in FMDV [9]: passages through mammalian BHK-21 cells in the presence of antibodies led to antigenically significant amino acid substitutions, whereas passages through cells in the absence of antibodies did not (figure 1c(ii)).
Figure 1.

Evidence for the relationship between immune status and immune escape. (a) Influenza strains PR8 and 965 were passaged through chick embryos in the presence and absence of partially neutralizing antisera. Titres are shown for haemagglutination inhibition (HI) assays between wild-type antisera and the strain passaged in the presence of antisera (black), the strain passaged in the absence of antisera (light grey) and the wild-type strain (dark grey). Data are from [5]. (b) Similar experiment to (a) but with PR8 passaged instead through either homologously vaccinated or non-vaccinated mice. HI titres were consistent across antisera generated from mouse, hamster and ferret. Wild-type antisera were challenged with the strain passaged through vaccinated mice (black), the strain passaged through non-vaccinated mice (light grey) and the wild-type strain (dark grey). Data are from [6]. c(i) None of the three passages of PR8 through non-vaccinated mice resulted in antigenic change, whereas three out of three passages through vaccinated mice resulted in the emergence of new antigenic variants [10]. c(ii) No passages of FMDV through cells in the absence of antibodies led to antigenically significant amino acid changes, whereas all passages through cells in the presence of antibodies led to antigenically significant amino acid substitutions [9].
These experiments indicate that host immune status prior to challenge plays a role in the production of immune escape variants, and that this may be a general phenomenon across antigenically variable viruses. However, the specific physiological and immunological processes underlying this relationship are still not well understood. A major theoretical contribution towards its understanding was developed by Grenfell et al. [11], wherein the authors hypothesized a hump-shaped curve relating the strength of host immunity to the rate of immune escape. The increasing portion of this curve is consistent with data from the passage experiments reviewed earlier. The decreasing portion is not directly observed possibly because hosts with strong immunity may be asymptomatic and because the occurrence of immune escape in a strongly immune host would be rare and unlikely to be captured in an experimental setting. The authors used a population genetics model to demonstrate that the hump-shaped curve is the result of two opposing effects of host immunity. At higher levels of host immunity, selection pressure for immune escape increases, thus increasing the fixation rate of escape mutations. However, at higher levels of host immunity, viral abundance also decreases, lowering the overall number of mutants that arise.
Here, using an alternative approach in which intra-host dynamics are explicitly modelled, we derive a similar nonlinear curve relating immune status and host immune escape. Not only does this result support the general hypothesis of Grenfell and colleagues, but it additionally provides a mechanistic understanding of how immune status impacts immune escape. Such a mechanistic description of intra-host immune escape allows us to make specific predictions which can be tested in experimental settings. When we scale up this relationship between immune status and within-host immune escape to the population level, we find temporal patterns of antigenic evolution that are qualitatively consistent with that observed for influenza A antigenic variants in humans but which arise from a mechanism different from that hypothesized in previous studies [4,12–14].
2. The effect of immune status on the production of immune escape variants
We use a model of intra-host viral dynamics that captures key physiological and immunological processes to, first, understand the possible mechanisms through which host immune status affects immune escape, and, second, derive a general relationship between host immune status and the production of escape variants. Our model builds on existing intra-host models for influenza and similar acutely infecting diseases [15–24] by including within-host viral antigenic evolution and cross-immunity between variants.
We assume an infection is seeded by a single antigenic viral strain and is initially driven by the interaction of target cells and free viral particles of the infecting—henceforth also referred to as the resident—strain. These initial dynamics are given by
| 2.1 |
and
| 2.2 |
with initial conditions
where C is the target cell population and Vr is the viral load of the resident strain. β is the rate constant for depletion of target cells by viral particles, γ is the growth rate of viral particles and μ is the per virion mutation rate for antigenically novel variants. While we will refer to C as the target cell population for most of this paper, it can be interpreted more generally, a point we will return to in the discussion.
Host immune status is captured indirectly through the parameter δr, the neutralization rate of resident viral particles. For hosts naive to the resident strain, δr reflects only the effects of innate immunity and a background rate of viral clearance. For hosts with some level of immunity to the resident strain, either through vaccination or a previous infection with a cross-protective strain, δr includes the additional effect of the adaptive immune response on viral neutralization. When δr > γ C0, the viral population decreases exponentially upon infection and we take these values of δr to correspond to strong host immune status towards the resident strain.
To reflect the stochastic nature of the mutation process, we simulate this model stochastically using a midpoint tau-leap algorithm [25]. We model only mutations that affect antigenic properties of the virus. These antigenic mutants, which arise at rate μ per virion, compete with the resident and other mutant strains for target cells. We incorporate a mutant strain, denoted by  , by adding a depletion term to C and by including a new equation for the dynamics of the new strain. For example, after the first mutation
| 2.3 |
| 2.4 |
| 2.5 |
where t* is the time the mutation occurs and  is the neutralization rate of virions of type m1. We assume, unless otherwise stated, that antigenic mutants completely escape prior immunity so that the rate, δm, for all mutants reflects the innate immune response and a background rate of viral clearance. This assumption will be weakened later. The dynamics continue in this way, with the potential emergence of
  ,
,  and so on, until the infection has been cleared.
We remark that host immune status to a particular strain is modelled by a constant clearance rate, for example, δr,  , etc. The assumption that host immunity is constant for the duration of infection is based on observations that antibodies produced in response to naive infections are usually not detected until viraemia load has peaked and are therefore unlikely to impact intra-host dynamics [16,26,27]. We also assume, in line with other models, that target cell replenishment is negligible for the duration of infection [16,18,19,22].
Parametrized to capture influenza A viral load dynamics observed in volunteer studies (figure 2a) [19,28,29], this intra-host model yields dynamics that differ qualitatively between naive and immune hosts (figure 2b,c) in a manner consistent with the results from passage experiments. These dynamics suggest that immune escape is not often observed in naive hosts because, in the absence of an adaptive immune response, the resident infection rapidly depletes target cells, leaving mutant strains insufficient resources to grow (figure 2b). Only the mutants that arise early in the infection have sufficient target cells for growth, but even these must compete with the more established resident strain for resources, thereby limiting their viral load. Instead, immune escape may occur more frequently in immune or partially immune hosts because the resident viral population is cleared rapidly, leaving ample target cells to support an infection by a mutant variant, should one arise (figure 2c).
Figure 2.

Intra-host data and simulated intra-host dynamics. (a) Viral load dynamics in naive infected humans from volunteer experiments. Viral titre units are TCID50 ml−1 reproduced from [19,28,29]. For (b–e) solid blue line is resident viral load, enlarged in inset for (c,e), and dashed lines are mutant viral loads. (b,c) Stochastic simulations of the intra-host model with target cell limitation given by equations (2.3)–(2.5). Black solid line denotes the target cell population. δr = 3 per day for the naive case and δr = 9 per day for the immune case. The mutant strain is assumed to be a complete escape variant: δm = 3 per day. C0 = 4 × 10⁸ target cells (same as in [19], in the range given in [16]), clearance rate in a naive host is 3 per day (same as in [19,21], same order of magnitude as in [16,18]). Parameter values β and γ (see appendix A) were chosen to qualitatively match data in (a). (d,e) Simulations for a model where there is no target cell limitation, but antibody response plays a dynamic role (equations (2.6) and (2.7)): initial B cell population is 2 × 10⁸ for immune hosts. d is 3 per day. Parameters a, b, e chosen to qualitatively match data in (a). In all simulations, initial resident viral load is 105 virions (intermediate between [16,21]), μ = 10−6 per day and mutant strains have initial population of 1. Simulations were implemented using the midpoint tau-leap algorithm [25]. In (d) only the first three mutations are shown.
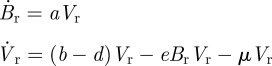
In contrast, these dynamics are not observed in a model with a dynamically changing adaptive immune response but without target cell limitation:
 |
2.6 |
and
 |
2.7 |
where Br is the B cell population corresponding to the resident variant and  is the B cell population for mutant variant i. b is the replication rate of the virus, d is the background rate of viral clearance and e is the viral clearance rate due to B cells. These equations assume that each B cell population grows linearly with its corresponding viral population. Immune status is reflected in the initial population of B cells corresponding to the resident variant with Br(0) = 0 in naive hosts. We assume no cross-immunity:
  in all hosts for all mutants, although this assumption can be relaxed without changing the conclusions described in the next paragraph.
This model, like the model given by equations (2.3)–(2.5), can also capture the viral load dynamics of a single strain infection and does so with fewer assumptions about specific intra-host mechanisms (figure 2d,e). We may therefore expect it to be sufficient for modelling immune escape dynamics. However, because there is no mechanism in this model that prevents mutant viral loads from reaching high levels, immune escape will occur more frequently in naive hosts than in immune hosts. This holds even in the presence of cross-immunity because any cross-protection that suppresses mutant growth in naive hosts will also suppress mutants in hosts with prior immunity. This suggests that to be consistent with empirical observations of immune escape, a minimal intra-host model requires a mechanism other than a dynamic antibody response. Given that a target cell population is necessary for viral replication and has frequently been incorporated in previous intra-host models [15–24] and given that its inclusion in the model described by equations (2.3)–(2.5) leads to intra-host escape dynamics consistent with passage experiments, it seems the most natural and parsimonious choice for this additional mechanism (but see §4).
Having established that a model that includes target cell limitation is minimal and consistent with empirical data, we use equations (2.1) and (2.2) to generalize the results from figure 2b,c and derive an explicit expression relating immune escape to host immune status. Central to our derivation is the calculation of the cumulative viral load—that is, the area under the viral load curve, which we call the ‘final size’ of a strain (appendix A). In figure 3a, we plot this for two initial target cell populations over a range of values for host immune status levels to the resident strain, δr. We use this final size calculation to approximate the probability that a mutation, which survives stochastic extinction, occurs (figure 3b) and the expected final size of a mutant strain (figure 3c).
Figure 3.

The relationship between immune status and immune escape and factors contributing to this relationship. (a) The final size of resident infection as a function of immune response, with two values of initial target cell populations c0 = 4 × 10⁸ and 3 × 10⁸. Inset shows plot on a log scale. (b) The probability that a mutant, which avoids stochastic extinction, occurs. Simulation results (dashed lines) are plotted along with the analytical values corresponding to them (solid lines). When comparing our analytical expression with simulations, there is no rigorous way to differentiate between a stochastic extinction and a mutant that avoids stochastic extinction but grows to a small final size. Thus, we count all mutants in the simulation that did not die out in the first day as avoiding extinction and plot the probability of these mutations, derived analytically (see the electronic supplementary material), as a comparison (darker solid lines). (c) Final size of a mutant. Inset shows left-most section of plot on a log scale. Vertical bars show one standard deviation away from simulation mean. (d) Product of first two curves, with simulation mean mutation final size. For (b–d), escape is assumed to be complete (no cross-protection) and colours correspond to mutation rates: μ = 10−6 (blue), μ = 10−7 (green) and μ = 10−8 per day (orange). (e) Same quantity as in (d) but with incomplete escape as reflected in increasing values of δm, the host immune status towards the mutant. For (b–e), dashed lines are simulation results based on 1000 runs of a midpoint tau-leap algorithm [25] and solid lines are analytical formulae.
Defining immune escape to be the occurrence of an antigenic mutant followed by the growth of the mutant to a sufficient final size, figure 3b illustrates how the former is related to host immune status and figure 3c, the latter. Thus, the product of the two curves yields the overall relationship between immune status and the generation of immune escape variants (figure 3d). This relationship exhibits a trade-off between the probability of generating a mutant variant and the cumulative viral load that it can reach. Hosts with weak prior immunity (low δr) against the resident infection are more likely to generate a mutant variant due to higher viral abundance, but have fewer target cells available for this new variant to increase to transmissible levels. On the other hand, hosts with strong prior immunity (high δr) restrict viral abundance and thus the chance of generating a mutant variant, even though sufficient target cells are available for a mutant strain to reach levels that would allow for transmission. Hosts with an intermediate level of prior immunity are more likely than hosts with strong prior immunity to generate a mutant variant and also more likely than hosts with weak prior immunity to have the target cells available for a new variant to increase to transmissible levels. These hosts are therefore the main producers of antigenically novel variants.
This overall pattern is robust to decreased levels of immune escape as seen by increasing host immune status towards the mutant strain, δm (figure 3e). In other words, as long as there is some level of escape associated with mutations (δm < δr), intermediately immune hosts will generate mutations more frequently than both naive and strongly immune hosts.
3. The effect of immune status on population level patterns of antigenic evolution
Most theoretical studies of immune escape to date do not differentiate between hosts with respect to their ability to produce escape variants based on their immune status. In standard epidemiological models, mutations are assumed to arise from infected hosts at equal rates, regardless of immune status [2–4,14]. Consistent with the population genetics model of Grenfell et al. [11], our analysis indicates that new antigenic variants instead arise preferentially from infected individuals with an intermediate level of immunity to the circulating strain.
This raises the interesting question of whether considering host populations that are heterogeneous in their production of immune escape variants would yield predictions about the evolutionary processes of a pathogen that are different from existing population-level models. Here, we incorporate our within-host results qualitatively into a simple population level model to investigate this question, specifically with regard to the temporal patterns of antigenic evolution. We assume that there is one antigenic variant in the population to which all hosts are initially naive and calculate the time until an escape variant emerges to replace the initial variant in the host population. We take this antigenic variant to be a family of genetically different strains that are antigenically very similar. We assume, in line with passage experiments, that hosts can be reinfected with the same antigenic variant, and that each infection increases the immune status of the host. As illustrated schematically in figure 4a, hosts evolve independently of one another: each susceptible host becomes infected at a constant force of infection rate λ, and each infected host recovers to be susceptible at a constant recovery rate ν. A priori, immune escape is possible for every infected host. However, to incorporate the hump-shaped relationship between immune status and immune escape (figure 3d), we assume that the rate of immune escape is zero in hosts that are infected for the first time and in hosts that have been infected more than twice (figure 4b).
Figure 4.

A phylodynamic model of antigenic evolution. (a) Markov chain model for a single host. S denotes the uninfected state, I denotes the infected state. Subscripts denote number of previous infections with the circulating antigenic variant. λ is rate of becoming infected (the force of infection), ν is rate of recovery, and ρi the rate of immune escape which is dependent on the number of previous infections, i. (b) To reflect the nonlinearity between immune status and immune escape, we take ρ1 and ρ3 to be zero and ρ2 to be positive. (c) Probability density for antigenic emergence at the level of the individual (dashed line, right axis) and at the population level (solid line, left axis). The density for the individual case has a positive mass at infinity (not shown, see appendix B). Parameter values are λ = 0.001 per day, ν = 0.1 per day, ρ2 = 0.0001 per day. We assume a population of one million hosts and that at the population level there is a 0.1% probability that an antigenic variant, once generated, is successfully transmitted through the population. (d) Empirically derived distribution of variant persistence times for influenza A/H3N2 [30].
With this model, we calculate the distribution of antigenic emergence times for a single individual and for the population (appendix B). Both distributions are shown in figure 4c, where the persistence time of a variant is equivalent to the time until emergence of a new escape variant. We note the distributions are not exponential, which implies that the rate of antigenic emergence is time inhomogeneous. New variants are unlikely to emerge early as most of the population is naive. Over time, as more hosts become intermediately immune (recovered from the first infection), the probability that a new antigenic variant arises will increase. However, once the majority of the population becomes strongly immune (recovered from the second infection), this probability decreases. This distribution of variant persistent times is consistent with influenza A/H3N2 antigenic variant data (figure 4d) [30].
4. Discussion
Numerous passage experiments have demonstrated that host prior immunity affects the probability that intra-host antigenic immune escape occurs (figure 1). Here we use an intra-host model to investigate the mechanisms underlying this phenomenon and to derive a general relationship between the prior immunity of a host to a pathogen and the probability of immune escape. We then consider the consequences of incorporating such a relationship in the temporal patterns of antigenic evolution through a population level model. Although both models are simplifications, they are useful because they are mathematically tractable, provide insight into the key mechanisms involved in observed phenomena and generate specific predictions that could be evaluated with further research.
4.1. Limitations of the intra-host model
We have suggested here that target cell limitation is a natural and parsimonious choice for the mechanism through which immune pressure acts to produce escape variants. However, it is still unclear whether infections die out owing to the exhaustion of susceptible cells in the manner described in equations (2.1) and (2.2) [23]. It is likely, though, that viral access to susceptible cells can be limited, for example, because interferons trigger antiviral responses in target cells neighbouring the infection [23,31,32], or because the infection is spatially constrained [18]. While these processes are biologically distinct from target cell depletion, they are functionally similar with respect to their role in intra-host dynamics and immune escape. Specifically, they limit the size of the total viral population, regardless of the number of antigenic variants present in the infection. In this regard, even though the variable C encodes the population of target cells, it may be interpreted more broadly as a functionally equivalent mechanism without changing the main conclusions of figure 3.
Another simplification we have made is to combine the effects of a multitude of adaptive immune system processes into the parameter δr, which controls the clearance rate of the resident strain. This phenomenological treatment succinctly captures the essential contribution that prior immunity makes to intra-host dynamics: increased clearance, and thus lower final size, of the resident infection. It is this essential characteristic that leads to the curves derived in figure 3. To the extent that more biologically accurate models also capture this characteristic, they should confirm the conclusions from the model presented here.
Simple by design, our intra-host model gives a clear conceptual description of the intra-host processes that lead to immune escape. If one were interested in a more detailed characterization or in investigating a specific mechanism of within-host dynamics, it is straightforward to add these explicitly to the model. Such models can provide quantitatively more precise predictions of intra-host dynamics, though we expect the main findings from our analysis to also hold in these cases.
4.2. Predictions for intra-host escape dynamics
Our analysis demonstrates that the nonlinear relationship between immune status and immune escape arises from the confluence of two processes: target cell limitation, or a functional equivalent, and a differential antibody response dependent on host immune status (figure 3d). The successful emergence of an escape variant depends not only on the likelihood of a mutation occurring, which is negatively related to the immune status of the host, but also on the availability of resources for the escape variant, which is positively related to the immune status of the host. While this general idea has been demonstrated by Grenfell et al. [11] and supported by Volkov et al. [24], our dynamical systems approach provides a mechanistic understanding of this phenomenon and specific testable predictions that can further our understanding of intra-host immune escape. We also remark that the model of Volkov et al. may not be directly comparable to ours, as their parameter for immune response represents the strength of antibody binding rather than the level of prior immunity to an infection.
As a specific example, consider the timing of mutation events, which is expected to be important in our model. Owing to the limited population of target cells available for virions to infect, a mutation that arises early will have access to more target cells and thus have a greater chance of escape (figure 3a) than a mutation that arises later. This effect is greatest in intermediately immune hosts. To test the importance of timing, one could challenge a host with a mutant strain t hours after challenge with a wild-type strain. For intermediately immune hosts, we expect a lower t to lead to a greater chance of immune escape, owing to the selective advantage of the mutant and the increased availability of target cells. For naive hosts, the probability of escape is not expected to increase with lower t, except in the case where t is very small. This is because a mutant strain has no selective advantage in a naive host; unless it is introduced shortly after the initial challenge with the wild-type strain, it is unlikely to outcompete the equally fit and more established wild-type population. For fully immune hosts, we expect escape to occur regardless of t because the availability of target cells decreases only slightly over the time course of infection with the wild-type.
Other predictions of our model include low within-host antigenic diversity and the binary nature of immune escape. That is, given a population of partially immune infected hosts, we predict that one group will have little or no mutant viral load, while the other group will produce a mutant variant with a high viral load sufficient for transmission. This is alternative to a scenario where the mutant viral loads in an infected population are distributed, for example, as a normal distribution. Evaluating these predictions requires experiments where the antigenic composition of viral load is compared between hosts with varying levels of immune status. Past passage experiments provide some data, but these have concerned only naive or homologously vaccinated hosts [5–10]. Experiments where naive, intermediately immune and strongly immune hosts are challenged with a wild-type strain, and where the antigenic composition of their viral load is compared, for example, three days post infection, could be used to test our predictions concerning intra-host antigenic diversity and the binary nature of intra-host immune escape.
4.3. Limitations of the population level model
Our work extends previous treatments of the relationship between immune status and immune response by scaling up within-host level results to the population level. Although our assumption that a host may be reinfected with the same antigenic variant is in line with the methods used in passage experiments, in natural settings, it is more likely that hosts are infected with an antigenically similar strain to which they have partial immunity. We expect that the inferred temporal patterns of antigenic evolution under this latter scenario will be qualitatively similar to the results we present here. However, a proper theoretical investigation will require a multi-strain model, possibly incorporating epidemic dynamics. This is a mathematically and computationally more intensive task, which is beyond the goals of this work, but which certainly should be the subject of future studies.
4.4. Implications for vaccination policy
As a first step, the simple population-level model used here already provides an alternative explanation for the temporal pattern of antigenic emergence observed in influenza A/H3N2. The prevailing explanation for the non-exponential distribution of variant persistence times is that multiple mutations have to accumulate across several epitopes for significant antigenic change to occur [4,12–14]. Here, we reproduce the observed temporal patterns of antigenic emergence solely from the dynamics of immunity accumulation in the host population. These two explanations, while not mutually exclusive, make different predictions. In particular, if herd immunity accumulation is the main driver of antigenic evolution, vaccination policies could affect the rate at which antigenic variants originate. If vaccination leads to strong immunity, then the rate at which antigenic variants emerge would decrease significantly, as there would be fewer infected individuals, and vaccinated individuals would not be sources of new antigenic variants. However, if vaccination only partially immunizes individuals, as is often the case for influenza, and provided the force of infection is constant, the rate at which new antigenic variants emerge would increase. This idea that vaccination could change the rate of antigenic evolution of influenza is also implied by a study by Hensley et al. [10], where, under a different hypothesis for the origination of antigenic escape mutants, they suggest that increasing the paediatric vaccination rate might decrease the rate at which new antigenic variants emerge. Their study and ours indicate that the impact vaccination may have on the antigenic evolution of influenza should be a major consideration in disease control.
In summary, the work presented here demonstrates that the inclusion of host immune status can qualitatively and quantitatively change the dynamics of viral antigenic evolution in theoretical disease models at both intra-host and inter-host levels. It also highlights the need for further studies to understand how host immunity affects the within-host generation of immune escape variants and how, at the population level, this aggregate herd immunity impacts the origination of new antigenic strains. At the intra-host level, experiments that collect data on the antigenic properties of viral load for multiple levels of immune status could test the immunological and physiological processes that lead to immune escape hypothesized here. At the population level, data on vaccination policies and the antigenic evolution of pathogens such as influenza could be analysed and closely monitored for patterns and correlations. The insights gained from these studies may lead to a better understanding of the evolution of antigenically varying pathogens as well as strategies to more effectively control them.
Acknowledgments
This work was funded by National Science Foundation grants NSF-EF-1038593 (M.R.), NSF-0854879 (J.C.M.) and NSF-EF-08-27416 (K.K.). K.K. was further supported by the RAPIDD program of the Science and Technology Directorate, Department of Homeland Security and the Fogarty International Center, National Institutes of Health. S.L. was supported by a fellowship from the Center for Theoretical and Mathematical Sciences.
Appendix A
We first calculate the final size of a resident infection. Consider a single strain infection without mutation. Its dynamics are given by
| A1 |
and
| A2 |
with initial conditions
(We have dropped the subscript r for clarity.) The equilibrium value of V in this system is V = 0, all viral particles die out, independent of initial conditions. The equilibrium value of C, C∞, depends on the initial conditions and the host's immune status, δ. Different antibody responses, reflected in the value of δ, lead to different numbers of target cells remaining. In particular, for an immune individual, we take δ > γ C0, which corresponds to an initially decreasing viral population. Thus, many more target cells will remain for this value of δ than for lower values of δ. Because target cell replenishment occurs on a longer time scale, we are assuming in our calculations that C reaches its equilibrium value in the earlier-mentioned system before replenishment begins.
From equation (A 1), we have
The left-hand side of the equation is a perfect derivative, so let A: = ∫0∞V(t)dt be the area under the viral load curve (i.e. the final size of infection) and integrate both sides from 0 to ∞ to get
 |
where  . Next, we use equation (A 2):
 |
where we have used equation (A 1) to substitute for V. Again, we integrate from 0 to ∞ and use the fact that V(t) → 0 as t → ∞:
| A3 |
and
| A4 |
The last line follows from the fact that  . To solve this for A, let
 |
Plugging into equation (A 4) and after some algebra, we get
where W0(x) is the upper branch of the Lambert W, or Product Log, function. It satisfies  with the restriction W0(z) > −1. Plugging this back into our definition for ξ and solving for A, we get
 |
It will be useful later to treat A as a function of initial infection dose, initial target cell population and host immune status. Hence, we write A = A(v0, c0, δ), where the lower case v0 and c0 represent the initial viral load and target cell population as variables. In figure 3a, we plot A, the final size, for two initial target cell populations, over a range of host immune status, δ. The other parameter values are: V0 = 105 virions, C0 = 4 × 10⁸ cells, β = 102, γ = 2 × 10⁻⁸. A sharp drop (figure 3a inset) in the final size of a viral infection occurs at the host immunity level for which the resident viral load dynamics shift from initially growing (figure 2b) to decaying (figure 2c).
Assuming mutations do not significantly interfere with the dynamics of the resident strain, the number of mutations expected to occur during the course of the resident strain infection is given by  , where δr is the immune status of the host towards the resident infection. We adjust this to include only mutations that do not die out stochastically by a Poisson thinning [33]. The rate for such mutations, which we call
  (we have dropped the extra index on
  for clarity), is given by
 |
The initial dynamics of a mutant at t* can be approximated by a birth–death process with birth rate γC(t*) and death rate δm, where the dynamics of C(t) are given by equation (2.1). Here, as with most pathogens, the mutation rate is orders of magnitude less than the birth and death rates; so we ignore mutation events in this calculation. Our birth–death chain approximation of the initial dynamics of a mutant population implies 
 is 0 if
  (death rate
  birth rate) and is
  if
if  (birth rate
  death rate).
Since C(t) is decreasing in time, if  , then
  for all t and
 |
To evaluate this integral, we again use equation (A 1) and substitute in 
 |
for  . The last line follows from the fact that the integrands are perfect derivatives in t. C0 and C∞ correspond to the target cell population dynamics given by equations (A 1) and (A 2). C∞ will depend on the host's immune status to the resident strain; reflected in the value of δr:
so
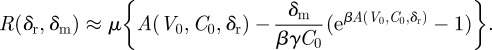 |
If  , then we need to integrate only up to the time τ when
  (because all mutations that occur after that will stochastically die out):
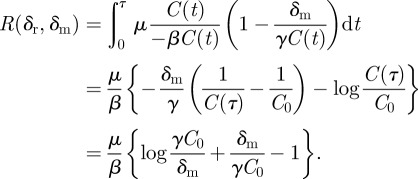 |
Thus, mutations that do not stochastically die out occur at a Poisson rate
 |
which is well defined because A is monotonically decreasing in δr. The probability that at least one such mutation occurs is thus  and is shown in figure 3b.
The expected final size of a mutant infection can be calculated if we assume that the final size formula for the resident strain also applies approximately to the mutant strain, but with initial viral load v0 = 1 and c0 = C(t), where t is the time of the mutation
| A5 |
where Fm is the final size of a mutant, Mt is the event that a mutation occurs at time t and M is the event that a mutation ever occurs. However, this is a difficult integral to evaluate because we do not have a closed form expression for C(t). Instead,
| A6 |
where we have essentially assumed that C(t) is constant at  , gives qualitatively the same result (justification below) with much less computation.
As illustrated in figure 3c, this is a reasonable assumption that preserves the qualitative relationship between immune status and a mutant strain's final size. At high values of δr, the resident infection is rapidly cleared, and C∞ is thus close to C0. At intermediate values of δr, C∞ will not be as close to C0; however, the relative error from our approximation is still minor and does not change the overall relationship.
At low δr values, corresponding to naive or nearly naive hosts, C(t) can take values over a wide range. However, in this range of δr, any mutant strain faces strong competition from the established resident strain. Our assumption that a mutant strain has access to all available target cells is thus too generous. The effective number of target cells available to the mutant strain is much lower than the target cells available at the time of mutation and C∞ is a reasonable approximation.
We note that, in simulations, when a host's immune status is low, a positive correlation exists between mutation rate and final size (figure 3c inset). This is because with a higher mutation rate, the first mutation is expected to occur earlier during the resident infection. At low immune levels, where target cells are depleted rapidly, a mutation that occurs early reaches a higher viral load than the one that occurs later.
To obtain the overall relationship between immune status and immune escape (figure 3d), we multiply the probability of a mutation by the expected final size of a mutation.
Appendix B
The states and transition rates of our Markov chain model are illustrated in figure 4a and denoted in the figure legend. Let τ be the first time a new antigenic variant is produced at the individual level. Let  denote the density function of Tx, an exponential random variable with rate parameter x. That is,
  . Then
| B1 |
where ρ is the same as ρ2 in figure 4.  is the time to leave state I2.
  is the time for a host to go from state S0 to either state ‘escape’ or S2. Thus, we multiply the expression by the probability our hosts ends up in state ‘escape’ rather than state S2: ρ/(ρ+ν). We assume that these exponential random variables are independent; so the density of their sum is given by convolutions:
| B2 |
 |
B3 |
where * denotes convolution. In this Markov chain model, there is always a chance that a host does not produce a new antigenic variant. This event corresponds to a mass of  at infinity for fτ, which is not shown in figure 4c.
To extend this result to the population level, we assume that there is a fixed population of size N of hosts, and that individuals produce new antigenic variants independently. We also assume that for each new antigenic variant that is produced, it is transmitted through the population with probability u. Thus, the emergence time of an antigenic variant that avoids stochastic extinction has the same distribution as the minimum of N independently and identically distributed random variables with density ufτ [34]:
| B4 |
where Fτ(t) is the cumulative density function of fτ(t). This is shown in figure 4c (solid line).
References
- 1.Andreasen V., Lin J., Levin S. A. 1997. The dynamics of cocirculating influenza strains conferring partial cross-immunity. J. Math. Biol. 35, 825–842 10.1007/s002850050079 (doi:10.1007/s002850050079) [DOI] [PubMed] [Google Scholar]
- 2.Gog J. R., Grenfell B. T. 2002. Dynamics and selection of many-strain pathogens. Proc. Natl Acad. Sci. USA 99, 17 209–17 214 10.1073/pnas.252512799 (doi:10.1073/pnas.252512799) [DOI] [PMC free article] [PubMed] [Google Scholar]
- 3.Ferguson N. M., Galvani A. P., Bush R. M. 2003. Ecological and immunological determinants of influenza evolution. Nature 422, 428–433 10.1038/nature01509 (doi:10.1038/nature01509) [DOI] [PubMed] [Google Scholar]
- 4.Koelle K., Cobey S., Grenfell B., Pascual M. 2006. Epochal evolution shapes the phylodynamics of interpandemic influenza A (H3N2) in humans. Science 314, 1898–1903 10.1126/science.1132745 (doi:10.1126/science.1132745) [DOI] [PubMed] [Google Scholar]
- 5.Archetti I., Horsfall F. L. 1950. Persistent antigenic variation of influenza A viruses after incomplete neutralization in ovo with heterologous immune serum. J. Exp. Med. 92, 441–462 10.1084/jem.92.5.441 (doi:10.1084/jem.92.5.441) [DOI] [PMC free article] [PubMed] [Google Scholar]
- 6.Gerber P., Loosli C. G., Hamre D. 1955. Antigenic variants of influenza A virus, (PR8 strain). I. Their development during serial passage in the lungs of partially immune mice. J. Exp. Med. 101, 627–638 10.1084/jem.101.6.627 (doi:10.1084/jem.101.6.627) [DOI] [PMC free article] [PubMed] [Google Scholar]
- 7.Gerber P., Hamre D., Loosli C. G. 1956. Antigenic variants of influenza A virus (PR8 strain). II. Serological and immunological characteristics of variants derived from variants. J. Exp. Med. 103, 413–424 10.1084/jem.103.4.413 (doi:10.1084/jem.103.4.413) [DOI] [PMC free article] [PubMed] [Google Scholar]
- 8.Hamre D., Loosli C. G., Gerber P. 1958. Antigenic variants of influenza A virus (PR8 strain). III. Serological relationships of a line of variants derived in sequence in mice given homologous vaccine. J. Exp. Med. 107, 829–844 10.1084/jem.107.6.829 (doi:10.1084/jem.107.6.829) [DOI] [PMC free article] [PubMed] [Google Scholar]
- 9.Borrego B., Novella I. S., Giralt E., Andreu D., Domingo E. 1993. Distinct repertoire of antigenic variants of foot-and-mouth disease virus in the presence or absence of immune selection. J. Virol. 67, 6071–6079 [DOI] [PMC free article] [PubMed] [Google Scholar]
- 10.Hensley S. E., et al. 2009. Hemagglutinin receptor binding avidity drives influenza A virus antigenic drift. Science 326, 734–736 10.1126/science.1178258 (doi:10.1126/science.1178258) [DOI] [PMC free article] [PubMed] [Google Scholar]
- 11.Grenfell B. T., Pybus O. G., Gog J. R., Wood J. L. N., Daly J. M., Mumford J. A., Holmes E. C. 2004. Unifying the epidemiological and evolutionary dynamics of pathogens. Science 303, 327–332 10.1126/science.1090727 (doi:10.1126/science.1090727) [DOI] [PubMed] [Google Scholar]
- 12.Wiley D. C., Wilson I. A., Skehel J. J. 1981. Structural identification of the antibody-binding sites of Hong Kong influenza haemagglutinin and their involvement in antigenic variation. Nature 289, 373–378 10.1038/289373a0 (doi:10.1038/289373a0) [DOI] [PubMed] [Google Scholar]
- 13.Wilson I. A., Cox N. J. 1990. Structural basis of immune recognition of influenza virus hemagglutinin. Annu. Rev. Immunol. 8, 737–771 10.1146/annurev.iy.08.040190.003513 (doi:10.1146/annurev.iy.08.040190.003513) [DOI] [PubMed] [Google Scholar]
- 14.Koelle K., Khatri P., Kamradt M., Kepler T. B. 2010. A two-tiered model for simulating the ecological and evolutionary dynamics of rapidly evolving viruses, with an application to influenza. J. R. Soc. Interface 7, 1257–1274 10.1098/rsif.2010.0007 (doi:10.1098/rsif.2010.0007) [DOI] [PMC free article] [PubMed] [Google Scholar]
- 15.Larson E. W., Dominik J. W., Rowberg A. H., Higbee G. A. 1976. Influenza virus population dynamics in the respiratory tract of experimentally infected mice. Infect. Immun. 13, 438–447 [DOI] [PMC free article] [PubMed] [Google Scholar]
- 16.Bocharov G. A., Romanyukha A. A. 1994. Mathematical model of antiviral immune response. III. Influenza A virus infection. J. Theor. Biol. 167, 323–360 10.1006/jtbi.1994.1074 (doi:10.1006/jtbi.1994.1074) [DOI] [PubMed] [Google Scholar]
- 17.Nowak M. A., May R. 2001. Virus dynamics: mathematical principles of immunology and virology, pp. 16–18 New York, NY: Oxford University Press. [Google Scholar]
- 18.Beauchemin C., Samuel J., Tuszynski J. 2005. A simple cellular automaton model for influenza A viral infections. J. Theor. Biol. 232, 223–234 10.1016/j.jtbi.2004.08.001 (doi:10.1016/j.jtbi.2004.08.001) [DOI] [PubMed] [Google Scholar]
- 19.Baccam P., Beauchemin C., Macken C. A., Hayden F. G., Perelson A. S. 2006. Kinetics of influenza A virus infection in humans. J. Virol. 80, 7590–7599 10.1128/JVI.01623-05 (doi:10.1128/JVI.01623-05) [DOI] [PMC free article] [PubMed] [Google Scholar]
- 20.Hancioglu B., Swigon D., Clermont G. 2007. A dynamical model of human immune response to influenza A virus infection. J. Theor. Biol. 246, 70–86 10.1016/j.jtbi.2006.12.015 (doi:10.1016/j.jtbi.2006.12.015) [DOI] [PubMed] [Google Scholar]
- 21.Handel A., Longini I. M., Antia R. 2007. Neuraminidase inhibitor resistance in influenza: assessing the danger of its generation and spread. PLoS Comput. Biol. 3, 2456–2464 10.1371/journal.pcbi.0030240 (doi:10.1371/journal.pcbi.0030240) [DOI] [PMC free article] [PubMed] [Google Scholar]
- 22.Handel A., Longini I. M., Antia R. 2010. Towards a quantitative understanding of the within-host dynamics of influenza A infections. J. R. Soc. Interface 7, 35–47 10.1098/rsif.2009.0067 (doi:10.1098/rsif.2009.0067) [DOI] [PMC free article] [PubMed] [Google Scholar]
- 23.Saenz R. A., et al. 2010. Dynamics of influenza virus infection and pathology. J. Virol. 84, 3974–3983 10.1128/JVI.02078-09 (doi:10.1128/JVI.02078-09) [DOI] [PMC free article] [PubMed] [Google Scholar]
- 24.Volkov I., Pepin K. M., Lloyd-Smith J. O., Banavar J. R., Grenfell B. T. 2010. Synthesizing within-host and population-level selective pressures on viral populations: the impact of adaptive immunity on viral immune escape. J. R. Soc. Interface 7, 1311–1318 10.1098/rsif.2009.0560 (doi:10.1098/rsif.2009.0560) [DOI] [PMC free article] [PubMed] [Google Scholar]
- 25.Anderson D. F., Ganguly A., Kurtz T. G. 2011. Error analysis of tau-leap simulation methods. Ann. Appl. Probab. 21, 2226–2262 10.1214/10-AAP756 (doi:10.1214/10-AAP756) [DOI] [Google Scholar]
- 26.Mann J. J., Waldman R. H., Togo Y., Heiner G. G., Dawkins A. T., Kasel J. A. 1968. Antibody response in respiratory secretions of volunteers given live and dead influenza virus. J. Immunol. 100, 726–735 [PubMed] [Google Scholar]
- 27.Iwasaki T., Nozima T. 1977. Defense mechanisms against primary influenza virus infection in mice. I. The roles of interferon and neutralizing antibodies and thymus dependence of interferon and antibody production. J. Immunol. 118, 256–263 [PubMed] [Google Scholar]
- 28.Richman D. D., Murphy B. R., Baron S., Uhlendorf C. 1976. Three strains of influenza A virus (H3N2): interferon sensitivity in vitro and interferon production in volunteers. J. Clin. Microbiol. 3, 223–226 [DOI] [PMC free article] [PubMed] [Google Scholar]
- 29.Carrat F., Vergu E., Ferguson N. M., Lemaitre M., Cauchemez S., Leach S., Valleron A. 2008. Time lines of infection and disease in human influenza: a review of volunteer challenge studies. Am J. Epidemiol. 167, 775–785 10.1093/aje/kwm375 (doi:10.1093/aje/kwm375) [DOI] [PubMed] [Google Scholar]
- 30.Koelle K., Kamradt M., Pascual M. 2009. Understanding the dynamics of rapidly evolving pathogens through modeling the tempo of antigenic change: influenza as a case study. Epidemics 1, 129–137 10.1016/j.epidem.2009.05.003 (doi:10.1016/j.epidem.2009.05.003) [DOI] [PubMed] [Google Scholar]
- 31.Howat T. J., Barreca C., O'Hare P., Gog J. R., Grenfell B. T. 2006. Modelling dynamics of the type I interferon response to in vitro viral infection. J. R. Soc. Interface 3, 699–709 10.1098/rsif.2006.0136 (doi:10.1098/rsif.2006.0136) [DOI] [PMC free article] [PubMed] [Google Scholar]
- 32.Sanders C. J., Doherty P. C., Thomas P. G. 2011. Respiratory epithelial cells in innate immunity to influenza virus infection. Cell Tissue Res. 343, 13–21 10.1007/s00441-010-1043-z (doi:10.1007/s00441-010-1043-z) [DOI] [PubMed] [Google Scholar]
- 33.Durrett R. 1999. Essentials of stochastic processes, pp. 140–142 New York, NY: Springer [Google Scholar]
- 34.Koelle K., Ratmann O., Rasmussen D. A., Pasour V., Mattingly J. 2011. A dimensionless number for understanding the evolutionary dynamics of antigenically variable RNA viruses. Proc. R. Soc. B 278, 3723–3730 10.1098/rspb.2011.0435 (doi:10.1098/rspb.2011.0435) [DOI] [PMC free article] [PubMed] [Google Scholar]