

Abstract
Despite successful fabrication of gecko-inspired fibrillar surfaces with strong adhesion forces, how to achieve an easy-removal property becomes a major concern that may restrict the wide applications of these bio-inspired surfaces. Research on how geckos detach rapidly has inspired the design of novel adhesive surfaces with strong and reversible adhesion capabilities, which relies on further fundamental understanding of the peeling mechanisms. Recent studies showed that the peel-zone plays an important role in the peeling off of adhesive tapes or fibrillar surfaces. In this study, a numerical method was developed to evaluate peel-zone deformation and the resulting mechanical behaviour due to the deformations of fibrillar surfaces detaching from a smooth rigid substrate. The effect of the geometrical parameters of pillars and the stiffness of backing layer on the peel-zone and peel strength, and the strong attachment and easy-removal properties have been analysed to establish a design map for bio-inspired fibrillar surfaces, which shows that the optimized strong attachment and easy-removal properties can vary by over three orders of magnitude. The adhesion and peeling design map established provides new insights into the design and development of novel gecko-inspired fibrillar surfaces.
Keywords: gecko-inspired surface, peel zone, easy removal, adhesion and peeling design map
1. Introduction
Interfacial science and engineering has been widely studied to achieve various functionalities based on the material chemistry and micro/nano surface structures [1–4]. Recently, fibrillar adhesion has attracted much attention to develop gecko-inspired adhesive surfaces [2,5–12]. In these adhesion studies, peeling tests have been widely used to determine interfacial adhesion strength [13,14]. For the adhesion between fibril ends and a rigid substrate, the peel-zone plays an extremely important role in peeling behaviours, governed by the interfacial strength and deformation of the fibrils [15]. For instance, the fine hierarchical structures of gecko setae usually generate frictional adhesion from the peel-zone and the contact region between a spatula and a substrate [11,16–18]. Similarly, anisotropic tribological properties are expected for anisotropic structures of unidirectionally oriented carbon nanotubes [1].
In previous studies, researchers have explored the design and fabrication of gecko-inspired surfaces, based on the adhesive contact generated by several splits at the end of setae, and predicted that a higher extent of splitting could generate a stronger adhesive force [5,19,20]. The use of micro- and nano-structured fibrillar surfaces to mimic gecko seta arrays has attracted much interest during the past decade [9,12,21–28]. Micro-fibrillar surfaces that use microfabricated hole array masters [2,9,10,21] and a nanowire surface with a larger aspect ratio and a high Young's modulus [7] have also been fabricated. Despite much effort and the significant progress made on the design of surfaces with strong adhesive properties [9,29] and the recent successful development of sticky gecko-inspired surfaces, how to achieve an easy-removal capability has become a major concern that may restrict the wide applications of bio-inspired adhesives.
Previous studies have considered the easy removal of strong adhesive surfaces with vertical micro-fibrillar structures similar to that of a real gecko that can attach and detach from surfaces via controlling the peeling angle of its setae by gripping in or releasing its toes, in which the adhesion force can vary by more than two or three orders of magnitude [18,30]. The detachment of a gecko from a substrate is similar to the peeling of an adhesive tape, though the two processes are different in size scales and molecular interactions involved between surfaces. The peel angle, the length and shape of the peel region of the adhesive tape can significantly influence its mechanical peeling properties [6,17,30–32]. It is practicable to fabricate adhesive surfaces with specially designed micro-fibrillar structures to modulate their reversible peeling and mechanical properties. Peeling tests have been widely applied to investigate bio-inspired conformal adhesion of fibrillar surfaces [27,33–35]. Therefore, it is very important to understand the fundamental principles of various peeling behaviours to develop innovative gecko-inspired surfaces/adhesives [30]. Yet, the geometry of peel-zone, the deformation of fibrillar structures during peeling process and their contributions to peel strength (peel force per unit width) have not been analysed quantitatively and systematically. Furthermore, an improved reversible design of bio-inspired adhesive surfaces based on peeling behaviour remains a problem.
In this study, we numerically studied the effect of the peeling zone on the peeling behaviour of a gecko-inspired micro-fibrillar surface detaching from a smooth rigid substrate. The elastic deformation of fibrils within the peel-zone was calculated to obtain the force contribution and the corresponding adhesion energy. The effects of the physical properties of fibrillar surfaces, such as elastic modulus, geometrical parameters of pillars and backing layer, on peel forces and the strong attachment and easy-removal properties are discussed. An adhesion and peeling design map was proposed for modulating the strong attachment and easy-removal properties of bio-inspired surfaces.
2. Results and discussion
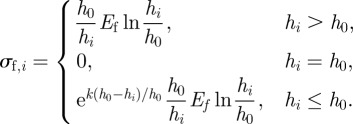
The numerical analysis in this study focuses on a gecko-inspired surface with regular vertical cylindrical fibrils, as shown in figure 1. When the surface is peeled off from a substrate at a certain angle, the fibrils will be stretched and deformed until the tension stress exceeds the pull-off stress, and then detachment from the smooth substrate occurs. The stress–strain relationship of the fibrils considers the large deformation and the neck shrink effect is shown in equation (2.1) as derived in appendix A, and the critical pull-off stress of an individual fibril is given by equation (2.2):
| 2.1 |
 |
2.2 |
Figure 1.

A schematic of a gecko-inspired surface with fibril and its peeling region. (a) Modelling of gecko-inspired surface. (b) A three-dimensional schematic of the numerical model considering the interfacial adhesion and the micro-fibrillar structures. (c) A schematic of the peel region and the deformation of the fibrils. Full details of numerical method can be found in appendix A. (Online version in colour.)
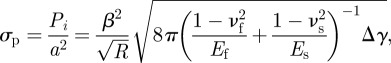
where Ef and Es are the Young's modulus; νf and νs are Poisson's ratio of fibrils and the substrate, respectively; Δγ = γf + γs − γf,s is the work of adhesion between fibrils and the substrate, γf, γs, γf,s denotes surface and interfacial energies of fibrils and the substrate; R is the fibril radius; h0 is the fibril length; h is the length of stretched fibrils; σf is the tensile stress at the fibril ends; Pi and σM are the critical pull-off force and pull-off stress of an individual fibril, respectively.
From figure 1c, the length of the deformed fibril appears to be related to its displacement along x- and y-axes. When the upper end of the fibril moves from position P0(s(x), 0) to P1(x, y) as shown in figure 1c, the length can be described by
| 2.3 |
where hx = s(x) − x, hy = y + h0 and s is the length from the bifurcation at the peeling front to the point where detachment has occurred. Full details of the derivation can be found in appendices.
A detailed description of the numerical method is given in appendix A.2. Basically, the peel region is numerically divided into N elements along the x-axis, each of which has the length of ds. During peeling, each fibril detaches in sequence from the element near the peel front. In order to obtain precise results to account for this deformation property of the gecko-inspired surface, the length of these elements should be much smaller than the radius of fibrils, i.e.  . For the first element, the normal force and the horizontal force are denoted as u0 and f0, respectively. For the last element, the boundary condition is that the resultant force is equivalent to the peeling force, F. Applying the numerical method proposed by Lin et al. [36] and Zhang et al. [37] when the initial values of peeling force F, u0 and f0 are given, the forces and bending moment of the consecutive elements can be calculated in turn from the first element to the last element at the edge of the peel region [26]. With decreasing meshing size, the peel strength calculated converges to a fixed value. With decreases in the Young's modulus of fibrils, the meshing length should also be reduced to obtain precise results to account for the property of the gecko-inspired surface to deform easily, as discussed in appendices. An advantage of this numerical method is that it directly depicts the lateral and normal stress distribution in the peel region. Furthermore, the peel-zone shape and the force contributions are also discussed in the appendices.
To validate the numerical method, the calculation results were compared with previous experimental results reported by Sameoto & Menon [10], with a gecko-inspired PDMS (polydimethylsiloxane) pillar array surface and a smooth PDMS sheet peeled off at different angles. The peel strengths of the smooth sheet at different peel angles obeyed Kendall's peeling model. The fitted adhesion energy was 0.6 J m−2, indicated by the bottom dashed line in figure 2. The experimental peel strengths of the gecko-inspired surface are marked with dark-blue square points in figure 2 [10]. The fitted adhesion energy versus peel angle is considered to represent the equivalent interfacial adhesion energy of a gecko-inspired PDMS fibrillar surface and the substrate. In addition, using k = 20 (the compression coefficient, as described in appendices) and Poisson's ratio of ν = 0.45, the peel strengths of the gecko-inspired surface agreed reasonably with the experimental results, as shown by the red solid round plots in figure 2.
Figure 2.
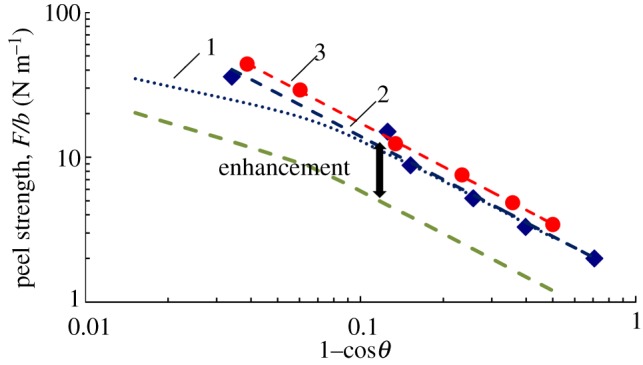
The comparison of the calculated results with the experimental results. Dashed green line denotes experiments of PDMS sheet (γ = 0.6 J m−2); diamonds denote experiments of gecko-inspired surface; circles denote numerical calculation. 1. Kendall's model fitting of experiment, γeff = 1.4 J m−2. 2. Kendall's model ignoring elastic energy term fitting of experiment, γeff = 1.43 J m−2. 3. Kendall's model ignoring elastic energy term fitting of experiment, γeff = 1.72 J m−2. (Online version in colour.)
In Kendall's model, the relationship between peel strength and peel angle is [17,38] given by
| 2.4 |
where γ is the adhesion energy between the adhesive tape and substrate, F is the peel force and b is the width of adhesive surface. If the elastic energy term is ignored, the numerical calculation and experimental results agree well with Kendall fitting curves shown in figure 2, which indicates that the numerical method is applicable when the elastic term could be neglected.
The effective adhesion energy of a gecko-inspired surface was 1.43 J m−2 obtained from experiments, while approximately 1.72 J m−2 from numerical calculation. From the earlier-mentioned discussion, the curve of peel strength versus peel angle for a gecko-inspired fibrillar surface can be considered as a shift of Kendall fitting curve for the case of a smooth sheet, i.e. increase in the effective adhesion energy. Such adhesion enhancement was also reported in the literature [27,28,34,39]. One of the reasons for the adhesion enhancement was considered to be related to the deformations and dissipation of fibrils [28]. Additionally, on the basis of contact mechanics, the adhesion stress increases while decreasing the fibril radius but keeping the same ratio of fibril radius to spacing distance [21,40]. Interfacial conformal adhesion enhancement of microstructures have been found to play a critical role in the peeling of both bio-inspired fibrillar surfaces and gecko spatula adhesion [27,34,35,41]. All these factors can lead to a higher peel strength of the gecko-inspired surface than that of a smooth sheet.
The peel strengths of fibrillar surfaces with fibrils of different radii versus peel angles are shown in figure 3. When the ratio of radius to spacing distance between fibrils is constant, and Δγ = 20 mJ m−2, Ef = 0.2 MPa, the relationships between peel strengths and peel angles follow the same trend for different cases with different R values, whereas the equivalent energy increases with a decrease in the radius of fibrils. These results are in accordance with the previous report [5].
Figure 3.
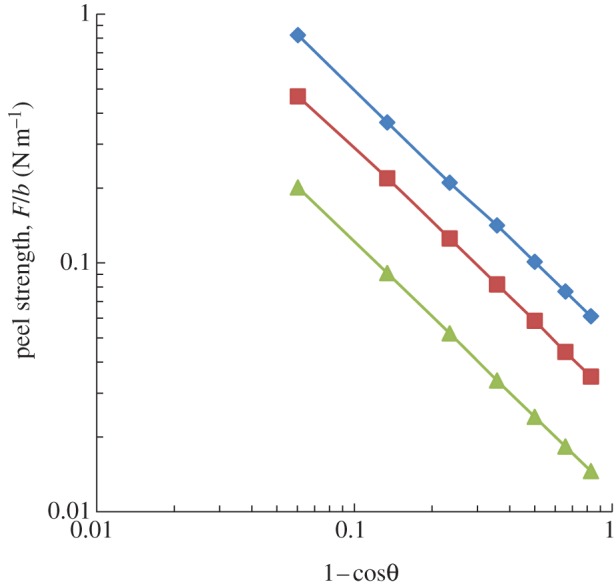
The peel strength of fibrils with different radii versus peel angle when the ratio of radius to the spacing of fibrils is constant. Solid line with diamonds (R = 6 μm); solid line with squares (R = 9 μm); solid line with triangles (R = 18 μm). (Online version in colour.)
The enhancement of peel strength by using smaller fibrils can be estimated based on energy analysis [38]. The effective adhesion energy of fibrillar surfaces can be obtained as
| 2.5 |
where Wf is the maximum elastic energy of an individual fibril prior to its detachment, and can be derived as
| 2.6 |
where Wf,L is the elastic energy of an individual fibril for linear elastic material and Wf,max is the maximum possible elastic energy density for large neck shrink deformation. Full details of the derivation are given in appendices.
The pull-off length h of fibrils by using the detachment condition described in appendix A and equations (A 18–A 21) in appendix A can be applied to determine the range of effective adhesion energy as 1.06 J m−2 < γeff < 2.57 J m−2, which concurs well with the results from the numerical calculations.
3. Surface design based on peeling behaviours
3.1. Geometrical design of fibrils
In order to achieve micro-fibrillar surfaces with reversible peeling, it is essential to combine the considerations of strong normal adhesion and optimized peeling behaviours in the surface design principles. The earlier-mentioned discussion shows that the peel strength increases when the fibril radius decreases, with the ratio of fibril radius to fibril spacing being kept constant. The enhancement of peel strength of the fibrillar surface obtained from the numerical method is shown in figure 4a by taking typical values for the parameters in the numerical analysis as θ = 30°, Δγ = 0.6 J m−2, νf = 0.45, h0 = 10 μm, R/a = 0.45, H = 0.35 mm, where H is the backing layer thickness of the fibrillar surface. However, the normal adhesion stress of the gecko-inspired surface also increases when the fibril radius decreases, with the ratio of fibril radius to fibril spacing being kept constant, i.e.
 |
3.1 |
Figure 4.

The influence of geometrical parameter on peel strength of gecko-inspired surface by taking typical parameters for θ = 30°, Δγ = 0.6 J m−2, νf = 0.45, h0 = 10 μm, R/a = 0.45, H = 0.35 mm. (a) The relationship between peel strength, pull-off stress ξp and the radius of the fibril at different Young's modulus. The solid points depict values of peel strength, whereas the hollow points indicate pull-off stress ξp by choosing the typical value of equation (3.5) (b ∼ 10−2 m). (b) The relationship between λr and the radius of fibrils at different Young's modulus. (c) The peel strength versus the length of fibrils at different Young's modulus of fibrils. (d) The peel strength versus aspect ratio at different Young's modulus of fibrils. (Online version in colour.)
where β = R/a is the ratio of radius to spacing distance between fibrils. In addition, the normal adhesion strength of a gecko-inspired surface can be expressed as
| 3.2 |
where b and d are the width and length of the gecko-inspired surface, l = b/a and m = d/a, respectively.
As mentioned earlier, the peel force per unit width is called peel strength. The normal adhesion force per unit width, i.e. the so-called pull-off strength, is defined as
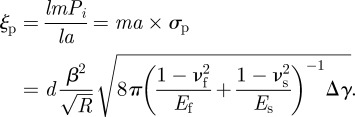 |
3.3 |
The gecko-inspired surface is expected to possess strong attachment and easy-removal properties. To characterize these properties, a parameter λ is defined as follows:
| 3.4 |
where F/b is the ratio of the normal adhesion force per width (pull-off strength) to the peel strength. From the peeling behaviour discussed earlier, the numerical results obey F/b = γeff/(1−cos θ). Equation (3.4) can be rewritten as
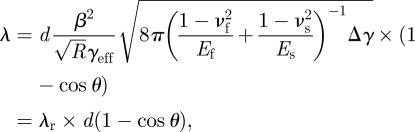 |
3.5 |
where
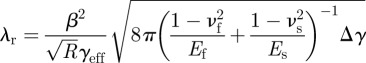 |
is a reference value. Equation (3.5) indicates that λ is related to physical parameters, including  , Δγ, the geometrical parameters and peel angle. A larger λ indicates better properties of strong adhesion and easy removal. The relationship between λr and the radius of fibrils for cases with different Young's modulus is shown in figure 4b. λr increases with an increase in the Young's modulus and fibril radius. Therefore, the radius of fibrils should be designed in accordance with material properties. When θ = 90°, λr = λ/d, which indicates that the physical meaning of λr is λ per length at the peel angle of 90°.
Figure 4c shows that an increase in the length of fibrils is associated with an increase in the peel strength, whereas the normal adhesion force does not change according to equation (A 1). Figure 4d shows that the relation of the peel strength of the gecko-inspired surface increases with the aspect ratio. It should be noted that fibrils cannot be too short owing to the roughness of actual substrate as very short fibrils cannot adapt to the roughness. Therefore, the roughness of the target substrates should be considered when designing the length of fibril. Furthermore, anti-self-adhesion conditions should also be considered, which is given in §3.2.
On the basis of experimental results, Lamblet et al. [39] proposed that a correlation existed between the aspect of fibril and the peel strength of the gecko-inspired surface. During the peeling process, the elastic bending energy (Eb = 2P2h3/3πER4), the stretching elastic energy (Ef = P2h/2πER3) and the deformation energy of the substrate (Es = 8πP2/27ER) are fully dissipated. Therefore, the peel strength increases as the aspect ratio increases. However, when the aspect ratio is too large, the fibrils cannot resume their shapes following peeling, or even form bundles, leading to a decrease in the peel strength. The earlier-mentioned numerical method does not take Eb, Es and the bundling effect into account; thus, the method is not suitable for gecko-inspired surfaces with large aspect ratios. Therefore, anti-self-adhesion conditions should be included to determine the critical aspect ratio [21], and then the numerical method can be applied to design the geometrical parameters.
Previous studies have discussed the geometrical design. Spolenak et al. [24] and Gao et al. [29] discussed the influence of the shape of the end of the fibril on the adhesion force. Zeng et al. [11] analysed the normal adhesion of inclined fibril by applying the JKR model and van der Waals theory. The theoretical maximum adhesion force of a flat cylindrical fibril can be determined by  . Therefore, the smaller the fibrils, the higher the normal adhesion force. Zeng et al. [11] also analysed the relationship between adhesion force and the incline angle of fibrils, and proposed that the normal adhesion force can be altered by over two orders of magnitude. The previous studies indicate a practical way to control the attachment and detachment of a gecko-inspired fibrillar surface by varying the inclination angle.
For a real gecko system, the adhesion force of gecko seta can be changed easily by more than three orders of magnitude during attachment and detachment. The earlier-mentioned discussion and figure 4b indicate that, under certain conditions, λ = λr·b(1 − cos θ), the change of the peeling strength and the adhesion strength can reach more than three orders of magnitude. Therefore, on the basis of results in this study, the strong attachment and easy-removal properties of gecko-inspired surfaces can be optimized by applying the design principle established based on the numerical method proposed.
3.2. Adhesion and peeling design map
The question of how to optimize the geometrical parameters of the fibrillar surfaces according to their physical properties has attracted widespread attention. Spolenak et al. [40] gave the optimization of the equivalent apparent contact strength. By taking typical values for Δγ = 0.1 J m−2, γf = 0.06 J m−2, νf = 0.45, h0 = 10 μm, R/a = 0.45 and H = 0.35 mm, where γf denotes the work of adhesion between two fibril tips, the optimization process can be summarized as follows. First, the fracture limit of a fibril with a flat end is expressed as
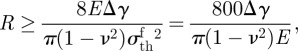 |
3.6 |
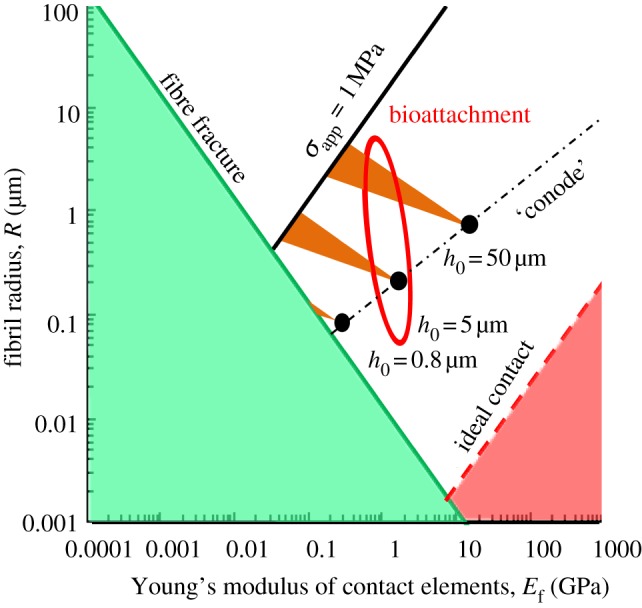
where 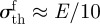 is the theoretical fracture strength. Second, the limit of fibril condensation and contact adaptability of the flat end cylinder fibril is the same as that of hemispherical end [40]. By taking a typical value for the fibril length h0 = 10 μm, these limits are shown in the respective shaded regimes in figure 5a. From equation (A 1) in appendix A, the equivalent apparent contact strength σapp = Pi/a2 condition is
 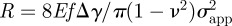 . The fourth step is to exclude the region where σapp < 1 MPa. Therefore, the remaining triangular target area gives the allowed parameter region for normal adhesion of an adhesive structure with σapp of at least 1 MPa.
Figure 5.

The adhesion and peeling design map with typical values for Δγ = 0.1 J m−2, γf = 0.06 J m−2, νf = 0.45, R/a = 0.45 and H = 0.35 mm, where γf is the work of adhesion between two fibrils. (a) The triangular target area, which is the optimization of the gecko-inspired surface of h0 = 10 μm. (b) λr obtained by the numerical method. (c) Further optimization of different fibril lengths, which is determined by the competition of the easy-removal property (increasing as the direction of the hollow arrow) and the strong adhesive property (increasing as the direction of the solid arrow). (Online version in colour.)
The design of surfaces with strong attachment and easy-removal properties should be further optimized. Contours of constant λr can be obtained by the numerical method, as shown in figure 5b. Only the segments on these contours within the target area are allowed for design, at which the strong attachment and easy-removal properties are the same but σapp are different. The maximum σapp point is allowed at the intersection of each equivalent λr condition line with the lower border of the triangular target area. Particularly, the point at the bottom of the triangular target area gives the best optimum properties of λr and σapp.
By choosing the typical value of equation (3.5) (d ∼ 10−2 m, θ = 90°), if λr is more than 105, the change of the peeling strength and the adhesion strength can reach three orders of magnitude. Furthermore, figure 5c gives the target design area for cases of different fibril lengths, while the insets show the values of λr and σapp at the optimum points of different h0. With the increases in fibril length, smaller λr is allowed within the target area. Therefore, the direction of the hollow arrow represents that the easy-removal property allowed in the target area increases, whereas the direction of the solid arrow represents that the strong adhesive property of the target area increases. The competition of these two properties determines the optimization of the gecko-inspired fibrillar surface.
The optimum parameters of normal adhesion that were mentioned previously by Spolenak et al. [40] distribute points of the triangular target areas at the bottom. However, further optimization of these optimum points by the actual requirement of the properties of strong adhesion and easy removal has not been discussed yet. Taking a typical design as an example, for a material with the interfacial adhesion energy 0.1 J m−2 with a substrate, the work of adhesion between two fibrils 0.06 J m−2, Poisson's ratio of 0.45, the Young's modulus of fibrils 32 MPa and that of backing layer 2 MPa, the geometrical parameters, including the radius (2 μm), spacing distance (4.44 μm), and length of fibrils (10 μm) and also the thickness of the backing layer (0.35 mm), d = 5 × 10⁻³ m and θ = 30°, the change of the peeling strength and the adhesion strength can reach over 2000 times and the adhesion strength can reach 1.8 MPa, with no condensation and good adaptability.
Therefore, by using the numerical calculation, the optimum point to obtain a desired λ can be selected. Previously, Greiner et al. [42] proposed that the optimum point should be just at the intersection of the ‘conode’ (shown as dashed dot line in figure 6) with the ideal contact strength limit (shown as dashed line in figure 6). However, by taking into account the strong attachment and the easy-removal properties, the optimum point is the balance of the two properties to some extent, which achieves qualitative agreement with the biological contact elements (flies, beetles, spiders and lizards), as shown in figure 6 [40].
Figure 6.
The allowed parameter for design of the attachment elements of biological systems, where f = πR2/a2 = 10%, γ = 0.05 J m−2. (Online version in colour.)
3.3. Design of backing layer
As expected, the numerical method can also be used to design the backing layer. Kendall's peeling model demonstrates that peel strength increases with increasing the thickness, or Young's modulus, of the backing layer, i.e. the stiffness of the backing layer [38]. For the gecko-inspired fibrillar surface, peel strength correlates with the stretch of fibrils. Equation (A 13) indicates that the shape of the peel region determines stretch or compression of fibrils. Moreover, the deformation of fibrils influences the deformation of the backing layer and then the shape of the peel region. The theoretical results indicate that the influence of backing layer thickness on the peel strength of the gecko-inspired fibrillar surface is similar to the prediction of Kendall's peeling model for a smooth sheet; however, the increase rate, i.e. the derivative of peel strength with respect to the backing layer thickness, is not the same as that predicted by the model (figure 7a). In Kendall's peeling model, for a smooth elastic thin film, only the elastic deformation energy of the backing layer, which increases with the backing layer thickness, influences the peel strength. However, for the gecko-inspired micro-fibrillar surface, the deformation of the backing layer determines the length of the peel-zone and the peel strength. Therefore, the peel strength, the effective adhesion energy and then λr change with different backing layer thicknesses. According to equation (3.5), the strong attachment and easy-removal properties of parameter λ is inversely proportional to the effective adhesion energy; so the minimum backing layer thickness leading to the best performance can be achieved under the condition that fracture of the backing layer does not occur.
Figure 7.

The influence of the backing layer thickness on the peel strength of the gecko-inspired surface by taking typical parameters for θ = 30°, Δγ = 0.6 J m−2, νf = 0.45, h0 = 10 μm and R/a = 0.45. (a) The peel strength versus backing layer thickness. (b) λr at different backing layer thicknesses. Solid line circles denote numerical calculation; solid line with diamonds denote Kendall's model. (Online version in colour.)
The stiffness of backing layer can be given by
| 3.7 |
where I is the moment of inertia, E* = E/(1−ν2).
Therefore, the influence of modulus of the backing layer is the same as that of H3, whereas in Kendall's model, the influence of thickness of backing is the same as that of E*. It is important to note that the earlier-mentioned discussions consider only the bending of the backing layer without including extension deformation. The peel strength may, in actuality, be overvalued when the peel angle or the Young's modulus of backing layer are small.
4. Conclusions
In this study, a numerical method was proposed to investigate the effect of peel-zone on the peeling behaviour of fibrillar surfaces. The strong attachment and easy-removal properties, and also the effect of the geometrical parameters of fibrils and the backing layer stiffness on the peel-zone and the peel strength are all theoretically evaluated by using the numerical method proposed. The adhesion and peeling design maps are developed for bio-inspired attachment systems by taking account of the peeling behaviours. The numerical analysis showed that the optimization of the gecko-inspired surface is determined by the competition between the easy-removal property and the strong adhesive property to some extent, which achieves qualitative agreement with the biological contact elements. By choosing some typical values, the peeling strength and adhesion strength can vary by over three orders of magnitude. The adhesion and peeling design map established provides new insights into the design and development innovative gecko-inspired fibrillar surfaces.
Acknowledgements
This work is sponsored by the Natural Science Foundation of China (grant no. 51175281) and the National Basic Research Program of China (grant no. 2011CB707603). N.S.P. is supported by a PFund grant through the Louisiana Board of Regents. H.Z. acknowledges the support of the University of Alberta China Opportunity Fund and an NSERC Discovery Grant Award from the Natural Sciences and Engineering Research Council of Canada. We also thank two anonymous reviewers for helpful comments.
Appendix A. peeling model of gecko-inspired surface
A.1. Mechanical model at peel region
For a gecko-inspired surface with regular cylindrical fibrils, the radius of fibrils can be defined as R, the spacing as a and the height as h0, as shown in figure 1. When these fibrils detach from the smooth substrate, based on contact mechanics, the pull-off force of an individual fibril, denoted as vertical flat pillars Pi, can be approximated as [29,43]
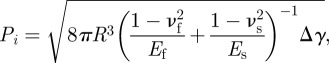 |
A1 |
where Ef and Es are the Young's modulus of fibrils and the substrate, respectively; νf and νs are Poisson's ratio of fibrils and the substrate, respectively; Δγ = γf + γs − γf,s is the work of adhesion between fibrils and the substrate, γf, γs, γf,s denote surface and interfacial energies of fibrils and the substrate. Therefore, the pull-off stress of an individual fibril is [40]
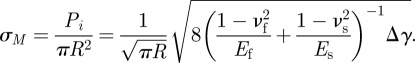 |
A2 |
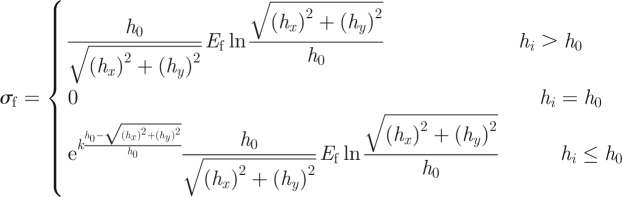
When the gecko-inspired surface is peeled off of a substrate at a certain angle, the fibrils stretch and deform until the tension stress exceeds the pull-off stress and detach from the smooth substrate, as shown in figure 1c. With a large deformation, the relationship between strain and length of the fibril can be described as follows [44]:
 |
A3 |
When fibrils are stretched, the neck becomes thinner, as shown in figure 1c. At the neck of fibrils, the relationship between stress and strain follows Hooke's Laws:
| A4 |
The area of the fibril end does not change prior to detachment, as the end of the fibril is continuously adherent to the substrate. Furthermore, the volume of the fibril Vf does not change, and therefore an approximate value can be obtained by
| A5 |
The forces at the end and the neck remain the same, denoted by P, and thus, the stress at the end and the neck can be expressed, respectively, as
| A6 |
and
| A7 |
Combining equations (A 3–A 7), the relationship between stress at the end and the length of the fibril can be determined as
| A8 |
Alternatively, when the fibril is compressed, the compression modulus becomes larger with an increase in compression, usually described as an exponential relationship
| A9 |
where k is the compression coefficient.
From figure 1c, the length of the deformed fibril appears to be related to its displacement along x- and y-axes. When the upper end of the fibril moves from P0(s(x),0) to P1(x, y), the length can be described as follows:
| A10 |
where hx = s(x) − x, hy = y + h0 and s is the length from the bifurcation at the peeling front to the point where detachment has occurred. Therefore,
 |
A11 |
When σf = Pi/πR2, the fibril detaches from the substrate. Pi is given by equation (A 1).
A.2. Numerical method
The peel region is divided into N elements along the x-axis, each length of which is ds. During peeling, each fibril detaches simultaneously from the element near the peel front. Therefore, the length of these elements should be smaller than the radius of fibrils, i.e.  . Figure 8 presents the schematic of meshing. For each element of these fibrils, the area of tensile or compression stress is approximately equal to the trapezoidal area constituted by the borders of the element and the Arc secants, as shown in figure 8b.
Figure 8.

A schematic of force analysis of typical elements of gecko-inspired surface. (a) A schematic side view of the elements with/without fibril segments. (b) A schematic bottom view of elements. For each element with a fibril segment, the area of tensile or compression stress is approximately equal to the trapezoidal area constituted by the borders of the element and the Arc secants. (Online version in colour.)
The force analysis of elements, with or without some part of the fibril, is shown in figure 8a. In general, the bending stress is much smaller than tensile or compression stresses in instances of large tensile or compression deformation. Therefore, the bending moment of the fibril can be ignored in order to simplify the calculation. In the following equation (A 13), the equivalent stress of each element can be determined as the product of the stress of the fibril at this element with the area fraction of stress.
Denoting the serial number of elements as i, for the ith element, the length of the part of the fibril is
| A12 |
where hi·x = i × ds − xi−1 − 0.5 ds × cos θi − 1, and hi·y = yi − 1 + 0.5 ds × sin θi − 1+h0. From equations (A 8) and (A 9)
 |
A13 |
The components along the x- and y-axis are, respectively,
| A14 |
and
| A15 |
For the first element, the normal force and the horizontal force are denoted as u0 and f0, respectively. For the last element, the resultant force is just the peeling force. Applying the numerical method proposed by Lin et al. [36] and Zhang et al. [37] when the initial values of F, u0, and f0 are given, the forces and bending moment of the consecutive elements can be calculated in turn from the first element to the last element at the edge of the peel region. The edge of the peel region can be determined by using the pull-off condition provided by equation (A 2). Then, by using boundary conditions, including balance of the normal force, the horizontal force and the bending moment, respectively, the residual error can be determined to revise the initial values. This is repeatedly iterated until the residual error is less than the small default constant. Finally, the peel force per unit width, i.e. peel strength F/b, can be solved.
Appendix B. discussions on the numerical method
For a material with an adhesion energy of 0.6 J m−2 with the substrate, the Poisson's ratio is 0.45 and the Young's modulus of fibrils and backing layer is 2 MPa [10]. With the geometrical parameters, including the radius (5 μm), spacing (20 μm), the length of fibrils (10 μm) and the thickness of the backing layer (0.35 mm), the peel strength F/b can be calculated with different compression coefficients defined in equation (A 9), as shown in figure 9. The results indicate that, when k changes across a large range, the peel strengths calculated change slightly, by approximately 8 per cent. This could be attributed to the discrete elements that lead to the error of calculation results in the numerical integration. Therefore, the compression coefficient k does not affect the calculated results significantly.
Figure 9.
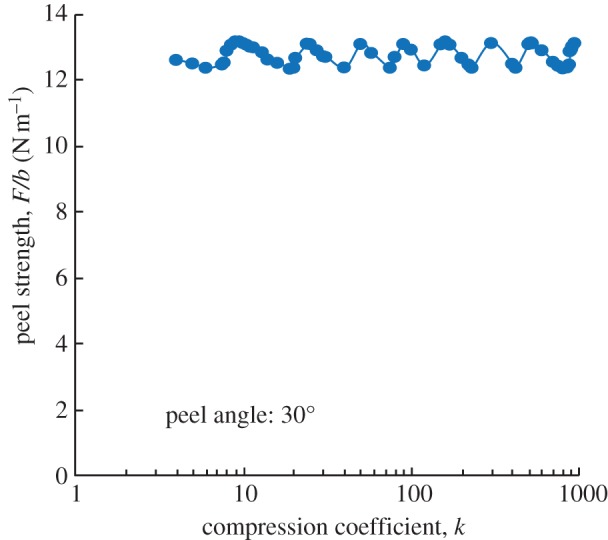
For a material with the adhesion energy 0.6 J m−2 with substrate, Poisson's ratio of 0.45 and the Young's modulus of fibrils and backing layer at 2 MPa [10], the geometrical parameters (including the radius (5 μm), spacing (20 μm), length of fibrils (10 μm) and also the thickness of the backing layer (0.35 mm)), can be used to calculate the peel strength F/b with different compression coefficients defined in equation (A 9). (Online version in colour.)
During numerical calculation, the maximum compression strain was about 0.05. By considering an earlier experiment on polymers [44], and by fitting the stress–strain curves at the compression strain from 0 to 0.1 and at different strain rates, the k obtained was in the range of 3–19. The compression coefficient of uniaxial compression relates to the geometry and molecular chain of the polymer. Therefore, k cannot be the same under different experimental conditions and for different polymers, leading to difficulty in determining precisely the k-value. In view of our finding that the compression coefficient k does not affect the calculation of results significantly, k = 20 is used in the following calculations.
For a material with the adhesion energy 0.6 J m−2 with a substrate, Poisson's ratio of 0.45 and the Young's modulus of fibrils and backing layer at 2 MPa8, the geometrical parameters, including the radius (5 μm), spacing (20 μm) and length of fibrils (10 μm) and also the thickness of the backing layer (0.35 mm), can be used to calculate the peel strength F/b at different meshing size, as shown in figure 10a. These results indicate that, with decreasing meshing size, the peel strength calculated converges to a fixed value. With decreases in the Young's modulus of fibrils, the meshing length should also be reduced to obtain precise results to account for the property of the gecko-inspired surface to deform easily, as shown in figure 10a. The relationship between the reasonable critical meshing length and Young's modulus of fibrils is fitted in figure 10b.
Figure 10.

For a material with the adhesion energy 0.6 J m−2 with substrate, Poisson's ratio of 0.45 and the Young's modulus of backing layer at 2 MPa [10], the geometrical parameters (including the radius (5 μm), spacing (20 μm), length of fibrils (10 μm) and also the thickness of the backing layer (0.35 mm)), can be used to calculate the effect of meshing length on the peel strength F/b. (a) The peel strength F/b calculated at different length meshing. (b) The fitting relationship between the reasonable critical meshing length and the Young's modulus of fibrils. (Online version in colour.)
For fibrils of Young's modulus of 3 MPa, with the meshing length of 0.1 μm and other parameters of the gecko-inspired surface described earlier, the exact shape, the stress of fibrils and the local force of backing layer of peel region are determined, as shown in figure 11a,b. The stress of fibrils at the point without fibrils is 0. Therefore, horizontal and normal stresses of the backing layer demonstrate a ladder-shaped appearance. The circumscribing line of the curves for stress of fibrils plotted against x is similar to the stress distribution of pressure-sensitive adhesive tape during peeling that was calculated by Plaut & Ritchie [45]. Furthermore, these results indicate that the length of the peel region is about 1 mm, and comprises two parts: a compression region where fibrils are compressed and the apparent peel-zone where fibrils are stretched. The apparent peel-zone can be observed intuitively in experiments, and has been discussed and analysed in several articles [17,30,32,36,45]. The shape of the apparent peel-zone can be calculated by the earlier-mentioned numerical method and is approximately equivalent to a circular shape as shown in figure 11c, which in accordance with the microscopic observation reported by Pesika et al. [17]. However, it is difficult to observe the compression region of peel region, as there is only a slight deformation [46]. An advantage of this numerical method is that it depicts the distribution of several physical quantities at the peel region directly. Furthermore, the apparent peel-zone lengths at different peeling angles are shown in figure 11d. The trend in these lengths is consistent with the normal component of peel strength. This indicates that the apparent peel-zone determines the adhesive peel force, which is accordance with the report by Pesika et al. [17] and Peng et al. [26].
Figure 11.

Results calculated for a material with adhesion energy of 0.6 J m−2 with substrate, the Poisson's ratio of 0.45, the Young's modulus of backing layer of 2 MPa and the Young's modulus of fibrils of 3 MPa, by using the geometrical parameter of the radius (5 μm) of fibrils are depicted here. (a) The shape of the peel region and force distribution. Forces greater than zero indicate that the fibril is stretched, and values less than zero indicate that the fibril is compressed (red curve denotes peel zone shapes; blue curve denotes stress of fibres). (b) The normal and horizontal stress per width of the backing layer. The forward directions of the normal and horizontal stresses are the same as the y, x direction, respectively, shown in figure 8 (purple curve denotes vertical stress of backing layer; red curve denotes horizontal stress of backing layer). (c) The apparent peel-zone of numerical calculation and its circular approximation (blue curve denotes numerical calculation; red curve denotes the circular approximation). (d) At different peeling angles, the normal component of peel strength and the apparent peel-zone length are presented here (blue circles denote normal component of peel strength; red triangles denote the peel zone length). (Online version in colour.)
Appendix C. energy analysis on the peeling behaviours
During peeling, each fibril is stretched and the elastic tensile stress increases until it exceeds the pull-off stress. As the fibrils are very small, the parameters, such as numbers of fibrils, the deformation of fibrils and substrate and so on, can be considered to be the same during the peeling process—i.e. with the same elastic energy of the peel region Therefore, after peeling the gecko-inspired surface with a length Δc, the dissipated elastic energy is actually the maximum elastic energy of the fibrils stored in the peel-zone (the gecko-inspired surface with the length of Δc) prior to their detaching from the substrate. On the basis of earlier-mentioned analysis, the energy balance equation can be described as follows:
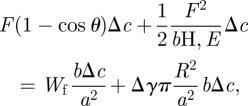 |
A16 |
where Wf is the maximum elastic energy of an individual fibril prior to its detachment, and WfbΔc/a2 is the dissipative elastic energy term. Equation (A 16) can be simplified as
| A17 |
As a comparison with Kendall's equation, the effective adhesion energy of fibrillar surfaces is
| A18 |
For the linear elastic material,
| A19 |
The linear elastic deformation may actually occur only in a small area very close to the upper and the bottom ends of the fibril. At the neck of the fibril, there is a large neck shrink deformation. The maximum possible elastic energy density wf,max is
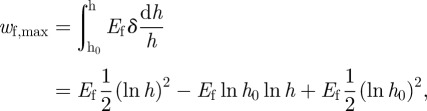 |
A20 |
where δ is described as equation (A 4). The actual deformation is complex, non-uniform. Therefore, Ef is in the range between those predicted in the earlier-mentioned two cases and is described as follows:
| A21 |
References
- 1.Dickrell P. L., Sinnott S. B., Hahn D. W., Raravikar N. R., Schadler L. S., Ajayan P. M., Sawyera W. G. 2005. Frictional anisotropy of oriented carbon nanotube surfaces. Tribol. Lett. 18, 59–62 10.1007/s11249-004-1752-0 (doi:10.1007/s11249-004-1752-0) [DOI] [Google Scholar]
- 2.Lee H., Lee B. P., Messersmith P. B. 2007. A reversible wet/dry adhesive inspired by mussels and geckos. Nature 448, 334–338 10.1038/nature05968 (doi:10.1038/nature05968) [DOI] [PubMed] [Google Scholar]
- 3.Liley M., et al. 1998. Friction anisotropy and asymmetry of a compliant monolayer induced by a small molecular tilt. Science 280, 273–275 10.1126/science.280.5361.273 (doi:10.1126/science.280.5361.273) [DOI] [PubMed] [Google Scholar]
- 4.Qu L., Dai L., Stone M., Xia Z., Wang Z. L. 2008. Carbon nanotube arrays with strong shear binding-on and easy normal lifting-off. Science 322, 238–242 10.1126/science.1159503 (doi:10.1126/science.1159503) [DOI] [PubMed] [Google Scholar]
- 5.Arzt E., Gorb S., Spolenak R. 2003. From micro to nano contacts in biological attachment devices. Proc. Natl Acad. Sci. USA 100, 10 603–10 606 10.1073/pnas.1534701100 (doi:10.1073/pnas.1534701100) [DOI] [PMC free article] [PubMed] [Google Scholar]
- 6.Gao H. J., Yao H. M. 2004. Shape insensitive optimal adhesion of nanoscale fibrillar structures. Proc. Natl Acad. Sci. USA 101, 7851–7856 10.1073/pnas.0400757101 (doi:10.1073/pnas.0400757101) [DOI] [PMC free article] [PubMed] [Google Scholar]
- 7.Geim A. K., Dubonos S. V., Grigorieva I. V., Novoselov K. S., Zhukov A. A., Shapoval S. Y. 2003. Microfabricated adhesive mimicking gecko foot-hair. Nat. Mater. 2, 461–463 10.1038/nmat917 (doi:10.1038/nmat917) [DOI] [PubMed] [Google Scholar]
- 8.Glassmaker N. J., Jagota A., Hui C. Y., Kim J. 2011. Design of biomimetic fibrillar interfaces: 1. Making contact. J. R. Soc. Interface 1, 23–33 10.1098/rsif.2004.0004 (doi:10.1098/rsif.2004.0004) [DOI] [PMC free article] [PubMed] [Google Scholar]
- 9.Gorb S., Varenberg M., Peressadko A., Tuma J. 2007. Biomimetic mushroom-shaped fibrillar adhesive microstructure. J. R. Soc. Interface 4, 271–275 10.1098/rsif.2006.0164 (doi:10.1098/rsif.2006.0164) [DOI] [PMC free article] [PubMed] [Google Scholar]
- 10.Sameoto D., Menon C. 2009. Direct molding of dry adhesives with anisotropic peel strength using an offset lift-off photoresist mold. J. Micromech. Microeng. 19, 1–5 10.1088/0960-1317/19/11/115026 (doi:10.1088/0960-1317/19/11/115026) [DOI] [Google Scholar]
- 11.Zeng H. B., Pesika N., Tian Y., Zhao B. X., Chen Y. F., Tirrell M., Turner K. L., Israelachvili J. N. 2009. Frictional adhesion of patterned surfaces and implications for gecko and biomimetic systems. Langmuir 25, 7486–7495 10.1021/la900877h (doi:10.1021/la900877h) [DOI] [PubMed] [Google Scholar]
- 12.Zhao B. X., Pesika N., Zeng H. B., Wei Z. S., Chen Y. F., Autumn K., Turner K., Israelachvili J. 2009. Role of tilted adhesion fibrils (setae) in the adhesion and locomotion of gecko-like systems. J. Phys. Chem. B 113, 3615–3621 10.1021/jp806079d (doi:10.1021/jp806079d) [DOI] [PubMed] [Google Scholar]
- 13.Verdier C., Piau J. M., Benyahia L. 1998. Peeling of acrylic pressure sensitive adhesives: cross-linked versus uncross-linked adhesives. J. Adhesion 68, 93–116 10.1080/00218469808029581 (doi:10.1080/00218469808029581) [DOI] [Google Scholar]
- 14.Wei Y., Hutchinson J. W. 1998. Interface strength, work of adhesion and plasticity in the peel test. Int. J. Fracture 93, 315–333 10.1023/A:1007545200315 (doi:10.1023/A:1007545200315) [DOI] [Google Scholar]
- 15.Lee S., Jensen L., Langford S. 1995. Electrical transients generated by the peel of a pressure sensitive adhesive tape from a copper substrate. J. Adhes. Sci. Technol. 9, 1–26 10.1163/156856195X00266 (doi:10.1163/156856195X00266) [DOI] [Google Scholar]
- 16.Autumn K., Dittmore A., Santos D., Spenko M., Cutkosky M. 2006. Frictional adhesion: a new angle on gecko attachment. J. Exp. Biol. 209, 3569–3579 10.1242/jeb.02486 (doi:10.1242/jeb.02486) [DOI] [PubMed] [Google Scholar]
- 17.Pesika N. S., Tian Y., Zhao B. X., Rosenberg K., Zeng H. B., McGuiggan P., Autumn K., Israelachvili J. N. 2007. Peel-zone model of tape peeling based on the gecko adhesive system. J. Adhesion 83, 383–401 10.1080/00218460701282539 (doi:10.1080/00218460701282539) [DOI] [Google Scholar]
- 18.Tian Y., Pesika N., Zeng H. B., Rosenberg K., Zhao B. X., McGuiggan P., Autumn K., Israelachvili J. 2006. Adhesion and friction in gecko toe attachment and detachment. Proc. Natl Acad. Sci. USA 103, 19 320–19 325 10.1073/pnas.0608841103 (doi:10.1073/pnas.0608841103) [DOI] [PMC free article] [PubMed] [Google Scholar]
- 19.Persson B. 2003. On the mechanism of adhesion in biological systems. J. Chem. Phys. 118, 7614–7621 10.1063/1.1562192 (doi:10.1063/1.1562192) [DOI] [Google Scholar]
- 20.Persson B., Gorb S. 2003. The effect of surface roughness on the adhesion of elastic plates with application to biological systems. J. Chem. Phys. 119, 11 437–11 444 10.1063/1.1621854 (doi:10.1063/1.1621854) [DOI] [Google Scholar]
- 21.Autumn K., et al. 2002. Evidence for van der waals adhesion in gecko setae. Proc. Natl Acad. Sci. USA 99, 12 252–12 256 10.1073/pnas.192252799 (doi:10.1073/pnas.192252799) [DOI] [PMC free article] [PubMed] [Google Scholar]
- 22.Chen S. H., Gao H. J. 2007. Bio-inspired mechanics of reversible adhesion: orientation-dependent adhesion strength for non-slipping adhesive contact with transversely isotropic elastic materials. J. Mech. Phys. Solids 55, 1001–1015 10.1016/j.jmps.2006.10.008 (doi:10.1016/j.jmps.2006.10.008) [DOI] [Google Scholar]
- 23.Dai Z. D., Tong J., Ren L. Q. 2006. Researches and developments of biomimetics in tribology. Chinese Sci. Bull. 51, 2681–2689 10.1007/s11434-006-2184-z (doi:10.1007/s11434-006-2184-z) [DOI] [Google Scholar]
- 24.Gao H. J., Wang X., Yao H. M., Gorb S., Arzt E. 2005. Mechanics of hierarchical adhesion structures of geckos. Mech. Mater. 37, 275–285 10.1016/j.mechmat.2004.03.008 (doi:10.1016/j.mechmat.2004.03.008) [DOI] [Google Scholar]
- 25.Glass P., Chung H. Y., Washburn N. R., Sitti M. 2009. Enhanced reversible adhesion of dopamine methacrylamide-coated elastomer microfibrillar structures under wet conditions. Langmuir 25, 6607–6612 10.1021/la9009114 (doi:10.1021/la9009114) [DOI] [PubMed] [Google Scholar]
- 26.Peng Z. L., Chen S. H., Soh A. K. 2010. Peeling behavior of a bio-inspired nano-film on a substrate. Int. J. Solids Struct. 47, 1952–1960 10.1016/j.ijsolstr.2010.03.035 (doi:10.1016/j.ijsolstr.2010.03.035) [DOI] [Google Scholar]
- 27.Shahsavan H., Zhao B. X. 2011. Conformal adhesion enhancement on biomimetic microstructured surfaces. Langmuir 27, 7732–7742 10.1021/la200893n (doi:10.1021/la200893n) [DOI] [PubMed] [Google Scholar]
- 28.Poulard C., Restagno F., Weil R., Leger L. 2011. Mechanical tuning of adhesion through micro-patterning of elastic surfaces. Soft Matter 7, 2543–2551 10.1039/c0sm01099e (doi:10.1039/c0sm01099e) [DOI] [Google Scholar]
- 29.Spolenak R., Gorb S., Gao H. J., Arzt E. 2005. Effects of contact shape on the scaling of biological attachments. Proc. R. Soc. A 461, 305–319 10.1098/rspa.2004.1326 (doi:10.1098/rspa.2004.1326) [DOI] [Google Scholar]
- 30.Cheng Q. H., Chen B., Gao H. J., Zhang Y. W. 2011. Sliding-induced non-uniform pretension governs robust and reversible adhesion: a revisit of adhesion mechanisms of geckos. J. R. Soc. Interface 9, 283–291 10.1098/rsif.2011.0254 (doi:10.1098/rsif.2011.0254) [DOI] [PMC free article] [PubMed] [Google Scholar]
- 31.Georgiou I., Hadavinia H., Ivankovic A., Kinloch A. J., Tropsa V., Williams J. G. 2003. Cohesive zone models and the plastically deforming peel test. J. Adhesion 79, 239–265 10.1080/00218460390148121 (doi:10.1080/00218460390148121) [DOI] [Google Scholar]
- 32.Pugno N. M. 2011. The theory of multiple peeling. Int. J. Fract. 171, 185–193 10.1007/s10704-011-9638-2 (doi:10.1007/s10704-011-9638-2) [DOI] [Google Scholar]
- 33.Ghatak A., Mahadevan L., Chung J. Y., Chaudhury M. K., Shenoy V. 2004. Peeling from a biomimetically patterned thin elastic film. Proc. R. Soc. Lond. A 460, 2725–2735 10.1098/rspa.2004.1313 (doi:10.1098/rspa.2004.1313) [DOI] [Google Scholar]
- 34.Mahdavi A., et al. 2008. A biodegradable and biocompatible gecko-inspired tissue adhesive. Proc. Natl Acad. Sci. USA 105, 2307–2312 10.1073/pnas.0712117105 (doi:10.1073/pnas.0712117105) [DOI] [PMC free article] [PubMed] [Google Scholar]
- 35.Vajpayee S., Khare K., Yang S., Hui C. Y., Jagota A. 2011. Adhesion selectivity using rippled surfaces. Adv. Funct. Mater. 21, 547–555 10.1002/adfm.201001652 (doi:10.1002/adfm.201001652) [DOI] [Google Scholar]
- 36.Lin Y. Y., Hui C. Y., Wang Y. C. 2002. Modeling the failure of an adhesive layer in a peel test. J. Polym. Sci. Pol. Phys. 40, 2277–2291 10.1002/polb.10289 (doi:10.1002/polb.10289) [DOI] [Google Scholar]
- 37.Zhang L., Wang J. 2009. A generalized cohesive zone model of the peel test for pressure-sensitive adhesives. Int. J. Adhes. Adhes. 29, 217–224 10.1016/j.ijadhadh.2008.05.002 (doi:10.1016/j.ijadhadh.2008.05.002) [DOI] [Google Scholar]
- 38.Kendall K. 1975. Thin-film peeling: the elastic term. J. Phys. D Appl. Phys. 8, 1449–1452 10.1088/0022-3727/8/13/005 (doi:10.1088/0022-3727/8/13/005) [DOI] [Google Scholar]
- 39.Lamblet M., Verneuil E., Vilmin T., Buguin A., Silberzan P., Leger L. 2007. Adhesion enhancement through micropatterning at polydimethylsiloxane–acrylic adhesive interfaces. Langmuir 23, 6966–6974 10.1021/la063104h (doi:10.1021/la063104h) [DOI] [PubMed] [Google Scholar]
- 40.Spolenak R., Gorb S., Arzt E. 2005. Adhesion design maps for bio-inspired attachment systems. Acta Biomater. 1, 5–13 10.1016/j.actbio.2004.08.004 (doi:10.1016/j.actbio.2004.08.004) [DOI] [PubMed] [Google Scholar]
- 41.Canas N., Kamperman M., Voelker B., Kroner E., McMeeking R. M., Arzt E. 2012. Effect of nano- and micro-roughness on adhesion of bioinspired micropatterned surfaces. Acta Biomater. 8, 282–288 10.1016/j.actbio.2011.08.028 (doi:10.1016/j.actbio.2011.08.028) [DOI] [PubMed] [Google Scholar]
- 42.Greiner C., Spolenak R., Arzt E. 2009. Adhesion design maps for fibrillar adhesives: the effect of shape. Acta Biomater. 5, 597–606 10.1016/j.actbio.2008.09.006 (doi:10.1016/j.actbio.2008.09.006) [DOI] [PubMed] [Google Scholar]
- 43.Kendall K. 1971. Adhesion and surface energy of elastic solids. J. Phys. D Appl. Phys. 4, 1186–1195 10.1088/0022-3727/4/8/320 (doi:10.1088/0022-3727/4/8/320) [DOI] [Google Scholar]
- 44.Dupaix R. B., Boyce M. C. 2005. Finite strain behavior of poly(ethylene terephthalate) (pet) and poly(ethylene terephthalate)-glycol (petg). Polymer 46, 4827–4838 10.1016/j.polymer.2005.03.083 (doi:10.1016/j.polymer.2005.03.083) [DOI] [Google Scholar]
- 45.Plaut R. H., Ritchie J. L. 2004. Analytical solutions for peeling using beam-on-foundation model and cohesive zone. J. Adhesion 80, 313–331 10.1080/00218460490445832 (doi:10.1080/00218460490445832) [DOI] [Google Scholar]
- 46.Williams J. A., Kauzlarich J. J. 2006. Energy and force distributions during mandrel peeling of a flexible tape with a pressure-sensitive adhesive. J. Adhes. Sci. Technol. 20, 661–676 10.1163/156856106777412464 (doi:10.1163/156856106777412464) [DOI] [Google Scholar]