

Abstract
Hydrophobins are small proteins secreted by fungi, which self-assemble into amphipathic membranes at air–liquid or liquid–solid interfaces. The physical and chemical properties of some hydrophobins, both in solution and as a biofilm, are affected by poly or oligosaccharides. We have studied the interaction between glucose and the hydrophobin Vmh2 from Pleurotus ostreatus by spectroscopic ellipsometry (SE), atomic force microscopy (AFM) and water contact angle (WCA). We have found that Vmh2–glucose complexes forms a chemically stable biofilm, obtained by drop deposition on silicon, 1.6 nm thick and containing 35 per cent of glucose, quantified by SE. AFM highlighted the presence of nanometric rodlet-like aggregates (average height, width and length being equal to 3.6, 23.8 and 40 nm, respectively) on the biofilm surface, slightly different from those obtained in the absence of glucose (4.11, 23.9 and 64 nm). The wettability of a silicon surface, covered by the organic layer of Vmh2–glucose, strongly changed: WCA decreased from 90° down to 17°.
Keywords: surface modification, protein biofilm, spectroscopic ellipsometry, atomic force microscopy
1. Introduction
How proteins are adsorbed and organized at liquid–solid interfaces is a key issue for biosensor and biomaterial applications. The properties of the biological layer strongly depend on the physical and chemical phenomena that drive protein deposition [1]. Mass transport, binding mechanisms and solution composition have been extensively studied, and a lot of experimental techniques have been proposed to characterize the adsorption process [2,3]. Protein-functionalized surfaces are a hot topic in life sciences and are becoming more and more popular also in the medical field: protein-based microarrays and biosensors, protein delivery in human body and protein-mediated tissue engineering, all these applications require that their structures are preserved once adsorbed on a surface and their bioactivity is unchanged or even increased [4].
Hydrophobins are small proteins produced by fungi, constituted by about 100 amino acid residues [5]. They are able to self-assemble into amphipathic membranes at air–liquid or solid–liquid interfaces. Even if the mechanism of biofilm formation is not completely determined, then it is commonly accepted that the whole membrane is constituted by monomeric proteins [6]. Beyond their natural functions, hydrophobins show very peculiar chemical–physical properties, which are of interest for biotechnologists because they could be used in relevant industrial applications [7]. In particular, the chemical stability of the nanometric hydrophobin biofilms could be very attractive for surface functionalization as an alternative to classic passivation methods.
Hydrophobins are divided into two classes on the basis of the stability of assembled biofilms [8,9]. Class I hydrophobins forms highly insoluble assemblies, which can be dissolved in strong solvents such as formic acid and trifluoroacetic acid (TFA), whereas class II biofilms can be dissolved in ethanol or in sodium dodecyl sulphate (SDS). One distinguishing feature of class I hydrophobins is their ability to form nanometric rodlets, similar to amyloid fibrils [10,11], which are very stable protein aggregates with β sheet structure. Moreover, the class I hydrophobin biofilm is not only highly resistant to aggressive chemicals [12,13] but it could also serve as an active substrate for binding other biomolecules, organic substances or even cells [14–16]. In particular, interaction between sugars and some class I hydrophobins has been studied. Scholtmeijer et al. [17] have demonstrated that some polysaccharides promote rodlet formation of the class I hydrophobin SC3 at the interface between water and air or at a hydrophobic surface. Furthermore, it has been proved that the growth of amyloid fibrils, related to severe diseases, can be accelerated by glycosaminoglycans and proteoglycans [18,19]. The mechanism by which these sugars stimulate amyloid formation and the nature of carbohydrates–proteins interaction are largely unknown, even if the binding of polysaccharides to proteins has been observed. Moreover, carbohydrates play a vital role in biological functions such as cell–cell recognition, immunological response, metastasis and fertilization. The introduction of biofunctionalities by integration of carbohydrates in a protein-modified surface could pave a new way to bionanotechnology. Carbohydrate-functionalized surfaces can be used to detect bacteria, to bind specific lectins, to deliver glycomimetic drug molecules into cells and to probe cellular activities as biosensors [20]. In a recent paper, we described the interaction between the class I hydrophobin Vmh2 of Pleurotus ostreatus and glucans (glucose-based cyclic and linear polysaccharides, and glucose monomers) in aqueous solutions [21]. Purified, TFA-treated Vmh2 is not water-soluble but can be solubilized in 60 per cent ethanol. In contrast, complexes formed by Vmh2 and glucans are soluble in water, after TFA treatment. In this work, we have focused our research on Vmh2–glucose interaction in order to better understand the influence of sugar on protein self-assembly and to throw the basis for multiple potential applications in biomaterial, biosensor and device fields [22,23].
2. Experimental section
2.1. Materials
The class I hydrophobin Vmh2 secreted by the fungus P. ostreatus was purified as previously described [21]. We prepared two types of samples: the first one, hereafter cited as Vmh2P, by dissolving the pure protein after the TFA treatment in an ethanol-deionized water (60 : 40 v/v) solution; the second one, hereafter cited as Vmh2G, by dissolving Vmh2 after the TFA treatment in a glucose solution (0.6 mg ml−1 in water). The concentration of Vmh2G and Vmh2P was evaluated using the PIERCE 660 nm protein assay kit, because it is compatible with both glucose and organic solvents.
2.2. Biofilm preparation
The biological films investigated in this work have been obtained by self-assembling of the Vmh2 samples on silicon substrates. To this aim, highly doped p+ silicon wafer (Virginia Semiconductors, Inc.), 〈100〉 oriented, 0.003 Ω cm resistivity, 400 µm thick, was cut into 10 × 10 mm square pieces. The silicon substrates were cleaned using the standard RCA process [24] and dried in a stream of nitrogen gas. Two sets of five samples were prepared by spotting one set on the Vmh2P solution and the other on the Vmh2G solution, both at 0.2 mg ml−1. Silicon chips were coated in both cases by 150 µl of solution for 1 h, dried for 10 min on a hot plate at 80°C and then washed with the respective solvents. The incubation process was repeated two times. Then, the samples were treated for 10 min at 100°C in 2 per cent SDS and again washed in deionized water.
2.3. UV–vis spectroscopy
UV–vis spectroscopy measurements on Vmh2P and on glucose (400 mg ml−1 in water) solutions were made using a Uvikon 930 spectrophotometer. The absorbance spectra were acquired over the 200–600 nm, range with a resolution of 1 nm. Each spectrum was measured at least twice.
2.4. Spectroscopic ellipsometry
Spectroscopic ellipsometry (SE) measurements were performed by a Jobin Yvon UVISEL-NIR phase-modulated spectroscopic ellipsometer apparatus, at an angle of incidence of 65° over the 300–1600 nm range, with a resolution of 5 nm. The instrument measures the spectral variation of the ellipsometric angles Ψ and Δ defined through the following relation:
| 2.1 |
where Rp and Rs are the complex reflection coefficients of the light-polarized parallel and perpendicular to the plane of incidence. The optical properties (refractive index and extinction coefficient), the thickness and the composition of the films assembled on silicon were determined from the ellipsometric data analysis using Delta Psi software [25].
2.5. Atomic force microscopy
A NanoScope V multimode AFM (Digital Instruments/Veeco) was used for the imaging of biofilms. Surface imaging was obtained in tapping mode using silicon- or aluminium-coated cantilevers (125 μm long with a resonance frequency of 200–400 Hz and nominal force constant of 40 N m−1).
The scan frequency was typically 1 Hz per line, and images were flattened to a second-order polynomial. Quantitative measurements have not been corrected by tip dimensions. Roughness has been calculated on 1 × 1 μm images.
2.6. Water contact angle measurements
Sessile drop technique has been used for water contact angle (WCA) measurements on an OCA 30—DataPhysics coupled with a drop shape analysis software. Five measurements were analysed for the both sets of Vmh2P and Vmh2G samples.
2.7. Glucose determination by phenol–sulphuric acid test
The silicon chip, coated by Vmh2P or by Vmh2G, were treated with sulphuric acid (1 ml) and 5 per cent phenol. Each chip was incubated in the solution for 10 min at room temperature and for 20 min at 37°C; then the absorbance at 485 nm was determined. Glucose solutions at standard concentrations were used as reference.
3. Results and discussion
In our previous work [13], we proved the extreme chemical stability of the Vmh2P biofilm: once the solvent of the drop casted on the silicon surface evaporated, the self-assembled protein layer could not be destroyed by washing the coated chip at 100°C in 2 per cent SDS; moreover, the Vmh2P biofilm was able to protect the silicon surface against a KOH hot (80°C) etch process. This last result is also indirect evidence that the protein biofilm forms a quite uniform confluent layer: the KOH is a small molecule that cannot dissolve it or pass through it. The Vmh2P could also form rodlet-like structures that can be found on the biofilm surface (comments on figure 5 in the following). In the case of pure glucose, it was not possible to create a stable layer on the silicon surface because the sugar was completely removed from the support just by a quick dip in deionized water at room temperature. For this reason, the glucose sample for ellipsometric characterization was just the amount of sugar left after water evaporation on the silicon, without any rinsing step. The biofilm formed by hydrophobins and glucose showed the same high chemical persistence as Vmh2P did: the membrane cannot be removed by hot SDS washing. This result has been confirmed by both ellipsometric and WCA measurements, as reported in the following, but also by a phenol–sulphuric acid test. The test, replicated in triplicate for each kind of sample, was negative in the case of a silicon chip coated by Vmh2G (which means that all the sugar in the layer are not removed), whereas it resulted positive on a silicon chip treated with the same amount of glucose present in the Vmh2G sample. Owing to the sensitivity limit of this kind of method, we underline that the results can be taken only as qualitative and that the amount of sugar cannot be quantified precisely.
Figure 5.

Atomic force microscope images of silicon coated with (a) Vmh2P and (b) Vmh2G biofilms. (Online version in colour.)
In figure 1, the absorption spectra of Vmh2P and highly concentrated glucose solutions are reported. The Vmh2P spectrum shows an absorption peak at 210 nm due to the presence of the peptide bonds, and a broad band between 240 and 350 nm centred at 280 nm, due to aromatic amino acid residues. In the same wavelength range, the glucose is characterized by negligible absorption. These results have been used in the ellipsometric analysis of biofilms deposited on the silicon surface for a correct choice of material models: ellipsometry allows us to estimate the refractive index, the thickness and the composition of the biological films self-assembled on the silicon surface.
Figure 1.
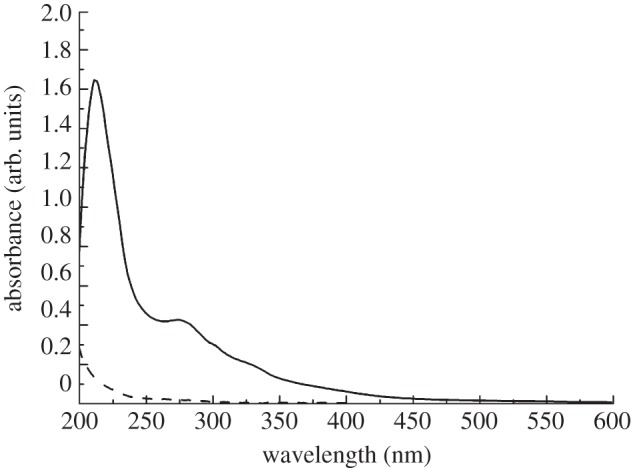
The absorption spectra of Vmh2P (solid line, 0.2 mg ml−1) solution and of glucose aqueous (dashed line, 400 mg ml−1) solution.
Before the ellipsometric characterization of the Vmh2G biofilm, we studied the optical parameters (i.e. the refractive index n and the extinction coefficient k) of pure hydrophobin Vmh2 and pure glucose, both on silicon. In figure 2a,b, n and k, as functions of the wavelength, are reported for pure Vmh2 and for glucose, respectively.
Figure 2.
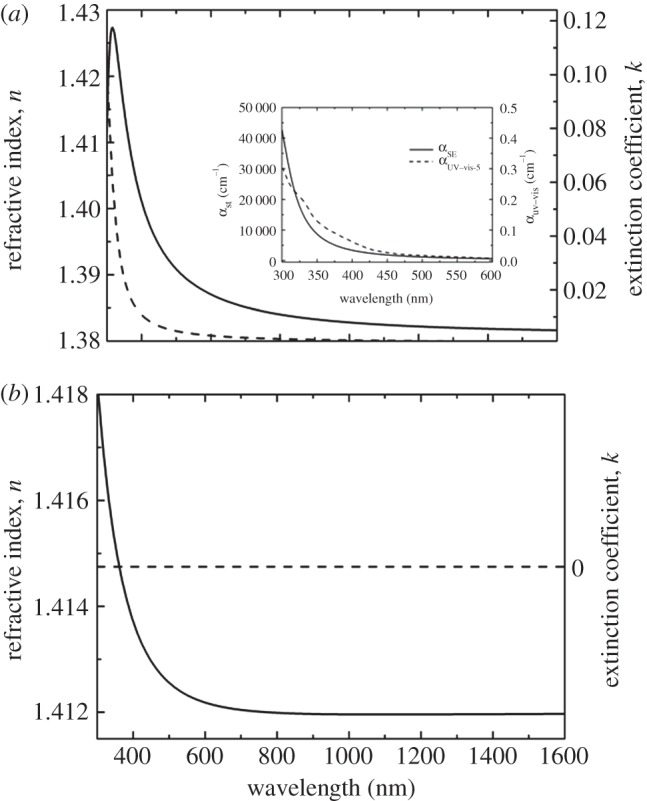
Dispersion of refractive index and extinction coefficient of (a) Vmh2 and (b) glucose deposited on silicon. The inset of (a) shows a comparison between the absorption coefficients αSE obtained by spectroscopic ellipsometry and αuv–vis measured by UV–vis spectroscopy in the case of pure protein. Solid line denotes n; dashed line denotes k.
In the case of the protein, the curves have been determined by fitting the experimental results using the dispersion relation developed by Cauchy [26] for transparent dielectric materials and including, as additional term, a single Lorentz oscillator, taking into account the absorption between 290 and 450 nm. The expression of the dielectric function, related to n and k by the relationship ɛ = (n + ik)2, used in the fitting procedure is given by
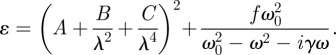 |
3.1 |
This equation includes six fitting parameters: the Cauchy coefficients A, B and C, and the amplitude f, the resonant frequency ω0 and the broadening γ of the Lorentzian. Owing to the almost zero absorbance of glucose, as it can be observed in figure 1, the optical function has been modelled by the Cauchy dispersion relationship (first term in equation (3.1)).
The values of the fitting parameters, determined from the analysis of the experimental spectra, are reported in table 1, together with the statistical parameter χ2. In the interval of wavelengths investigated, the refractive index values of glucose are slightly higher than those of Vmh2P although it does not absorb radiation: these differences allow SE the quantification of both substances once self-assembled in a composite biofilm. In the case of the Vmh2P, the behaviour of the absorption coefficient α, also expressed in terms of extinction coefficient k through the relationship α = (4π/λ)k, is in good agreement with that determined by UV–vis spectroscopic analysis (see inset in figure 2a).
Table 1.
Fitting parameters obtained from the fit to the ellipsometric spectra of Vmh2 and glucose films on silicon.
| material | A | B | C | f | ω0 | γ | χ2 |
|---|---|---|---|---|---|---|---|
| Vmh2P | 1.85 ± 0.02 | −0.2 ± 0.2 | 0.05 ± 0.03 | 0.059 ± 0.008 | 4.31 ± 0.03 | 0.75 ± 0.09 | 0.09 |
| glucose | 1.14 ± 0.04 | −0.01 ± 0.01 | 0.068 ± 0.01 | — | — | — | 0.05 |
Figure 3a,b shows the Ψ and Δ experimental spectra in the case of Vmh2P and Vmh2G films self-assembled on silicon, together with the calculated spectra and the material models used to fit them.
Figure 3.
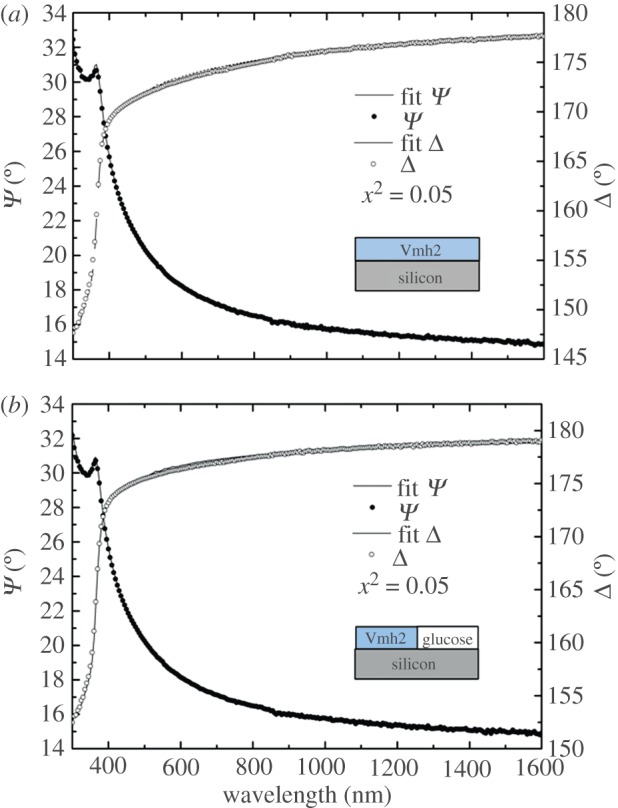
Measured and calculated Ψ and Δ spectra of (a) Vmh2P and (b) Vmh2G biofilms self-assembled on a silicon substrate. (Online version in colour.)
From the optical point of view, the Vmh2P biofilm can be modelled by a simple homogeneous layer, at least considering it continuous at the micrometric scale, the fitting parameter being the film thickness. The Vmh2G biofilm has been considered as a mixture of two constituents—the glucose and the pure protein: in this case, the organic layer has been modelled using the Bruggeman effective medium approximation (EMA) [27]; the fitting parameters are now the thickness and the content of glucose in the biofilm, considered as host in the protein matrix. The results of this analysis have been obtained as the average of five different measurements on the same sample, in order to statistically take into account slight biofilm inhomogeneities. A glucose content of (35 ± 4)% in the protein–glucose biofilm has been found, with a layer thickness of (1.6 ± 0.1) nm, which is smaller than the thickness of the pure Vmh2 self-assembled on silicon (3.92 ± 0.06 nm).
Figure 4 reports the comparison of Δ spectra of a bare silicon surface together with those of coated silicon by pure protein, and by Vmh2–glucose biofilms. A change in Δ, owing to the presence of the protein, has been measured; in particular, we can observe a decrease at an increase in thickness of the organic layer.
Figure 4.
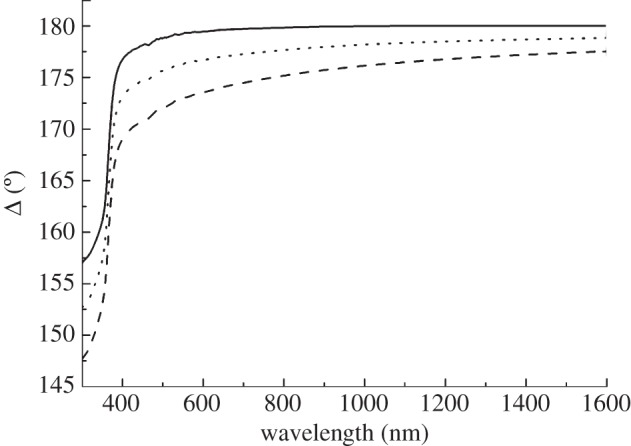
Spectra (Δ) measured on bare silicon (solid line) and on silicon coated with Vmh2P (dashed line) and Vmh2G biofilms (dotted line).
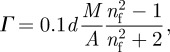
The surface concentration Γ (µg cm−2) of Vmh2P and Vmh2G biofilms self-assembled on silicon can be also calculated from ellipsometric data by using the Cuypers formula [28]:
 |
3.2 |
where A is the molar refractivity (cm3 mol−1), M is the molecular weight, and d and nf are the thickness and the refractive index of the biofilm (determined by SE). The Cuypers formula assumes homogeneity along the stratification direction: in our case, because the thickness of the layer and the size of the rodlet-like aggregates (comments on figure 5 in the following) are well above the micrometre, the formula can be safely used [29]. In table 2, we have reported the parameters used to calculate Γ and the values of Γ. The refractive indexes of pure protein and glucose films have been extrapolated from the curves reported in figure 2a,b at a wavelength of 1000 nm; these values have been used to calculate the refractive index of the Vmh2G biofilm using an EMA layer constituted by 35 per cent of glucose. The molar refractivities of Vmh2P and Vmh2G have been obtained by adding the known values of their constituent atoms [28]. To this aim, we have considered Vmh2G as a molecular complex of 250 units of glucose and one unit of protein, as suggested by results obtained in Armenante et al. [21].
Table 2.
Physical–chemical properties of the two self-assembled biofilms: nf, film refractive index; A, molar refractivity; M, molecular weight; Γ, surface concentration.
| sample | nf (at λ = 1 µm) | A (cm3 mol−1) | M (g mol−1) | M/A (g cm−3) | Γ (µg cm−2) |
|---|---|---|---|---|---|
| Vmh2P | 1.383 | 2104 | 8572 | 4.0746 | 0.0373 ± 0.0006 |
| Vmh2G | 1.393 | 12316 | 53612 | 4.3530 | 0.017 ± 0.001 |
The value of the surface concentration of the Vmh2P biofilm, reported in table 2, is about twice that calculated for Vmh2G, owing to the very different thicknesses estimated for both biofilms. Even if we do not have any information on the molecules disposition in the Vmh2G layer, then these results suggest that in this case, a larger portion of the surface is covered by smaller glucose molecules, which are still engaged in the biofilm formation (i.e. they cannot be washed away); so an average decrease in the determined thickness is observed with respect to the case of Vmh2P.
The higher density of the pure hydrophobin film has also been confirmed by the AFM characterization. In figure 5a,b, we show the AFM images (height, phase and three-dimensional height) of silicon surfaces coated by Vmh2P and Vmh2G biofilms, respectively. The formation of a homogeneous biofilm can be observed in both cases in the three-dimensional-height images. The AFM pictures also reveal the presence of rodlet-like structures on top of the biofilm surfaces. In the case of pure protein, a larger number of longer rodlets can be individuated with respect to the Vmh2–glucose biofilm. The average values of the aggregates height, width and length have been reported in table 3, together with the mean roughness of the biofilms. We note that the presence of rodlets on the layer surface surely contribute to the biofilm thickness, as esteemed by ellipsometry, but the AFM data cannot be directly used to implement those obtained by optical measurements. The spot of the ellipsometer is about 2 mm2; so the thickness of the biofilm is averaged on a surface that is 106 greater than that analysed by AFM. Moreover, owing to the low values of the thicknesses involved, when we tried to include in the optical model a rodlet layer on top of the film, the fitted values became too dependent on initial conditions. Anyway, if we consider a mean thickness weighted by the relative surface occupied by rodlets, which can be estimated by AFM images as 30 per cent for Vmh2P and 10 per cent for Vmh2G, the resulting thicknesses were slightly lower, 3.8 and 1.4 nm, respectively.
Table 3.
Atomic force microscopy analysis for Vmh2P- and Vmh2G-coated silicon.
| biofilm | rodlet average height (nm) | rodlet average width (nm) | rodlet average length (nm) | mean roughness (nm) |
|---|---|---|---|---|
| Vmh2P | 4.11 ± 0.08 | 23.9 ± 0.6 | 64 ± 3 | 3.32 |
| Vmh2G | 3.6 ± 0.2 | 23.8 ± 0.5 | 40 ± 2 | 1.38 |
Changes in surface wettability due to the presence of the biological films self-assembled on silicon have been verified by WCA measurements. The values of the WCA are the average of five determinations on duplicate samples.
The silicon surface, after the removal of the native oxide layer in hydrofluoridric acid, is characterized by a WCA of (90 ± 0.3)° (figure 6a); so it can be defined as hydrophobic. The presence of the Vmh2P biofilm lowers the WCA down to (44 ± 1)° (figure 6b): this interface is more hydrophilic owing to the assembly of the protein into a film with apolar groups disposed towards the hydrophobic silicon on the one side and the polar groups on the other side [30]. When the Vmh2G biofilm is considered, a WCA of (17.5 ± 0.5)° has been measured (figure 6c): the presence of polar sugar groups in the structure of the composite biofilm further increases the wettability of the resulting surface.
Figure 6.
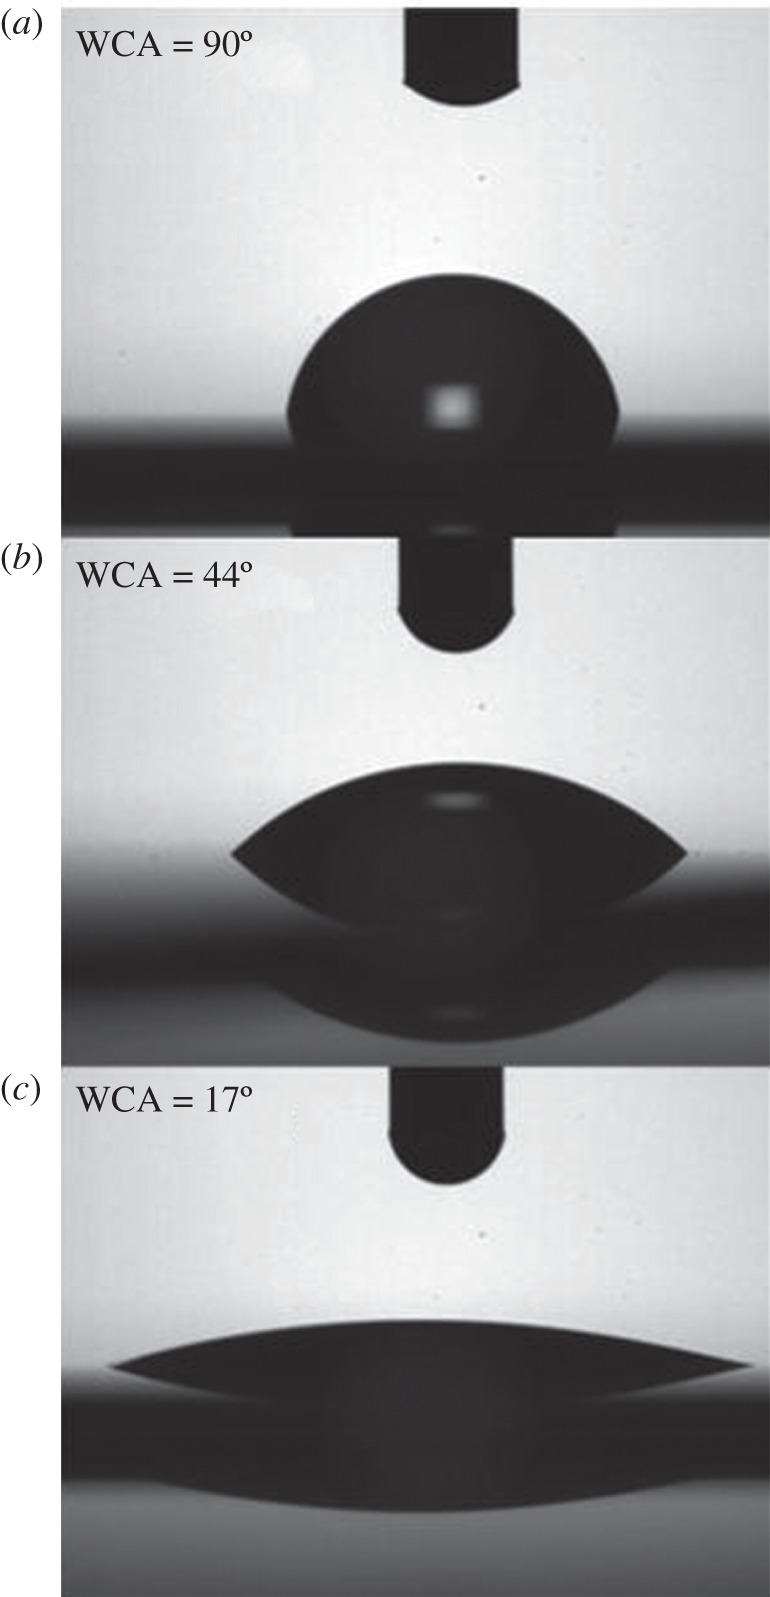
Water contact angle measurements on (a) bare silicon, (b) Vmh2P-coated silicon and (c) Vmh2G-coated silicon.
4. Conclusions
In this work, we have characterized the biofilm of Vmh2–glucose complexes self-assembled on a silicon surface. A chemically stable, nanometric layer of about 1.6 nm is produced by drop deposition of the Vmh2 water solution in the presence of sugar. The glucose molecules, still coordinated with Vmh2 in the self-assembled biofilm, strongly modify the wettability of the hybrid organic–inorganic interface: a decrease of the WCA of about 27° has been measured with respect to the pure protein-coated surface.
This simple method for sugar immobilization can be very useful for several applications, such as bacterial detection systems: invasive strains of the pathogenic bacterium Escherichia coli express a high level of mannose-binding proteins on their pili. Our studies on the stable immobilization of glucose on a silicon chip can be the basis for future biosensors; investigations regarding this issue are currently in progress.
Acknowledgements
The authors thank Dr F. Villani and Dr A. De Girolamo of ENEA—Portici Research Centre for the water contact angle measurements. Thanks are also due to Dr S. Pergolini (2Mstrumenti) for useful discussions on AFM images. This work was partially supported by CNR and MIUR, Italy.
References
- 1.Baskin A., Norde W. 2000. Physical chemistry of biological interfaces. New York, NY: CRC Press, 856 pp [Google Scholar]
- 2.Voros J. 2004. The density and refractive index of adsorbing protein layers. Biophys. J. 87, 553–561 10.1529/biophysj.103.030072 (doi:10.1529/biophysj.103.030072) [DOI] [PMC free article] [PubMed] [Google Scholar]
- 3.Norde W. 2008. My voyage of discovery to proteins in flatland and beyond. Colloid Surf. B Biointerfaces 61, 1–9 10.1016/j.colsurfb.2007.09.029 (doi:10.1016/j.colsurfb.2007.09.029) [DOI] [PubMed] [Google Scholar]
- 4.Wosten H. A. B. 2001. Hydrophobins: multipurpose proteins. Annu. Rev. Microbiol. 55, 625–646 10.1146/annurev.micro.55.1.625 (doi:10.1146/annurev.micro.55.1.625) [DOI] [PubMed] [Google Scholar]
- 5.Wessels J. G. H. 1994. Developmental regulation of fungal cell-wall formation. Annu. Rev. Phytopathol. 32, 413–437 10.1146/annurev.phyto.32.1.413 (doi:10.1146/annurev.phyto.32.1.413) [DOI] [Google Scholar]
- 6.Zampieri F., Wösten H. A. B., Scholtmeijer K. 2010. Creating surface properties using a palette of hydrophobins. Materials 3, 4607–4625 10.3390/ma3094607 (doi:10.3390/ma3094607) [DOI] [PMC free article] [PubMed] [Google Scholar]
- 7.Hektor H., Scholtmeijer K. 2005. Hydrophobins: proteins with potential. Curr. Opin. Biotechnol. 16, 434–439 10.1016/j.copbio.2005.05.004 (doi:10.1016/j.copbio.2005.05.004) [DOI] [PubMed] [Google Scholar]
- 8.Wosten H. B. A., de Vries O. M. H., Wessels J. G. H. 1993. Interfacial self-assembly of a fungal hydrophobin into a hydrophobic rodlet layer. Plant Cell. 5, 1567–1574 10.1105/tpc.5.11.1567 (doi:10.1105/tpc.5.11.1567) [DOI] [PMC free article] [PubMed] [Google Scholar]
- 9.Vries O. M. H., Fekkes M., Wosten H. A. B., Wessels J. G. H. 1993. Insoluble hydrophobin complexes in the walls of Schizophyllum commune and other filamentous fungi. Arch. Microbiol. 159, 330–335 10.1007/BF00290915 (doi:10.1007/BF00290915) [DOI] [Google Scholar]
- 10.Wosten H. A. B., de Vocht M. L. 2000. Hydrophobins, the fungal coat unravelled. Biochim. Biophys. Acta 85524, 1–8 10.1016/S0304-4157(00)00002-2 (doi:10.1016/S0304-4157(00)00002-2) [DOI] [PubMed] [Google Scholar]
- 11.Butko P., Buford J. P., Goodwin J. S., Stroud P. A., McCormick C. L., Cannon G. C. 2001. Spectroscopic evidence for amyloid-like interfacial self-assembly of hydrophobin Sc3. Biochem. Biophys. Res. Commun. 280, 212–215 10.1006/bbrc.2000.4098 (doi:10.1006/bbrc.2000.4098) [DOI] [PubMed] [Google Scholar]
- 12.De Stefano L., Rea I., De Tommasi E., Giardina P., Armenante A., Longobardi S., Giocondo M., Rendina I. 2009. Biological passivation of porous silicon by a self-assembled nanometric biofilm of proteins. J. Nanophotonics 3, 031985. 10.1117/1.3266496 (doi:10.1117/1.3266496) [DOI] [Google Scholar]
- 13.De Stefano L., Rea I., Armenante A., Giardina P., Giocondo M., Rendina I. 2007. Self-assembled biofilm of hydrophobins protects the silicon surface in the KOH wet etch process. Langmuir 23, 7920–7922 10.1021/la701189b (doi:10.1021/la701189b) [DOI] [PubMed] [Google Scholar]
- 14.Scholtmeijer K., Janssen M. I., Gerssen B., de Vocht M. L., van Leeuwen B. M., van Kooten T. G., Wösten H. A. B., Wessels J. G. H. 2002. Surface modifications created by using engineered hydrophobins. Appl. Environ. Microbiol. 68, 1367–1373 10.1128/AEM.68.3.1367-1373.2002 (doi:10.1128/AEM.68.3.1367-1373.2002) [DOI] [PMC free article] [PubMed] [Google Scholar]
- 15.Janssen M. I., van Leeuwen M. B. M., Scholtmeijer K., van Kooten T. G., Dijkhuizen L., Wosten H. A. B. 2002. Coating with genetic engineered hydrophobin promotes growth of fibroblasts on a hydrophobic solid. Biomaterials 23, 4847–4854 10.1016/S0142-9612(02)00240-5 (doi:10.1016/S0142-9612(02)00240-5) [DOI] [PubMed] [Google Scholar]
- 16.Janssen M. T., van-Leeuwen M. B., van-Kooten T. G., de Vries O. M. H., Dijkhuizena L., Wosten H. A. B. 2004. Promotion of fibroblast activity by coating with hydrophobins in the b-sheet end state. Biomaterials 25, 2731–2739 10.1016/j.biomaterials.2003.09.060 (doi:10.1016/j.biomaterials.2003.09.060) [DOI] [PubMed] [Google Scholar]
- 17.Scholtmeijer K., de Vocht M. L., Rink R., Robillard G. T., Wosten H. A. B. 2009. Assembly of the fungal SC3 hydrophobin into functional amyloid fibrils depends on its concentration and is promoted by cell wall polysaccharides. J. Biol. Chem. 284, 26 309–26 314 10.1074/jbc.M109.005553 (doi:10.1074/jbc.M109.005553) [DOI] [PMC free article] [PubMed] [Google Scholar]
- 18.Relini A., et al. 2008. Heparin strongly enhances the formation of beta(2)-microglobulin amyloid fibrils in the presence of type I collagen. J. Biol. Chem. 283, 4912–4920 10.1074/jbc.M702712200 (doi:10.1074/jbc.M702712200) [DOI] [PubMed] [Google Scholar]
- 19.Bellotti V., Chiti F. 2008. Amyloidogenesis in its biological environment: challenging a fundamental issue in protein misfolding diseases. Curr. Opin. Struct. Biol. 18, 771–779 10.1016/j.sbi.2008.10.001 (doi:10.1016/j.sbi.2008.10.001) [DOI] [PubMed] [Google Scholar]
- 20.Gorityala B. K., Ma J., Wang X., Chen P., Liu X.-W. 2010. Carbohydrate functionalized carbon nanotubes and their applications. Chem. Soc. Rev. 39, 2925–2934 10.1039/b919525b (doi:10.1039/b919525b) [DOI] [PubMed] [Google Scholar]
- 21.Armenante A., Longobardi S., Rea I., De Stefano L., Giocondo M., Silipo A., Molinaro A., Giardina P. 2010. The Pleurotus ostreatus hydrophobin Vmh2 and its interaction with glucans. Glycobiology 20, 594–602 10.1093/glycob/cwq009 (doi:10.1093/glycob/cwq009) [DOI] [PubMed] [Google Scholar]
- 22.De Stefano L., Rea I., Giardina P., Armenante A., Rendina I. 2008. Protein-modified porous silicon nanostructures. Adv. Mat. 20, 1529–1533 10.1002/adma.200702454 (doi:10.1002/adma.200702454) [DOI] [Google Scholar]
- 23.De Stefano L., Rea I., Longobardi S., Giocondo M., Giardina P. 2011. Organic–inorganic interfaces for a new generation of hybrid biosensors. In Biosensors: emerging materials and applications (ed. Serra P. A.), pp. 311–332, Vukovar, Croatia: InTech [Google Scholar]
- 24.Kern W. 1993. Handbook of semiconductor wafer cleaning technology: science, technology, and applications. Norwich, NY: William Andrew Publishing/Noyes [Google Scholar]
- 25.Horiba Jobin Yvon Delta Psi Software manual, ver. 2.4.3 158.
- 26.Cauchy L. 1830. Sur la dispersion de la lumiere. Bull. des Sc. Math. 14, 9 [Google Scholar]
- 27.Aspnes D., Theeten J. 1979. Investigation of effective medium models of microscopic surface roughness by spectroscopic ellipsometry. Phys. Rev. B 20, 3292–3302 10.1103/PhysRevB.20.3292 (doi:10.1103/PhysRevB.20.3292) [DOI] [Google Scholar]
- 28.Cuypers P., Corsel J., Janseen M., Kop J., Hermens W., Hemker H. 1983. The adsorption of prothrombin to phosphatidylserine multilayers quantitated by ellipsometry. J. Biol. Chem. 258, 2426–2431 [PubMed] [Google Scholar]
- 29.Engstrom S., Backstrom K. 1987. Ellipsometry as a tool to study detergency at hard surfaces. Langmuir 3, 568–574 10.1021/la00076a023 (doi:10.1021/la00076a023) [DOI] [Google Scholar]
- 30.Wosten H. A. B., Schuren F., Wessels J. G. H. 1994. Interfacial self-assembly of a hydrophobin into an amphipathic protein membrane mediates fungal attachment to hydrophobic surfaces. EMBO J. 13, 5848–5854 [DOI] [PMC free article] [PubMed] [Google Scholar]