

Abstract
Creating images of the transit delay from the labeling location to image tissue can aid the optimization and quantification of arterial spin labeling (ASL) perfusion measurements and may provide diagnostic information independent of perfusion. Unfortunately, measuring transit delay requires acquiring a series of images with different labeling timing that adds to the time cost and increases the noise of the ASL study. Here we implement and evaluate a proposed Hadamard encoding of labeling that speeds the imaging and improves the signal-to-noise ratio (SNR) efficiency. Volumetric images in human volunteers confirmed the theoretical advantages of Hadamard encoding over sequential acquisition of images with multiple labeling timing. Perfusion images calculated from Hadamard encoded acquisition had reduced SNR relative to a dedicated perfusion acquisition with either assumed or separately measured transit delays, however.
INTRODUCTION
Arterial spin labeling (ASL) is a completely noninvasive magnetic resonance imaging (MRI) technique capable of quantifying regional perfusion [1–3]. ASL has been adopted to study a broad range of clinical diseases (see reviews [4, 5]). However, quantitative ASL perfusion measurement is not yet widely adopted for clinical research and diagnosis, in part due to the technical challenge posed by the uncertainty in the time that the labeled blood takes to travel through the arteries from the labeling location to the tissue of interest in clinical patients [6–8]. This arterial transit delay, ATD, may cause perfusion to be underestimated or overestimated depending on its length relative to the labeling timing. Though a number of investigators have proposed methods to minimize ATD errors by the choice of labeling parameters [9–12]. These approaches use a single labeling timing designed to produce perfusion measures that are relatively insensitive to ATD within a specified range. With continuous ASL (CASL), the ATD is controlled by the choice of post-labeling delay. Due to its popularity, the single post-labeling delay CASL approach is referred to as standard CASL throughout this work. The standard CASL approach can perform poorly if the ATD falls outside of the designed range and will have reduced signal-to-noise ratio if the range is selected too broadly. Hence the success of the method relies on the accuracy with which the ATD can be anticipated. Directly measuring the ATD could help improve perfusion measurement and might provide an additional measure with diagnostic significance, especially for vascular disease.
Current ATD measurement techniques typically require ASL measurements with multiple different labeling timings, but these can be very time consuming and tend to have low signal-to-noise ratio (SNR) [12–16]. Researchers have investigated several time-efficient ATD measurements, such as Look-Locker techniques that acquire a series of images after a single labeling preparation [17, 18]. The Look-Locker method has advantages for speed of acquisition, but because reduced flip angles must be used for each image, the SNR per square root time is comparable to sequential acquisitions. The saturation effects of the multiple RF pulses also add to the complexity of quantification. Also, a pseudo-random modulation approach to CASL delay encoding has been reported that is conceptually similar to Hadamard encoding [19]. This modulation was evaluated in a quasi steady-state gradient acquisition without comparison to Hadamard or other methods. Hadamard encoding of continuous ASL (CASL) was recently proposed as an approach to increasing the SNR and time efficiency of multiple labeling timing acquisitions [20]. The potential of this method was demonstrated in a small animal study using a single-slice CASL technique [21]. Volumetric acquisitions in humans, where ATD’s tend to be longer and more problematic, have not yet been rigorously studied, however.
Hadamard encoding of a full resolution acquisition may not be an optimal approach. In a recent publication [22], we argued that ATD tends to be intrinsically low resolution because most of the ATD involves transit time through larger vessels that supply extending regions. Performing a quick ATD at low resolution may be sufficient to accurately measure ATD and this estimate can then be used to quantify perfusion from a higher resolution ASL acquisition acquired with a single labeling timing. Our preliminary results have demonstrated that this strategy of Perfusion Imaging with a Low-resolution Transit Scan (PILOTS) can characterize the arterial transit delay accurately and can significantly reduce errors of the perfusion measurement [22]. Using Hadamard encoding for the low resolution ATD acquisition of PILOTS may be a more optimal approach to perfusion and ATD measurements.
The aims of the study are therefore: (1) to show the feasibility of the Hadamard encoded technique for ATD and perfusion measurements of humans, (2) to compare the SNR per unit time of transit time and perfusion measurements acquired with Hadamard encoding to those acquired with sequential delay acquisitions and (3) to compare the SNR per unit time of perfusion measurements acquired with multiple delay acquisitions using Hadamard encoding to those acquired with single delay, standard CASL.
THEORY
Multiple-delay Sequential vs. Hadamard encoded CASL scheme
The measurement of ATD typically requires sampling ASL signals at multiple post-labeling delays (e.g. N=7). The multiple-delay ASL signals are normally acquired in a sequential manner, i.e. label and control images at one delay after another. For the Hadamard encoded scheme, a long ASL preparation period is divided into N small time blocks that are separately Hadamard encoded with an (N+1) element Hadamard matrix as in Wells et al. (Figure 1 in [20, 21]). Positive coefficients in the Hadamard encoding matrix correspond to control while negative coefficients corresponded to labeling. Each image from the Hadamard encoded acquisition is a mixture of label and control signals from all the small time blocks. The ASL signal at each delay can be separated by linear combination of the (N+1) Hadamard encoded images, with the coefficient of each image being either 2/(N+1) or −2/(N+1). This can be written in mathematical formula:
| [1] |
where Ci and Li are control and label signal from the ith delay, Hj is the jth Hadamard encoded image. aj is either 2/(N+1) or −2/(N+1).
The noise propagation of multiple-delay ASL signals between the sequential CASL and Hadamard encoded CASL is different. Assuming acquisition noise from each CASL image acquisition is normally distributed with zero mean and standard deviation σ, the theoretical error of the CASL signal at each delay for the sequential CASL and Hadamard CASL with the same labeling block can be given by Eq. [2] and [3] respectively:
| [2] |
| [3] |
where i = 1,…,N; the subscript SE-CASL stands for sequential CASL and H-CASL for Hadamard encoded CASL. In addition, the time cost for N-delay CASL images is also different: sequential CASL requires 2N image acquisitions, while Hadamard CASL requires only (N+1) image acquisitions. In summary, theory predicts that N-delay Hadamard CASL scheme uses roughly half ( exactly (N+1)/2N ) of the imaging time of the sequential CASL but achieves times smaller noise than the sequential scheme.
Quantification of Perfusion
In the absence of strong magnetization transfer effects from the CASL labeling, the relationship between the CASL signal in tissue and flow is given by [9, 23, 24]:
| [4] |
where ΔM is the ASL difference signal, f is the perfusion rate, and T1a and T1t are the longitudinal relaxation times of blood and tissue, with the values assumed to be 1.66 s [25] and 1.5 s [26, 27] respectively. is the fully relaxed equilibrium magnetization of brain tissue, α is the efficiency of the labeling sequence with the value assumed to be 0.8 [28], λ is the tissue-to-blood partition coefficient of water, with the value assumed to be 0.9 ml /g [29], δ is the transit delay, τ is the labeling duration and w is the post-labeling delay.
MATERIALS AND METHODS
In vivo Measurements
Six volunteers (four females and two males, 23–37 years old 32.3 ± 5.2) were imaged on a 3 Tesla EXCITE HDxt scanner (GE Healthcare, Waukesha WI) using an 8 channel head coil receive array and the body transmit coil for transmission, following a protocol approved by the institutional committee on clinical investigations and after obtaining written informed consent. Each subject was scanned following an identical protocol.
The scan began with a 3-plane localizer to define the anatomy of interest. Based on this localizer, a 3D volume from the location between the base of the cerebellum and the fourth ventricle to the location above the top of the head was prescribed for the rest of the study. The labeling plane was automatically placed 18mm below this volume by the pulse sequence software.
Next a series of volumetric perfusion images were acquired all with the same labeling plane and background suppression. The following sequences were performed in order:
High resolution Hadamard images- 1 average, 7 min 25 s
High resolution sequential images –1 average, 12 min 58 s
High resolution long labeling image –3 averages, 5 min 34 s
High resolution reference images (2 images) - 1 average, 1 min 51 s
Low resolution Hadamard images- 1 average, 56 s
Low resolution sequential image– 1 average, 1 min 38 s
After completing these sequences once, they were all repeated (except for the long scan 2) to assess repeatability. The high-resolution sequential acquisition was not repeated because of its long duration and clearly inferior SNR on preliminary studies.
Pulse Sequences
ASL Preparation
Pulsed-continuous arterial spin labeling (pCASL) was used for all labeling [28]. This technique used repeated RF and gradient pulses to achieve effectively continuous labeling but with a lower RF duty cycle compatible with the pulsed RF amplifiers used on most human scanners. In this study, an average RF amplitude of 17 mG, an average gradient of 0.1 G/cm, and a ratio of gradient during the RF to average gradient of 9 were used. A repetition time for the labeling RF of 1.156 ms was used. Selection of labeling or control is performed by changing only the phase increment between RF pulses and the amplitude of the refocusing gradient, so switching between label and control (as required for Hadamard encoding) can be performed within one labeling repetition time of 1.156 ms. However, because moving arterial spins experience multiple RF pulses while passing through the labeling region, a longer transient in labeling may occur if switched.
Background suppression was used to reduce motion related errors from static tissue [30]. Background suppression was optimized as previously described [31] with saturation applied at 5000 ms before imaging and inversion pulses at 3566 ms, 1733 ms during labeling and 662 ms and 150 ms after labeling. Suppression of signal was achieved by first selectively saturating the imaging region. The saturation pulses begin the background suppression series of pulses. Four quadratic phase saturation pulses [11] were played with the last centered at 5000 ms prior to imaging (pulses were 10 ms in duration, 12.5 kHz in bandwidth, and played 17 ms apart). Crusher-gradient pulses of incrementally increasing magnitude between the RF pulses were used to prevent refocusing of transverse magnetization. Selective “C-shape” frequency offset corrected inversion (FOCI) pulses with reduced radiofrequency power deposition [32], with durations 15.36 ms and bandwidth 1.08 kHz (β=809s−1 and μ=2.5) were used for the 2 inversion pulses during labeling. After labeling, two nonselective adiabatic hyperbolic-secant inversion pulses [33] of 10 ms duration and 1.4 kHz bandwidth (β=970s−1 and μ=4.5) were applied.
pCASL was performed from 4900 to 700 ms before imaging, except for small 15.86 ms gap for each of two background suppression pulses. For the Hadamard encoded scheme, this 4200 ms pCASL preparation period was divided into seven 600ms blocks. For comparison to Hadamard CASL, sequential CASL was used to acquire images with a 600 ms labeling duration and seven post-labeling delays to match the blocks of the Hadamard CASL: 700, 1300, 1900, 2500, 3100, 3700, and 4300 ms. Pairs of label and control images were acquired with the RF and gradients turned off during times when labeling was not desired. A long labeling acquisition with labeling or control for the entire 4200 ms preparation period was also acquired. This long-labeling acquisition was used to evaluate the relative sensitivity of Hadamard encoded and single delay standard CASL as described below.
Reference Images
To support phasing and quantification of the ASL perfusion images, two references images were acquired with different preparation. A preparation with saturation applied at 2 s was used to create an approximately proton density weighted image. A preparation with saturation at 4.3 s and an adiabatic inversion pulse at 1.65 s was used to create a T1 sensitive image.
Interleaved Hadamard encoded CASL and background suppression
Background suppression was used to reduce motion related errors from the otherwise strong signal from static tissue [30]. Because Hadamard encoding requires a long labeling duration and flexible timing, we chose to perform the background suppression interleaved with the labeling [22, 34]. This requires the use of selective inversion pulses for background suppression and switching from labeling to control or vice versa after each inversion. In this study, optimal background suppression [31] yielded two inversion pulses during the labeling period of the Hadamard encoded scheme and therefore these two inversion pulses were interleaved with the labeling duration. As required for interleaved background suppression and labeling [22, 34], the sign of all Hadamard encoding between the two inversion pulses applied during labeling were reversed (Fig. 1).
Fig. 1.

Schematic of the Hadamard encoded CASL with two interleaved background suppression pulses (shown as dashed vertical lines). (a) long labeling CASL control sequence, and (b) label sequence at single post-labeling delay (0.7 s) with interleaved background suppression pulses; (c) Eighth Hadamard encoding without interleaved background suppression and (d) with interleaved background suppression for the seven-delay Hadamard encoded method.
Imaging Sequence
All perfusion and reference images were acquired with a 3D stack of spirals RARE imaging sequence. Spiral encoding was performed in the axial plane using gradient waveforms generated by an automatic algorithm [35]. The spiral gradient waveform was constrained to 4 ms duration and the resolution was determined by the number of spiral interleaves selected. Two different resolutions were employed for this study. An 8 interleave sequence, which produced an estimated spatial resolution of 3.07 mm, is referred to as “high resolution” throughout this work. A single interleave sequence, which produced an estimated in-plane spatial resolution of 12.08 mm, is referred to as “low resolution”. Each preparation sequence was followed by a vessel suppression sequence, and then by an imaging sequence. The imaging sequence was a 90° excitation pulse and then a series of 44 spin echoes encoded with the same spiral gradient but different slice encoding phase encode gradients. 44 slices of nominally 4 mm thickness were encoded with a centric phase encode order. The echo spacing was 9.8 ms and the refocusing flip angle was 130° with the first refocusing pulse set to 155° to speed the transition to a steady-state echo amplitude. The total repetition time of the ASL preparation and imaging combination was 6.95 s. A vessel suppression sequence was applied to eliminate the labeled blood in vessels (with velocity cutoff as 1 cm/s) for all the sequences in the study [36].
Image Reconstruction
All image data were saved as raw echo intensities and reconstructed offline with custom software. The data were first Fourier transformed into forty-four 4-mm thick slices. Each slice was reconstructed by weighted regridding to a 128 × 128 matrix and Fourier transformation into complex valued images for each of the 8 array coils. Hadamard encoded acquisitions were Hadamard transformed to create individual images for different labeling time blocks. To improve SNR and minimize rectification of noise, a phased combination of different coils was performed, rather than simple root mean square combination. Phase maps from individual ASL images may not be reliable because of low SNR, so instead a phase map was obtained from the proton density (PD) weighted reference image. To increase robustness of the phase maps, 3D smoothing was applied to the PD images with a cubic filter. A 5-pixel wide filter was used for phase maps to phase higher resolution images and an 11 pixel wide filter was used for phase maps to phase low-resolution images. Phasing was performed using equation 3 of Bydder et al. [37] with the smoothed PD signal used for the coil weights.
Image Analysis
All image analysis and simulations were performed using MATLAB (The MathWorks, Inc., Natick, MA). Both the fitting to a perfusion kinetic model (Eq. [4]) and the fitting of a normal distribution to the histograms were performed using the nonlinear least-square curve fitting function “lsqcurvefit”.
Regional analysis of signal and signal-to-noise ratio
Regions of interest (ROIs), were manually drawn on a single slice of the volume (at the top of the third ventricle). Regions were drawn on the proton density weighted reference image for each subject and were applied to the perfusion sensitive images assuming no motion between acquisitions. Two ROI’s were drawn. One contained the entire brain within the slice and one was drawn outside of the brain containing only noise. Based on the ROIs, the CASL difference signal (from brain ROI) and standard deviation of the noise (from the non-brain ROI) were calculated for the high-resolution Hadamard encoded and sequential perfusion sensitive images. Though accuracy of noise determination using signal free regions can be problematic with array coil acquisitions, this estimate of noise should still be useful for relative SNR assessment between different CASL acquisition techniques. Both signals and noises at each delay were compared between the Hadamard encoded method and the sequential CASL acquisition method using paired t-tests. The sum image over all seven delays of the Hadamard encoded acquisitions has the same effective labeling duration, 4.2 s, as the long labeling acquisition. Therefore, the signals from the sum image were compared with those from the long labeling acquisition using paired t-tests.
Calculation of the ATD and Perfusion Maps
For high-resolution and low-resolution Hadamard encoded acquisitions, the ATD map (δ) and perfusion map (f) were calculated by fitting the seven-delay ASL difference signals as a function of the post-labeling delay (w) to Eq. [4].
Systematic error and SNR of the standard CASL method
The single long-labeling acquisition combined with the low resolution Hadamard transit time map was used to estimate the sensitivity and systematic error of standard CASL acquisitions with different post-labeling delays. This approach was used both because the time required for acquiring scans with multiple post-labeling delays would be prohibitively long and because standard CASL at a single post-labeling delay will have systematic errors depending on transit time that must be evaluated for a fair comparison. Instead, we used the knowledge of the ATD map from the low resolution Hadamard acquisition to infer the degree to which the signal from the long-labeling, 700 ms delay acquisition would have been reduced had longer post-labeling delays of 1.2 s, 1.5 s and 1.8 s been selected. Then perfusion for each inferred post-labeling delay was quantified using Eq. [4], assuming a fixed ATD equal to the post-labeling delay. Perfusion quantified with this standard CASL method has systematic error due to the ATD assumption. To evaluate this error, we compared the perfusion error relative to the quantification of the full long-labeling signal with the low resolution ATD map (the PILOTS method). The error in perfusion using standard CASL was calculated as the relative error to the perfusion quantified with the PILOTS method.
The SNR ratio of perfusion quantified using the standard CASL method at each single delay to that quantified using high-resolution Hadamard encoded method was calculated as follows.
| [5] |
where the subscript S-CASL stands for standard CASL; τS, wS, τLL and wLL are labeling duration and post-labeling delay for the inferred standard CASL and the long labeling acquisition respectively. The ratio of the SNR of standard CASL to the PILOTS method is given by the ratio of perfusion difference signal since the same noise would be present for the two methods. The ratio of the SNR of the PILOTS method to the Hadamard CASL was estimated from the reciprocal ratio of noise since the same perfusion signals were expected for the two methods. The noise of each method was calculated from the reproducibility of the perfusion measurement between two repeated acquisitions, shown below.
Calculation of reproducibility
Reproducibility of ATD and perfusion maps were calculated from the repeated scans (X1 and X2) of each approach and quantified by the fractional change (X1–X2)/ X1. The histogram of the fractional change (300 bins equally spaced from −1 to 1) was plotted to visualize its distribution throughout the slice used for the ROIs. Standard deviation (σ) was then calculated by fitting the histogram to a normal distribution curve. The standard deviation was used as an estimate of the variability of the measure (ATD or perfusion) for the high-resolution Hadamard method and PILOTS method.
Simulations
The propagation of noise through different labeling encoding strategies and nonlinear fitting is complicated, so we elected to perform simulations with Gaussian noise to determine if our experimental results were consistent with theoretical predictions of the relative SNR of different ATD and perfusion measurement methods.
Simulations were performed for identical labeling parameters and encoding strategies as used in the in-vivo study. T1t and T1b were assumed fixed at the same values assumed for the in-vivo quantification. A range of ATDs from 0.7 s to 3 s in step of 0.3 s was considered. Noise was assumed to be Gaussian distributed and a range of noise standard deviation levels was considered. Noise propagation was determined by Monte Carlo simulation, i.e. random noise values were added to the models repeatedly to determine the mean and standard deviation of the resulting perfusion and transit time “measurements” obtained by fitting. For each ATD in the range of transit delays, the process was repeated 500 times and at each time ATD δ and f were estimated (δi and fi, i = 1,…, 500) by fitting the simulated data to the kinetic model described in Eq. [4]. The standard deviation of estimated perfusion and ATD were calculated for each theoretical ATD. The root mean square standard deviation of perfusion and transit time across all theoretical ATDs were calculated to serve as average deviation for the approach.
For simulation of the standard CASL and PILOTS methods, noise contributions from both the low-resolution ATD determination and the high-resolution, long-labeling acquisition had to be considered. These required assumptions about how resolution and acquisition time affect signal-to-noise ratio. We made the standard assumptions that noise decreases as the square root of the averaging time and that signal is proportional to voxel volume. Since the volume of the low-resolution scan voxels was approximately 16 times higher than the high-resolution voxels and the acquisition time was 8 times faster, the relative SNR for one average was assumed to be 5.7 times higher for the low resolution scans. The noise of the high-resolution long-labeling acquisition was assumed to be times lower than high-resolution acquisition with a single average due to three averages used. In the simulation, noise standard deviation levels were expressed as a ratio to the noise in the long labeling acquisitions of in vivo data, which corresponds to SNR of 13 for the single average in the long labeling acquisitions.
RESULTS
Performance of the Hadamard Encoded Method in Human Subjects
Both high and low resolution Hadamard encoded acquisitions were of excellent quality and were nearly identical in signal to sequential acquisitions. Representative high-resolution images from Hadamard encoded acquisitions are compared to the sequentially acquired images at seven delays, in Fig. 2. The quantitative whole slice average signals, noise determined from the standard deviation in the ROI outside the brain and signal-to-noise ratios (SNRs) between the two acquisition methods are listed in Table 1. No statistically different signals (P > 0.01) were found for all seven delays between the two acquisition methods. Noise in the Hadamard encoding method was significantly smaller than in the sequential imaging method (P < 0.0001 for all delays) using paired t tests across subjects. The noise ratio between sequential and Hadamard encoded acquisition across all delays was 1.97 ± 0.07, which is consistent with the theoretical value of 2.
Fig. 2.
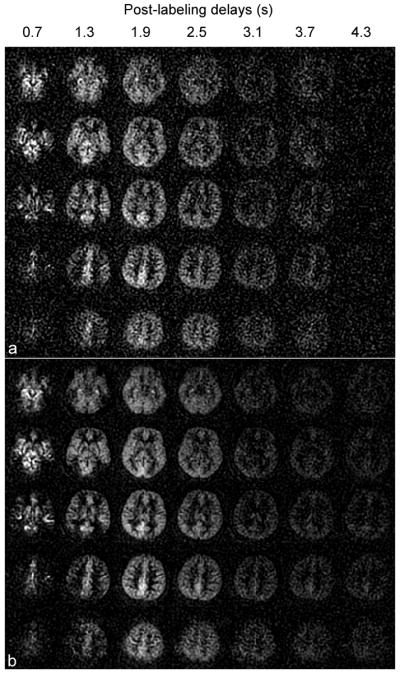
Perfusion difference images derived from multiple-delay (a) sequential CASL method and (b) Hadamard encoded CASL method at seven post-labeling delays with label duration of 0.6 s. The seven post-labeling delays were 0.7, 1.3, 1.9, 2.5, 3.1, 3.7, 4.3 s from left to right in both (a) and (b). The Hadamard encoded ASL method reduces the background noise to half compared to the multiple-delay sequential ASL method, as predicted by theory.
Table 1.
Whole-slice averaged signals, noises, and SNRs of perfusion difference images at seven delays using different acquisition methods
| Method | Delay1 | Delay 2 | Delay 3 | Delay 4 | Delay 5 | Delay 6 | Delay 7 | |
|---|---|---|---|---|---|---|---|---|
| Hadamard | Signal | *20.29±5.18 | 22.00±2.26 | 21.67±2.39 | 14.22±1.54 | 6.99±1.00 | 5.47±1.24 | 4.82±0.98 |
| Noise | 3.25±0.19 | 3.36±0.25 | 3.43±0.36 | 3.57±0.42 | 3.51±0.31 | 3.38±0.34 | 3.31±0.31 | |
| SNR | 6.22±1.46 | 6.58±0.83 | 6.41±1.19 | 4.02±0.61 | 2.00±0.31 | 1.64±0.41 | 1.46±0.24 | |
| Sequential | Signal | 18.57±5.77 | 22.98±2.30 | 23.17±2.24 | 16.06±2.59 | 7.72±1.11 | 5.95±2.94 | 2.57±2.21 |
| Noise | 6.76±0.65 | 6.70±0.59 | 6.88±0.73 | 6.63±0.34 | 6.69±0.52 | 6.87±0.61 | 6.44±0.40 | |
| SNR | 2.78±0.97 | 3.47±0.56 | 3.38±0.20 | 2.43±0.40 | 1.16±0.20 | 0.86±0.38 | 0.40±0.33 |
Values are mean ± standard deviation across subjects.
The sum image over all seven delays of the high-resolution Hadamard encoded acquisitions was compared with the long labeling acquisition (Fig. 3) due to the same effective labeling duration. The quantitative signals across all subjects for the two acquisition methods were 95.5±10.8 vs. 101.1±11.2 for the first acquisition, and 89.8±7.6 vs. 89.8±10.6 for the second acquisition of either sequence. No statistically different signals (P > 0.01) were found between the sum of all delays from high-resolution Hadamard encoded acquisition and the long labeling acquisition using paired t tests. This indicates that any signal loss caused by the switch between control and label phase in the Hadamard method is negligible.
Fig. 3.

The perfusion difference images derived from (a) sum of seven-delay Hadamard encoded ASL acquisitions and (2) long labeling ASL acquisitions at a single labeling timing: label duration of 4.2 s and post-labeling delay of 0.7 s. The long labeling ASL signals (which used 3 label-control pairs and therefore required only ¾ of the Hadamard acquisition time) show reduced noise compared to the sum of Hadamard encoded signals.
Reproducibility of Perfusion and ATD Measurements
Representative perfusion maps from the high-resolution Hadamard encoded method are compared to the perfusion maps from standard CASL acquisitions and the PILOTS method in Fig. 4. The distributions of fractional changes of perfusion maps between two repeated scans from the high-resolution Hadamard encoded method showed larger perfusion variation than from the inferred standard CASL acquisitions and the PILOTS method. Table 2 confirms that the reproducibility of the perfusion measurement from the PILOTS method is superior to the high-resolution Hadamard method. The reproducibility of the perfusion quantified from the PILOTS method with low-resolution Hadamard encoding was 1.78 times better than the reproducibility of the perfusion quantified from the high-resolution Hadamard acquisitions. More reproducible perfusion measurements are expected from the PILOTS method with low-resolution Hadamard encoding due to the higher SNR compared to the high-resolution Hadamard encoded method (see simulation results). Table 2 also shows that the ATD measurement from the low-resolution Hadamard encoded method is more reproducible than from the high-resolution Hadamard encoded method. This is expected due to the increased SNR from the low-resolution acquisitions of the PILOTS method.
Fig. 4.

The perfusion maps generated from two repeated scans (the first two columns), the difference map between the two scans (the third column) and the distributions for the fractional change of perfusion between the two scans (the fourth column) using (a) Hadamard encoded method, (b) standard CASL with 1.5 s post-labeling delay (inferred from the long-labeling acquisition and an ATD map), and (c) PILOTS method. The fractional change of perfusion between two repeated scans using the standard method and PILOTS method has a narrower distribution than the fractional change of perfusion using the high-resolution Hadamard method, which indicates that the perfusion measurement using the standard and PILOTS method is more reproducible than that using the Hadamard encoded method.
Table 2.
Standard deviations of fractional change between two repeated scans for ATD and perfusion images.
| Standard deviation | ATD from * low-Had | ATD from high-Had | Perfusion from high-Had | Perfusion from PILOTS |
|---|---|---|---|---|
| Average | 0.07 ± 0.03 | 0.14 ± 0.03 | 0.28 ± 0.06 | 0.16 ± 0.06 |
low-Had and high-Had stand for low-resolution Hadamard method and high-resolution Hadamard method respectively.
Systematic error and SNR of the standard CASL method
Maps of inferred systematic error and SNR ratio for standard CASL at three different post-labeling delays compared to the Hadamard method are shown in Fig. 5. The closer the post-labeling delay is to the ATD, the less systematic error in the perfusion measurement using standard CASL (Fig. 5a–c). Since the brain has a distribution of ATD’s, the systematic error in standard CASL is minimized by choosing the post-labeling delay to be the longest ATD value. However, with increased post-labeling delay, the relative SNR ratio of perfusion measurement between standard CASL and Hadamard CASL decreased exponentially (Fig. 5d–f).
Fig. 5.

Systematic errors of perfusion measurement inferred for standard CASL with a single post-labeling delay at (a) 1.2 s, (b) 1.5 s, and (c) 1.8 s; and SNR ratio of perfusion measurement inferred for standard CASL with a single post-labeling delay at (d) 1.2 s, (e) 1.5 s, and (f) 1.8 s relative to perfusion measurement using Hadamard CASL method.
Simulated Noise propagation for ATD and Perfusion measurements
Average deviations (across the range of transit delay) of ATD and perfusion from the simulations are plotted as a function of noise level for the high-resolution Hadamard encoded method and PILOTS method with low-resolution Hadamard encoding (Fig. 6). The deviations of ATD and perfusion are linearly dependent on the noise level. Simulation shows smaller variation of ATD and perfusion (i.e. higher reproducibility) in the PILOTS method with low-resolution Hadamard encoding compared to the high-resolution Hadamard encoded method, which is consistent with in vivo observations. Simulation also shows that the reproducibility of ATD is higher than that of perfusion for both multi-delay acquisition methods, which also supports our in vivo results.
Fig. 6.

Simulated average deviations of ATD and perfusion measurements using the high-resolution Hadamard method and PILOTS method as a function of noise ratio (relative to the noise in the long labeling image acquisitions with a single average). The noises of the ATD and perfusion measurements increase linearly with the noise from the image acquisitions. The noises of the ATD and perfusion measurements using the PILOTS method are much lower than those using the high-resolution Hadamard method.
DISCUSSION
We have shown the feasibility of the Hadamard encoded CASL method for volumetric ATD and perfusion measurements of humans. The Hadamard encoded method has demonstrated: (1) identical signals compared to those acquired using sequential acquisition, (2) the same sum of signal across delays as a single, long-labeling acquisition. (3) 2 times the SNR using only 4/7 of imaging time compared to the sequential method with 7 post-labeling delays.
The Hadamard encoded method produces an ATD measurement with better fractional reproducibility than the perfusion measurement, which suggests that the Hadamard encoded method is more suitable for ATD measurement than perfusion measurement. The results are consistent with previous single slice data in the mouse, despite the totally different ATD range in mice compared to humans.
The Hadamard capability demonstrated in this study increases the practicality of measuring perfusion and transit delay simultaneously in many applications. Hadamard encoding reduces the time and noise penalty for multi-delay imaging. Hadamard still has a lower SNR for perfusion than standard single delay CASL if the single post-labeling delay is well chosen. However, there clearly exists a trade-off between systematic error and SNR using the standard CASL vs. Hadamard CASL method. Standard CASL at a post-labeling delay close to the longest ATD value (Fig. 5e–f) showed inferior SNR (blue color) compared to the Hadamard method in a large portion of the image. In a clinical population for which the range of ATD values is not known, the Hadamard method is likely to be even more preferable than standard CASL with a single post-labeling delay. Since Hadamard encoding can eliminate transit time related systematic errors, it has great appeal for clinical applications.
Hadamard encoding proved optimal for both low and high-resolution ATD mapping. The greater reproducibility of the low resolution ATD maps and the higher SNR of the PILOTS perfusion maps suggest that high resolution Hadamard is not desirable unless there are high-resolution features in the ATD maps. Whether the high resolution ATD map is necessary is an issue for further study in specific populations and applications. Even if only low-resolution transit maps are employed, the use of Hadamard to acquire the maps, as compared to the sequential methods employed in our earlier report on the PILOTS method, increases the speed and reproducibility of the ATD maps.
Hadamard encoding provides considerable flexibility for optimizing labeling block timing. Though only equal duration blocks were considered here, encoding different durations is straightforward and may have advantages. Longer blocks at longer delays may help to compensate SNR loss for slow arriving spins. The start or end of labeling blocks may also be chosen to align with background suppression pulses, since both inversion pulses and changes in the labeling may introduce a discontinuity in encoding that may reduce efficiency.
The advantages of Hadamard CASL for transit mapping add to the advantages of continuous relative to pulsed labeling. While Hadamard encoding of sections of the labeling slab with pulsed labeling may be possible, the imperfect match between anatomical position and transit delay may limit such an approach. Comparison of Hadamard CASL with multi-delay pulsed ASL methods to provide quantitative values for the relative SNR is certainly a topic that should be pursued in future work.
In summary, our results demonstrate the feasibility of Hadamard encoded CASL for measurement of ATD and the SNR and speed advantages of Hadamard relative to other ATD imaging techniques. Hadamard encoded CASL, either as a high-resolution technique for simultaneous perfusion and ATD measurement or as a low resolution prescan to estimate ATD, is a compelling approach to address ATD concerns in broad clinical populations.
Acknowledgments
This work was supported in part by grants CA115745, MH80729, and T32AG023480 from the National Institutes of Health.
References
- 1.Detre JA, Zhang W, Roberts DA, Silva AC, Williams DS, Grandis DJ, Koretsky AP, Leigh JS. Tissue specific perfusion imaging using arterial spin labeling. NMR Biomed. 1994;7(1–2):75–82. doi: 10.1002/nbm.1940070112. [DOI] [PubMed] [Google Scholar]
- 2.Detre JA, Leigh JS, Williams DS, Koretsky AP. Perfusion imaging. Magn Reson Med. 1992;23:37–45. doi: 10.1002/mrm.1910230106. [DOI] [PubMed] [Google Scholar]
- 3.Williams DS, Detre JA, Leigh JS, Koretsky AP. Magnetic reonance imaging of perfusion using spin inversion of arterial water. PNAS USA. 1992;89:212–216. doi: 10.1073/pnas.89.1.212. [DOI] [PMC free article] [PubMed] [Google Scholar]
- 4.Detre JA, Alsop DC. Perfusion magnetic resonance imaging with continuous arterial spin labeling: methods and clinical applications in the central nervous system. Eur J Radiol. 1999;30(2):115–24. doi: 10.1016/s0720-048x(99)00050-9. [DOI] [PubMed] [Google Scholar]
- 5.Brown GG, Clark C, Liu TT. Measurement of cerebral perfusion with arterial spin labeling: Part 2. Applications. Journal of the International Neuropsychological Society : JINS. 2007;13(3):526–38. doi: 10.1017/S1355617707070634. [DOI] [PMC free article] [PubMed] [Google Scholar]
- 6.Detre JA, Alsop DC, Vives LR, Maccotta L, Teener JW, Raps EC. Noninvasive MRI evaluation of cerebral blood flow in cerebrovascular disease. Neurology. 1998;50(3):633–41. doi: 10.1212/wnl.50.3.633. [DOI] [PubMed] [Google Scholar]
- 7.Calamante F, Gadian DG, Connelly A. Quantification of perfusion using bolus tracking magnetic resonance imaging in stroke: assumptions, limitations, and potential implications for clinical use. Stroke. 2002;33(4):1146–51. doi: 10.1161/01.str.0000014208.05597.33. [DOI] [PubMed] [Google Scholar]
- 8.MacIntosh BJ, Lindsay AC, Kylintireas I, Kuker W, Gunther M, Robson MD, Kennedy J, Choudhury RP, Jezzard P. Multiple inflow pulsed arterial spin-labeling reveals delays in the arterial arrival time in minor stroke and transient ischemic attack. AJNR Am J Neuroradiol. 2010;31(10):1892–4. doi: 10.3174/ajnr.A2008. [DOI] [PMC free article] [PubMed] [Google Scholar]
- 9.Alsop DC, Detre JA. Reduced transit-time sensitivity in noninvasive magnetic resonance imaging of Human cerebral blood flow. Journal of Cerebral Blood Flow and Metabolism. 1996;16:1236–1249. doi: 10.1097/00004647-199611000-00019. [DOI] [PubMed] [Google Scholar]
- 10.Wong EC, Buxton RB, Frank LR. Quantitative imaging of perfusion using a single subtraction (QUIPSS and QUIPSS II) Magn Reson Med. 1998;39(5):702–8. doi: 10.1002/mrm.1910390506. [DOI] [PubMed] [Google Scholar]
- 11.Luh WM, Wong EC, Bandettini PA, Hyde JS. QUIPSS II with thin-slice TI1 periodic saturation: a method for improving accuracy of quantitative perfusion imaging using pulsed arterial spin labeling. Magn Reson Med. 1999;41(6):1246–54. doi: 10.1002/(sici)1522-2594(199906)41:6<1246::aid-mrm22>3.0.co;2-n. [DOI] [PubMed] [Google Scholar]
- 12.Ye FQ, Mattay VS, Jezzard P, Frank JA, Weinberger DR, McLaughlin AC. Correction for vascular artifacts in cerebral blood flow values measured by using arterial spin tagging techniques. Magn Reson Med. 1997;37(2):226–35. doi: 10.1002/mrm.1910370215. [DOI] [PubMed] [Google Scholar]
- 13.Wang J, Alsop DC, Song HK, Maldjian JA, Tang K, Salvucci AE, Detre JA. Arterial transit time imaging with flow encoding arterial spin tagging (FEAST) Magn Reson Med. 2003;50(3):599–607. doi: 10.1002/mrm.10559. [DOI] [PubMed] [Google Scholar]
- 14.Yang Y, Engelien W, Xu S, Gu H, Silbersweig DA, Stern E. Transit time, trailing time, and cerebral blood flow during brain activation: measurement using multislice, pulsed spin-labeling perfusion imaging. Magn Reson Med. 2000;44(5):680–5. doi: 10.1002/1522-2594(200011)44:5<680::aid-mrm4>3.0.co;2-q. [DOI] [PubMed] [Google Scholar]
- 15.Gonzalez-At JB, Alsop DC, Detre JA. Cerebral perfusion and arterial transit time changes during task activation determined with continuous arterial spin labeling. Magn Reson Med. 2000;43:739–746. doi: 10.1002/(sici)1522-2594(200005)43:5<739::aid-mrm17>3.0.co;2-2. [DOI] [PubMed] [Google Scholar]
- 16.Wong EC, Buxton RB, Frank LR. Implementation of quantitative perfusion imaging techniques for functional brain mapping using pulsed arterial spin labeling. NMR Biomed. 1997;10:237–249. doi: 10.1002/(sici)1099-1492(199706/08)10:4/5<237::aid-nbm475>3.0.co;2-x. [DOI] [PubMed] [Google Scholar]
- 17.Gunther M, Bock M, Schad LR. Arterial spin labeling in combination with a look-locker sampling strategy: inflow turbo-sampling EPI-FAIR (ITS-FAIR) Magn Reson Med. 2001;46(5):974–84. doi: 10.1002/mrm.1284. [DOI] [PubMed] [Google Scholar]
- 18.Petersen ET, Lim T, Golay X. Model-free arterial spin labeling quantification approach for perfusion MRI. Magn Reson Med. 2006;55(2):219–32. doi: 10.1002/mrm.20784. [DOI] [PubMed] [Google Scholar]
- 19.Taei-Tehrani MR, Van Osch MJ, Brown TR. Pseudo-random arterial modulation (PRAM): a novel arterial spin labeling approach to measure flow and blood transit times. Journal of magnetic resonance imaging : JMRI. 2012;35(1):223–8. doi: 10.1002/jmri.22844. [DOI] [PubMed] [Google Scholar]
- 20.Gunther M. Highly efficient accelerated acquisition of perfusion inflow series by cycled arterial spin labeling. Proceedings of the 15th Annual Meeting of ISMRM; 2007. p. p380. [Google Scholar]
- 21.Wells JA, Lythgoe MF, Gadian DG, Ordidge RJ, Thomas DL. In vivo Hadamard encoded continuous arterial spin labeling (H-CASL) Magn Reson Med. 2010;63(4):1111–8. doi: 10.1002/mrm.22266. [DOI] [PubMed] [Google Scholar]
- 22.Dai W, Robson PM, Shankaranarayanan A, Alsop DC. A reduced resolution transit delay prescan for quantitative continuous arterial spin labeling perfusion imaging. Magn Resn Med. 2012 doi: 10.1002/mrm.23103. In Press. [DOI] [PMC free article] [PubMed] [Google Scholar]
- 23.Buxton RB, Frank LR, Wong EC, Siewert B, Warach S, Edelman RR. A general kinetic model for quantitative perfusion imaging with arterial spin labeling. Magn Reson Med. 1998;40:383–396. doi: 10.1002/mrm.1910400308. [DOI] [PubMed] [Google Scholar]
- 24.Wang J, Alsop DC, Li L, Listerud J, Gonzalez-At JB, Schnall MD, Detre JA. Comparison of quantitative perfusion imaging using arterial spin labeling at 1.5 and 4. 0 Tesla. Magn Reson Med. 2002;48(2):242–54. doi: 10.1002/mrm.10211. [DOI] [PubMed] [Google Scholar]
- 25.Lu H, Clingman C, Golay X, van Zijl PC. Determining the longitudinal relaxation time (T1) of blood at 3. 0 Tesla. Magn Reson Med. 2004;52(3):679–82. doi: 10.1002/mrm.20178. [DOI] [PubMed] [Google Scholar]
- 26.Dai W, Robson PM, Shankaranarayanan A, Alsop DC. Sensitivity calibration with a uniform magnetization image to improve arterial spin labeling perfusion quantification. Magn Resn Med. 2011 doi: 10.1002/mrm.22954. In Press. [DOI] [PMC free article] [PubMed] [Google Scholar]
- 27.Ethofer T, Mader I, Seeger U, Helms G, Erb M, Grodd W, Ludolph A, Klose U. Comparison of longitudinal metabolite relaxation times in different regions of the human brain at 1.5 and 3 Tesla. Magn Reson Med. 2003;50(6):1296–301. doi: 10.1002/mrm.10640. [DOI] [PubMed] [Google Scholar]
- 28.Dai W, Garcia D, de Bazelaire C, Alsop DC. Continuous flow-driven inversion for arterial spin labeling using pulsed radio frequency and gradient fields. Magn Reson Med. 2008;60(6):1488–97. doi: 10.1002/mrm.21790. [DOI] [PMC free article] [PubMed] [Google Scholar]
- 29.Herscovitch P, Raichle ME. What is the correct value for the brain-blood partition coefficient for water? J Cereb Blood Flow Metab. 1985;5(1):65–9. doi: 10.1038/jcbfm.1985.9. [DOI] [PubMed] [Google Scholar]
- 30.Ye FQ, Frank JA, Weinberger DR, McLaughlin AC. Noise reduction in 3D perfusion imaging by attenuating the static signal in arterial spin tagging (ASSIST) Magn Reson Med. 2000;44(1):92–100. doi: 10.1002/1522-2594(200007)44:1<92::aid-mrm14>3.0.co;2-m. [DOI] [PubMed] [Google Scholar]
- 31.Maleki N, Dai W, Alsop DC. Optimization of background suppression for arterial spin labeling perfusion imaging. Magma. 2012 doi: 10.1007/s10334-011-0286-3. In Press. [DOI] [PMC free article] [PubMed] [Google Scholar]
- 32.Shen J, Chen Z, Yang J. New FOCI pulses with reduced radiofrequency power requirements. Journal of magnetic resonance imaging : JMRI. 2004;20(3):531–7. doi: 10.1002/jmri.20134. [DOI] [PubMed] [Google Scholar]
- 33.Silver MS, Joseph RI, Hoult DI. Selective spin inversion in nuclear magnetic resonance and coherent optics through an exact solution of the Bloch-Riccati equation. Physical review A. 1985;31(4):2753–2755. doi: 10.1103/physreva.31.2753. [DOI] [PubMed] [Google Scholar]
- 34.Dai W, Robson PM, Shankaranarayanan A, CAD Benefits of interleaved continuous labeling and background suppression. Proceedings of Annual Meeting of18th ISMRM; 2010. p. 1748. [Google Scholar]
- 35.King KF, Foo TK, Crawford CR. Optimized gradient waveforms for spiral scanning. Magn Reson Med. 1995;34(2):156–60. doi: 10.1002/mrm.1910340205. [DOI] [PubMed] [Google Scholar]
- 36.Dai W, Robson PM, Shankaranarayanan A, CAD Optimization and implementation of vessel suppression preparation for ASL MRI. 17th ISMRM; 2009. p. 1512. [Google Scholar]
- 37.Bydder M, Larkman DJ, Hajnal JV. Combination of signals from array coils using image-based estimation of coil sensitivity profiles. Magn Reson Med. 2002;47(3):539–48. doi: 10.1002/mrm.10092. [DOI] [PubMed] [Google Scholar]