

Abstract
Platelets play a major role in the metastatic dissemination of tumor cells in vivo. Recent evidence reveals megakaryocyte‐derived platelet pre‐mRNA is spliced to mRNA and then translated into functional proteins in response to external stimulation. Employing a human lung cancer model, we hypothesized a subset of megakaryocyte/platelet genes exists that are significantly over or underexpressed in metastasis compared with noncancer. Microarray analysis employing platelet mRNA followed by unsupervised hierarchical clustering revealed an expression profile that includes decreased expression of 197 of the 200 platelet genes with the most altered expression (p < 1.0 × 10⁻⁴). Among the 608 splicing events identified between the metastasis and negative control groups, 33 highly variable genes were identified with between 3 and 13 splicing events each. In conclusion, this preliminary study reveals a platelet‐based gene expression signature that differentiates metastatic lung cancer from negative controls on the basis of decreased expression of 197 of the 200 genes with the most altered expression levels. Further study may yield a prognostic tool for future metastasis among subsets of early stage lung cancer patients. Clin Trans Sci 2010; Volume 3: 227–232
Keywords: platelets, metastasis, lung cancer
Introduction
Platelets arise as cytoplasmic fragments from megakaryocytes in the bone marrow. Thus they are anucleate, but retain megakaryocyte‐derived cytoplasmic pre‐mRNA, at least some of which is spliced into mRNA and translated into protein in response to external stimulation through surface receptor activation and outside‐in signaling. 1 , 2 , 3 Previously unrecognized synthetic capabilities of platelets have recently emerged and the profile of proteins released by activated platelets (the “secretome”) has been well characterized. 4
Prior studies have shown that the platelet transcriptome correlates well with platelet proteomic data, demonstrating that transcriptional analysis is relevant to the study of platelet biology, and can likely provide insights into platelet function and the mechanisms of platelet disorders. In one study, platelet proteomic data correlated well with the transcriptome, with 69% of secreted proteins detectable at the mRNA level. 5 Using microarray analysis, Gnatenko et al reported that approximately 2,000 transcripts (13–17% of probed genes) are present in unstimulated platelets and concluded that evaluating the platelet transcriptome will be useful for identifying proteins that regulate normal and pathologic platelet functions. 6
Platelets play a major role in the metastatic dissemination of tumor cells in vivo. 7 , 8 , 9 , 10 Because of the leaky vasculature of angiogenic tumors, platelets are in contact with tumor cells and are therefore able to secrete multiple factors upon activation. 11 Numerous tumor cell lines (e.g. MDA‐MB‐231 breast cancer cells) interact with platelets and stimulate platelet aggregation in vitro. 12 The requirement of platelets for murine lung metastasis to occur has been long recognized and antibody‐induced thrombocytopenia has been shown to markedly reduce the number and volume of metastasis associated with Lewis lung carcinoma, CT26 colon adenocarcinoma, and B16 amelanotic melanoma. 13
Platelets facilitate metastasis through multiple mechanisms. 11 , 12 , 13 , 14 , 15 Tumor cell survival in the circulation is helped when they nest within platelet aggregates—this shields them from natural killer cell‐mediated cell death and the effects of vascular shear stress. Platelets facilitate adhesion of blood‐borne cancer cells to endothelium through selectins, along with transmigration at metastatic sites where they also enhance angiogenesis and release growth factors such as PDGF that have been shown to act as a mitogenic stimulus. While these observations are well accepted, the detailed mechanisms behind them remains uncertain. 16
In this study, we sought to identify the relationship between platelet gene expression and lung cancer metastasis and surprisingly found near universal downregulated expression of the 200 genes with the most altered expression. These genetic findings further support the long‐held view that platelet function is significantly altered in the presence of cancer metastasis and that screening employing the tools outlined here may form the basis of an effective prognostic tool among those with nonmetastatic disease.
Methods
Patients
Outpatients with a new, untreated diagnosis of stage IV (metastatic) nonsmall cell lung cancer seen at the University of Colorado Hospital, the Denver VA Medical Center, and Denver Health Medical Center hematology/oncology clinics were identified along with patients without cancer who were seen at the same centers for nonmalignant reasons. Informed consent was obtained in accordance with the Declaration of Helsinki. This was followed by pathologist verification of biopsy tissue from outside institutions as diagnostic of nonsmall cell lung cancer. Demographic information documented included age, sex, race, height and weight, and smoking and occupational lung history.
Isolation of platelet mRNA
A total of 45 mL of blood was drawn into 5 mL of 3% sodium and platelet rich plasma was isolated from whole blood following centrifugation at 1,200 rpm for 20 minutes. Platelets were isolated after addition of 2× inactivation buffer (14 mM theophylline + 50 mM EDTA in PBS) to the plasma layer followed by centrifugation at 2,100 rpm for 15 minutes. 17 The platelet pellet was suspended in Magnetic Assisted Cell Separation (MACS) buffer (2 mM EDTA + 0.5% BSA in PBS) and further isolated using an MACS cell separation column with micro beads conjugated to anti‐CD45 antibody to facilitate leukocyte removal (Miltenyi Biotec, Auburn, CA, USA). RNA was then isolated employing an RNeasy mini kit (Qiagen, Valencia, CA, USA). Purity of platelet pellets was checked employing anti‐CD61 (platelet) and anti‐CD45 (WBC) staining of aliquots for flow cytometry analysis. Any platelet activation was also documented by flow cytometry with anti‐CD62P labeling. The integrity of extracted RNA from platelets was analyzed using an Agilent 2100 Bioanalyzer and the RNA 6000 Pico Kit (Agilent Technologies, Santa Clara, CA, USA) and concentrations were determined using a NanoDrop spectrophotometer (NanoDrop Technologies, Wilmington, DE, USA).
Exon microarray protocol
Transcriptional analysis was done at the University of Colorado Denver Microarray Core facility and the limitation of Affymetrix Exon ST arrays in their ability to determine splicing is acknowledged. Per standard protocol, RNA was amplified to generate cDNA from 500 pg of starting total RNA with the WT‐Ovation Pico RNA Amplification System following the manufacturer’s protocol (NuGEN Technologies, San Carlos, CA, USA). Sense transcript cDNA was synthesized using the NuGEN WT‐Ovation Exon Module kit following the manufacturer’s protocol. The sense transcript cDNA was fragmented and labeled using the Nugen FL‐Ovation cDNA Biotin Module V2 kit following the manufacturer’s protocol. After standard labeling, each sample was hybridized to an Affymetrix Human Exon 1.0 ST array followed by examination with an Affymetrix GeneChip Scanner 3000 (Affymetrix Inc., Santa Clara, CA, USA).
Data analysis
Principal components analysis
Principal components analysis (PCA) is a dimension‐reduction technique used to cluster microarray samples that are similar to each other by performing a covariance analysis between factors. The procedure reduces the number of correlated variables, in this case the genes being interrogated, into a smaller number of uncorrelated variables called principal components. The first component captures most of the variability in the data, and each succeeding component accounts for as much of the remaining variability, and so on. Typically, the first three components capture the majority of the variability, and a three‐dimensional plot of these components reveals the grouping of the samples.
Gene‐ and exon‐level analyses
The gene‐level and exon‐level intensity values were generated with Affymetrix Power Tools (APT), using the PLIER normalization method. All analysis from this point forward was performed using R statistical computation software and packages from Bioconductor open source software for bioinformatics.
For the gene‐level analysis, three filters were applied. First, only the “core” transcripts were selected. Second, transcripts that demonstrated little variation across all arrays were removed. This was accomplished by comparing the variance of the log‐intensities for each transcript with the median of all variation for the entire array. Genes not significantly more variable than the median were filtered out. Lastly, low expressing genes were filtered out using the Detection Above BackGroup (DABG) values where genes with DABG value higher than 0.05 were removed. The remaining genes were subjected to a student’s t‐test.
For the exon‐level analysis, three filters were applied to reduce the noise level of the data. First, only the “core” exons were selected which represent exons from well‐annotated transcripts. Second, exons with sequences that were cross hybridized to more than one unique region were removed. Lastly, exons with expression values lower than the 25th percentile of the overall intensity distribution were eliminated. The exon values were further normalized to generate the “Gene‐Normalized Intensity” (GNI) value by dividing the exon value with the corresponding transcript cluster intensity and taking the log of the results. A student’s t‐test was performed using the GNI values comparing the two experimental groups, where exons with p‐values less than 1.0 × 10⁻⁴ were selected as alternatively spliced. The splicing index was calculated as the log(2) of the lung cancer population GNI divided by the control population GNI.
Functional annotation
Data analysis of large gene lists such as the ones associated with this study is challenging and special bioinformatics databases are typically required. In this respect the DAVID bioinformatics resources from the National Institute of Allergy and Infectious Diseases (NIAID), NIH (http://david.niaid.nih.gov) were used to help derive biological meaning from the significantly over or under expressed gene lists delineated by the microarray tools. 18 , 19 From the list of the 50 genes with the most variable expression, functional annotation tables were assembled containing typical gene‐term enrichment (overrepresented) analyses to identify the most relevant (overrepresented) biological terms associated with them. These tables were then ranked on the basis of p‐value or EASE score that is defined as the chance a given term on one of the lists is significantly (p < 0.05) enriched compared to its representation in the human genome as a whole.
Results
Demographics
The small number of study subjects (five cancer patients and seven controls) precluded any meaningful interpretation of differences in baseline characteristics between groups. Those in the lung cancer group were slightly older (mean 63.6 vs. 63.1 years) while controls had a higher prevalence of current smoking (43 vs. 0%). Two lung cancer patients had prolonged occupational exposure to paint dust and welding fumes. Cancer samples were taken at the time of diagnosis and before chemo or radiation treatment was started. Among the controls, the diagnosis was hyperlipidemia in 6 and diabetes in the seventh subject. There were no recent invasive procedures in either group. The mean platelet count was 321 in the cancer patients and 178 in controls.
Gene expression profile
Since platelets are anucleate and our goal was to identify altered gene expression among metastatic lung cancer patients in comparison with noncancer patients, by definition this goal involves the identification of alternative splicing from pre‐mRNA to mRNA. One tool available to accomplish this is the Affymetrix GeneChip Human Exon 1.0 ST Array. Minimal platelet activation of identical magnitude in both groups was documented with anti‐CD62P labeling. Flow cytometry using anti‐platelet and anti‐WBC antibodies documented platelet RNA purity of >99.7%.
Principal components analysis is a way of ascertaining the variation in gene expression between two groups through performing a covariance analysis between factors. The PCA projection maps the data from each of the chips (seven and five chips in each of the two conditions) into a three‐dimensional graphic that permits visualization of sample distribution. We found the seven lung cancer samples segregate independently from the five controls thus suggesting significant genetic variation exists between them ( Figure 1 ).
Figure 1.

Principal component analysis demonstrating the variability of the gene expression data within each of the two patient groups. The fact that the points representing the five metastatic lung cancer patients (red points) are clustered distinctly apart from the seven members of the control group (blue points) is suggestive of the difference between the two groups in their respective gene expression profiles. The x, y, and z axes are the first, second, and third components that collectively capture most of the variability.
In total, we identified 200 genes differentially expressed between metastatic lung cancer and noncancer control patients with a corresponding t‐test p‐value of <1.0 × 10⁻⁴. In addition to this, we identified 608 alternative splicing events involving 424 genes. The majority of these genes contained either one (78%) or two (15%) splicing events while a minority contained three or more events per gene ( Table 1 ). Of the 200 transcripts identified, 64 were found to be included in a previously published platelet transcriptome and proteome database. 20
Table 1.
Listing of genes with multiple splicing events (number genes).
| Three events (14) | Four events (8) | Five events (6) | Six events (1) | Eight events (2) | 11 events (1) | 13 events (1) |
|---|---|---|---|---|---|---|
| AC133561.4 | BAT2D1 | BTBD12 | TPM1 | TMEM189 | PCGF5 | GNB1 |
| ACACA | C8orf42 | C21orf7 | UNC13D | |||
| ACTB | CALM3 | CDK2AP1 | ||||
| AFAP1L2 | CELSR3 | CENPT | ||||
| CDV3 | CNNM2 | TSPAN9 | ||||
| DUOXA1 | CYLN2 | VCL | ||||
| INPPL1 | KIF2A | |||||
| MAX | MYST3 | |||||
| PRKAR2B | ||||||
| PTPN1 | ||||||
| RABGAP1L | ||||||
| SFRS5 | ||||||
| UNC13B | ||||||
| ZAN |
Hierarchical clustering
The hierarchical cluster diagram of the 200 differentially expressed genes is shown in Figure 2 . This demonstrates that metastatic lung cancer patient platelet gene expression segregates from that of control patients—the lower the branch points are across the top of the map, the more the two members of each pair have in common with each other, and, not unexpectedly (based on the 200 genes differentially expressed), it can be seen that the five lung cancer samples cluster independently from controls. To the left of the map it can be seen that 200 genes have been identified that manifest significantly different expression levels between the two groups. Remarkably 197 of the 200 genes with altered expression are downregulated in the lung cancer group compared with the controls. The microarray dataset associated with these studies has been submitted to the GEO public database (geo@ncbi.nlm.nih.gov) and the accession number is GSE23361.
Figure 2.

Gene‐level analysis: Heat map showing hierarchical clustering between metastatic lung cancer and controls. Each column is one microarray (one patient) while each differentially expressed gene is represented by one row. Gene clusters are defined by the dendrogram to the left of the heat plot. Upregulated genes are shown in red; downregulated genes are shown in green. A clear pattern of downregulation is seen in the significant majority of genes and an expression profile was derived including 200 genes with a corresponding t‐test p‐value of <1.0 × 10⁻⁴.
Exon‐level analysis
The criteria leading to an exon being included in the data set was it had to exhibit a minimum fold change in expression of 1.2 and a corresponding t‐test p‐value of <1.0 × 10⁻⁴ (similar to the gene‐level analysis) when its expression was compared between the lung cancer and control groups. There were 39 exons that met the criteria that were contained within 35 genes. Each of these genes was plotted using the two‐bar chart method. The fold change and splicing index involving a representative gene is shown in Figure 3 .
Figure 3.
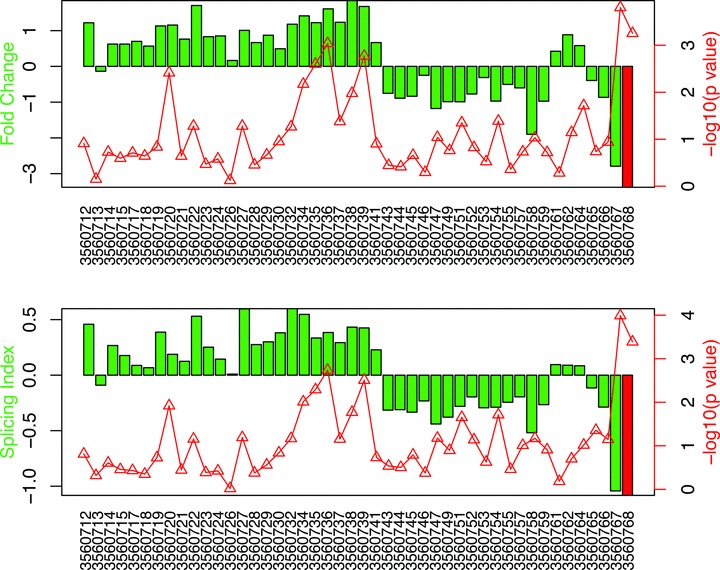
Exon‐level analysis: Example of significant under expression of a representative exon between metastatic lung cancer patients and controls. The exon number is 27 and is included within the BAZ1A gene that encodes the accessory subunit of the ATP‐dependent chromatin assembly factor (ACF). Each bar in the upper panel represents the fold change in expression for the individual probeset between the lung cancer and control samples, and the line graph designates the significance level of this difference measured in reverse log p‐value units (−log10 p‐value). The exon identified by probeset 3560768 shows markedly lower expression in the lung cancer population (−3.42 fold difference), and an elevated −log10 p‐value (11.1, equivalent to a p‐value of 0.00047). The lower panel shows that same probeset has a splicing index of −1.14 with an accompanying inverse log10 p‐value of 11.5 (P = 0.00034).
Thus we found that the discoveries of 200 genes with altered expression and 39 exons with altered expression contained within 35 genes has resulted in a core set of four genes containing at least one over‐ or under expressed exon. These four genes are UNC13D (UNC13D protein—associated with hemophagocytic syndrome), CENPT (Centromere protein T—factor required for centromere assembly in mitosis), C9orf16 (Chromosome 9 open reading frame 16), and SIRT2 (NAD‐dependent deacetylase sirtuin‐2—human homolog to yeast Sir2 protein that regulates epigenetic gene silencing and suppresses rDNA recombination).
Functional annotation
Employing DAVID database tools, we have listed representative functional annotation terms classified by p‐value/EASE score among the 44 of 50 genes (six encode unknown proteins) with the most variation in expression between the two groups identified in the gene‐level analysis (corresponding t‐test p‐value <1.32 × 10⁻⁵) ( Table 2 ). The table includes terms significantly enriched when p < 0.05. The EASE (Expression Analysis Systematic Explorer) score examines the significance of gene‐term enrichment with a modified Fisher’s exact test and is listed as a p‐value. 21 These p‐values are considered to be score systems, that is, suggesting roles rather than serving in decision‐making roles. Thus, the listed terms are among those overrepresented in the metastatic lung cancer microarray data compared with the control data.
Table 2.
Gene term enrichment in the metastatic lung cancer population.
| Term | Genes (n) | EASE Score |
|---|---|---|
| Cytoskeleton | 6 | 7.8 × 10⁻⁴ |
| Regulation of cytoskeleton organization and biogenesis | 3 | 5.1 × 10⁻³ |
| Integral to plasma membrane | 9 | 7.0 × 10⁻³ |
| Enzyme regulator activity | 7 | 8.0 × 10⁻³ |
| Regulation of cellular component organization and biogenesis | 3 | 1.4 × 10⁻² |
| Ras protein signal transduction | 4 | 1.6 × 10⁻² |
| Regulation of signal transduction | 5 | 2.7 × 10⁻² |
Discussion
In this pilot study, a platelet gene expression profile associated with metastatic lung cancer was demonstrated and this profile was associated with downregulation of 197 of 200 genes with the most altered expression compared with controls. The significance and potential applications of these findings await further determination in a larger study. Since platelets have been found to play multiple roles in cancer cell metastasis, the fact there is pronounced downregulation of the genes with the most altered expression in this setting is very intriguing. While some of the genes identified could act as a basis for further studies of the platelet biology associated with cancer metastasis, the four‐gene panel identified by statistical analysis may also serve as a tool in the prediction of metastasis among those with lung cancer. 22 , 23 The preliminary nature of this study demonstrates two important findings: the first is that alternative splicing can be reliably detected using the exon array platform, and the second is that patients with metastatic cancer demonstrate altered platelet gene‐ and exon‐level expression profiles compared to age‐matched controls. The fact we have identified four genes with both altered expression of the whole gene as well as at least one exon within the gene is suggestive that this group would be truly likely to have altered expression if tested employing a method other than microarray. Furthermore, this study provides strong proof of principle evidence for follow‐up work with other cohorts. Our work adds to the literature of platelet gene expression by providing a more comprehensive analysis with the most up‐to‐date and sophisticated array platform, capable of interrogating both gene‐ and exon‐level expression analysis.
Human platelets play an important role in cancer metastasis and we hypothesized that a significant difference exists between subsets of the platelet mRNA transcriptome profile of metastatic lung cancer patients and negative controls. If this reflects a baseline difference between the two groups, then arguably inter‐individual variation in the mRNA transcriptome may play a role in predicting future metastasis. This would provide a very powerful tool to examine susceptibility to metastasis, as relatively small cross‐sectional studies will be sufficient to examine the metastasis risk of candidate gene products in the platelet mRNA transcriptome. 24
Some evidence that transcript profiling can distinguish diseased from normal platelet profiles is reflected in a study of essential thrombocythemia (ET) that was conducted with megakaryocytes and platelets. 25 This myeloproliferative disorder is characterized by increased proliferation of megakaryocytes, elevated numbers of morphologically normal circulating platelets, and thrombohemorrhagic events. Results demonstrated different gene expression signatures capable of distinguishing normal platelets from ET platelets and statistical analysis revealed 170 genes that were differentially expressed between ET and normal platelets.
Despite the relative paucity of gene transcription compared with nucleated cells, the platelet proteome is mirrored in the transcriptome and transcriptional analysis predicts the presence of novel proteins in the platelet. 5 , 26 , 27 In general, however, other (nonplatelet) studies comparing quantitative proteomics and standard (i.e. nonexon) microarray data have been conflicting with respect to correspondence between the two. One group hypothesized that this might in part be because the different assays were targeting different parts of the expressed genome and might therefore be subjected to confounding effects from processes such as alternative splicing. 28 Using a genome database as a platform for integration, they combined quantitative protein mass spectrometry with Affymetrix Exon array data at the level of individual exons and found significantly higher degrees of correlation than have been previously observed (r= 0.808). The authors concluded this approach opens up the possibility for the first time of considering combined microarray and proteomics datasets at the level of individual exons and isoforms, and that would be important given the high proportion of alternative splicing observed in the human.
Acknowledgment
This work was supported with seed grant funding from the University of Colorado Denver Dept of Medicine (DCC), and NIH grants 1 U54 RR025217 (TLP and MWG), P30 CA 46934 (MWG) and P50 CA 58187 (MWG).
References
- 1. Bahou WF, Gnatenko DV. Platelet transcriptome: the application of microarray analysis to platelets. Semin Thromb Hemost. 2004; 30: 473–484. [DOI] [PubMed] [Google Scholar]
- 2. Denis MM, Tolley ND, Bunting M, Schwertz H, Jiang H, Lindemann S, Yost CC, Rubner FJ, Albertine KH, Swoboda KJ, Fratto CM, Tolley E, Kraiss LW, McIntyre, TM , Zimmermann GA, Weyrich AS. Escaping the nuclear confines: signal‐dependent pre‐mRNA splicing in anucleate platelets. Cell. 2005; 122: 379–391. [DOI] [PMC free article] [PubMed] [Google Scholar]
- 3. Macaulay IC, Carr P, Gusnanto A, Ouwehand WH, Fitzgerald D, Watkins NA. Platelet genomics and proteomics in human health and disease. J Clin Invest. 2005; 115: 3370–3377. [DOI] [PMC free article] [PubMed] [Google Scholar]
- 4. Weyrich AS, Lindemann S, Zimmerman GA. The evolving role of platelets in inflammation. J Thromb Haemost. 2003; 1: 1897–1905. [DOI] [PubMed] [Google Scholar]
- 5. McRedmond JP, Park SD, Reilly DF, Coppinger JA, Maguire PB, Shields DC Fitzgerald DJ. Integration of proteomics and genomics in platelets: a profile of platelet proteins and platelet‐specific genes. Mol Cell Proteomics. 2004; 3:133–144. [DOI] [PubMed] [Google Scholar]
- 6. Gnatenko DV, Dunn JJ, McCorkle SR, Weissman D, Perotta PL, Bahou WF. Transcript profiling of human platelets using microarray and serial analysis of gene expression. Blood. 2003; 101:2285–2293. [DOI] [PubMed] [Google Scholar]
- 7. Erpenbeck L, Schon MP. Deadly allies: the fatal interplay between platelets and metastasizing cancer cells. Blood. 2010; 115: 3427–3436. [DOI] [PMC free article] [PubMed] [Google Scholar]
- 8. Camerer E, Qazi AA, Duong DN, Cornelissen I, Advincula R, Coughlin SR. Platelet, protease‐activated receptors, and fibrinogen in hematogenous metastasis. Blood. 2004; 104: 397–401. [DOI] [PubMed] [Google Scholar]
- 9. Felding‐Habermann B, O‘Toole TE, Smith JW, Fransvea E, Ruggeri ZM, Ginsberg MH, Hughes PE, Pampori N, Shattil SJ, Saven A, Mueller BM. Integrin activation controls metastasis in human breast cancer. Proc Natl Acad Sci USA. 2001; 98: 1853–1858. [DOI] [PMC free article] [PubMed] [Google Scholar]
- 10. Bakewell SJ, Nestor P, Prasad S, Tomasson MH, Dowland N, Mehrotra M, Scarborough R, Kanter J, Abe K, Phillips D, Weilbaecher KN. Platelet and osteoclast beta3 integrins are critical for bone metastasis. Proc Nat Acad Sci USA. 2003; 100: 14205–14210. [DOI] [PMC free article] [PubMed] [Google Scholar]
- 11. Trikha M, Nakada MT. Platelets and cancer: implications for antiangiogenic therapy. Semin Thromb Hemost. 2002; 28: 39–44. [DOI] [PubMed] [Google Scholar]
- 12. Belloc C, Lu H, Soria C, Fridman R, Legrand Y, Menashi S. The effect of platelets on invasiveness and protease production of human mammary tumor cells. Int J Cancer. 1995; 60: 413–417. [DOI] [PubMed] [Google Scholar]
- 13. Karpatkin S, Pearlstein E, Ambrogio C, Coller BS. Role of adhesive proteins in platelet tumor interaction in vitro and metastasis formation in vivo. J Clin Invest. 1988; 81: 1012–1019. [DOI] [PMC free article] [PubMed] [Google Scholar]
- 14. Nieswandt B, Hafner M, Echtenacher B, Mannel DM. Lysis of tumor cells by natural killer cells in mice is impeded by platelets. Cancer Res. 1999; 59: 1295–1300. [PubMed] [Google Scholar]
- 15. Boucharaba A, Serre CM, Gres S, Saulnier‐Blache JS, Bordet JC, Guglielmi J, Clezardin P, Peyruchaud O. Platelet‐derived lysophosphatidic acid supports the progression of osteolytic bone metasatasis in breast cancer. J Clin Invest. 2004; 114: 1714–1725. [DOI] [PMC free article] [PubMed] [Google Scholar]
- 16. Nash G, Turner LF, Scully MF, Kakkar AK. Platelets and cancer. Lancet Oncol. 2002; 3: 425–430. [DOI] [PubMed] [Google Scholar]
- 17. Calverley DC, Kavanagh TJ, Roth GJ. Human Signaling Protein 14‐3‐3 zeta interacts with platelet glycoprotein Ib subunits Ib alpha and Ib beta. Blood. 1998; 91: 1295–1303. [PubMed] [Google Scholar]
- 18. Huang DW, Sherman BT, Lempicki RA. Systemic and integrative analysis of large gene lists using DAVID Bioinformatics Resources. Nat Protoc. 2009; 4: 44–57. [DOI] [PubMed] [Google Scholar]
- 19. Dennis G Jr, Sherman BT, Hosack DA, Yang J, Gao W, Lane HC, Lempicki RA. DAVID: Database for Annotation, Visualization, and Integrated Discovery. Genome Biol. 2003; 4: P3. [PubMed] [Google Scholar]
- 20. Dittrich M, Birschmann I, Mietner S, Sickmann A, Walter U, Dandekar T. Platelet protein interactions: map, signaling components, and phosphorylation groundstate. Arterioscler Thromb Vasc Biol. 2008; 28: 1326–1331. [DOI] [PubMed] [Google Scholar]
- 21. Hosack DA, Dennis G Jr, Sherman BT, Lane HC, Lempicki RA. Identifying biological themes within lists of genes with EASE. Genome Biol. 2003; 4: R70. [DOI] [PMC free article] [PubMed] [Google Scholar]
- 22. Simon R. Diagnostic and prognostic prediction using gene expression profiles in high dimensional microarray data. Br J Cancer. 2003; 89:1599–1604. [DOI] [PMC free article] [PubMed] [Google Scholar]
- 23. Dobbin KK, Simon RM. Sample size determination in microarray experiments for class comparison and prognostic classification. Biostatistics. 2005; 6: 27–38. [DOI] [PubMed] [Google Scholar]
- 24. Healy AM, Pickard MD, Pradhan AD, Wang Y, Chen Z, Croce K, Sakuma M, Shi C, Zago AC, Garasic J, Damokosh AI, Dowie TL, Poisson L, Lillie J, Libby P, Ridker PM, Simon DI. Platelet expression profiling and clinical validation of myeloid‐related protein‐14 as a novel determinant of cardiovascular events. Circulation. 2006; 113: 2278–2284. [DOI] [PubMed] [Google Scholar]
- 25. Gnatenko DV, Cupit LD, Huang EC, Dhundale A, Perrotta PL, Bahou WF. Platelets express steroidogenic 17 beta‐hydroxysteroid dehydrogenases: distinct profiles predict the essential thrombocythemic phenotype. Thromb Haemost. 2005; 94: 412–421. [DOI] [PubMed] [Google Scholar]
- 26. Gnatenko DV, Perotta PL, Bahou WF. Proteomic approaches to dissect platelet function: half the story. Blood. 2006; 108: 3983–3991. [DOI] [PMC free article] [PubMed] [Google Scholar]
- 27. Watson SP, Bahou WF, Fitzgerald D, Ouwehand W, Rao AK, Leavitt AD. Mapping the platelet proteome: a report of the ISTH Platelet Physiology Subcommittee. J Thromb Haemost. 2005; 3: 2098–2101. [DOI] [PubMed] [Google Scholar]
- 28. Bitton DA, Okoniewski MJ, Connolly Y, Miller CJ. Exon level integration of proteomics and microarray data. BMC Bioinform. 2008; 9: 118. [DOI] [PMC free article] [PubMed] [Google Scholar]