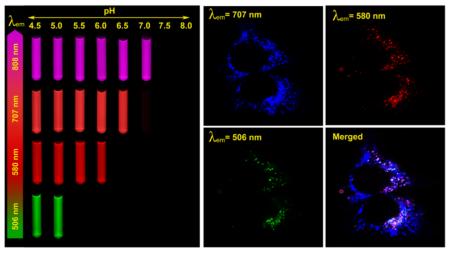
Abstract
Tunable, ultra-pH responsive fluorescent nanoparticles with multichromatic emissions are highly valuable in a variety of biological studies, such as endocytic trafficking, endosome/lysosome maturation, and pH regulation in subcellular organelles. Small differences (e.g., <1 pH unit) and yet finely regulated physiological pH inside different endocytic compartments present a huge challenge to the design of such a system. Herein, we report a general strategy to produce pH-tunable, highly activatable multicolored fluorescent nanoparticles using commonly available pH-insensitive dyes with emission wavelengths from green to near IR range. pH-induced micellization is the primary driving force of fluorescence activation between the ON (unimer) and OFF (micelle) states. Among three possible photochemical mechanisms, homo Förster resonance energy transfer (homo-FRET) was found to be the most facile strategy to render ultra-pH response over the H-dimer and photoinduced electron transfer (PeT) mechanisms. Based on this insight, we selected several fluorophores with small Stoke shifts (<40 nm) and established a panel of multicolored nanoparticles with wide emission range (500-820 nm) and different pH transitions. Each nanoparticle maintained the sharp pH response (ON/OFF <0.25 pH unit) with corresponding pH transition point at pH 5.2, 6.4, 6.9 and 7.2. Incubation of a mixture of multicolored nanoparticles with human H2009 lung cancer cells demonstrated sequential activation of the nanoparticles inside endocytic compartments directly correlating with their pH transitions. This multicolored, pH-tunable nanoplatform offers many exciting opportunities for the study of many important cell physiological processes such as pH regulation and endocytic trafficking of subcellular organelles.
INTRODUCTION
Fluorescence imaging has become an essential tool in the study of biological molecules, pathways and processes in living cells thanks to its ability in providing spatial-temporal information at microscopic, mesoscopic and macroscopic levels.1-3 Fluorescent reporter molecules can be broadly divided into two categories: intrinsically expressed fluorescent proteins (e.g., GFP) or externally administered fluorescent probes (e.g., synthetic dyes). Fluorescent protein reporters have greatly impacted studies in basic biological sciences by specific labeling of target proteins and live cell imaging of protein function.4,5 External imaging probes have been extensively used in various cellular and animal imaging studies. Recently, activatable imaging probes that are responsive to physiological stimuli such as ionic and redox potentials, enzymatic expression, and pH have received considerable attention to probe cell physiological processes.6-11 Among these stimuli, pH stands out as an important physiological parameters that plays a critical role in both the intracellular (pHi) and extracellular (pHe) milieu.12 For example, the pH of intracellular compartments (e.g. endocytic vesicles) in eukaryotic cells is carefully controlled and directly affects many processes such as membrane transport, receptor cycling, lysosomal degradation, and virus entry into cells.13-15 Recently, dysregulated pH has been described as another hallmark of cancer because cancer cells display a "reversed" pH gradient with a constitutively increased cytoplasmic pH that is higher than the extracellular pH (pHe).16 Although various pH-sensitive fluorescent probes have been reported,17,18 their pH sensitivity primarily arises from ionizable residues with pH-dependent photo-induced electron transfer (PeT) properties to the fluorophores. One potential drawback for these fluorescent agents is their broad pH response (ΔpH~2) as dictated by the Henderson-Hasselbalch equation.19 This lack of sharp pH response makes it difficult to detect subtle pH differences between the acidic intracellular organelles (e.g., <1 pH difference between early endosomes and lysosomes)13,20 or pHe in solid tumors (6.5-6.9)16,21 over normal tissue environment (7.4). Moreover, simultaneous control of pH transition point and emission wavelengths (in particular, in the near IR range) is difficult for small molecular dyes. Recent attempts to develop pH-sensitive fluorescent nanoparticles primarily employ polymers conjugated with small molecular pH-sensitive dyes,22-25 or the use of pH-sensitive linkers to conjugate pH-insensitive dyes.26,27 These nanoprobe designs also yield broad pH response and lack the ability to fine-tune pH transition point.
In this study, we report a general strategy to create pH-tunable, highly activatable (ΔpH < 0.25) multicolored fluorescent nanoparticles using commonly available pH-insensitive dyes from green to near IR emission range. This multicolored nanoplatform is built on our previous work in the development of ultra-pH responsive tetramethyl rhodamine (TMR)-based nanoparticles with tunable pH transitions in the physiological range (5.0-7.4)28 In the present work, we systematically investigated the mechanism of fluorescent nanoparticle activation and observed direct correlation of pH-induced micellization and fluorescence quenching behavior. Moreover, we evaluated the contribution of different photochemical mechanisms (e.g., H-dimer formation, homo-FRET, PeT, see Figure 1) and identified homo-FRET as the key strategy for the development of ultra-pH responsive fluorescent nanoparticles. Based on these mechanistic insights, we successfully established a series of multicolored pH-activatable fluorescent nanoparticles with independent control of emission wavelengths (500-820 nm) and pH transition points (5.0-7.4). All the nanoparticles with different emission wavelengths achieved sharp pH response (ΔpH < 0.25 between ON/OFF states). Incubation of a mixture of several multicolored nanoparticles with cancer cells showed a pattern of sequential activation that directly correlated with their pH transition values. The multicolored nanoplatform provides a useful nanotechnology toolset to investigate several fundamental cell physiological processes such as pH regulation in endocytic vesicles, endosome/lysosome maturation, and effect of pH on receptor cycling and trafficking of subcellular organelles.
Figure 1.
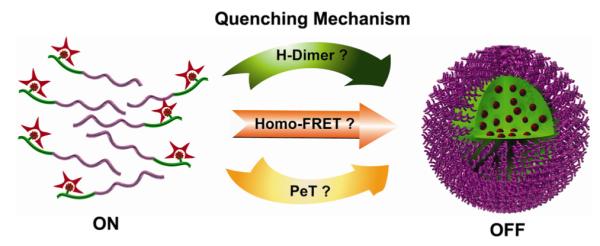
Schematic illustration of three possible photochemica mechanisms for the development of pH-activatable nanoparticles: H-dimer formation, homo Förster resonance energy transfer (homo-FRET), and photo-induced electron transfer (PeT).
RESULTS AND DISCUSSION
Relationships between pH-induced micellization and fluorescence activation
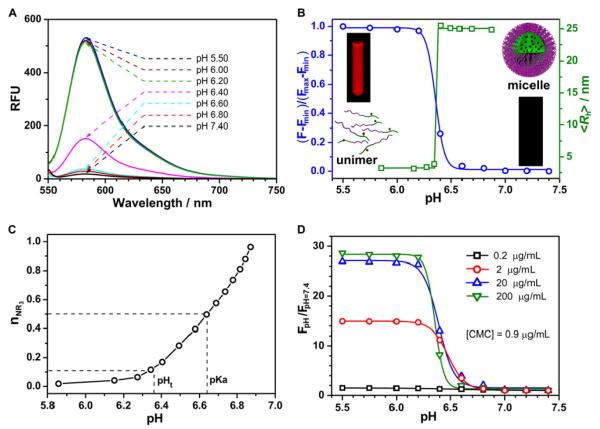
The block copolymer poly(ethylene oxide)-b-poly[2-(diisopropylamino)ethyl methacrylate-co-2-aminoethyl methacrylate hydrochloride], PEO-b-P(DPA-co-AMA) (PDPA-AMA, Supporting Information Table S1), was synthesized using the atom transfer radical polymerization method. 5-Carboxytetramethylrhodamine succinimidyl ester was used to conjugate the dye to the primary amino groups to yield PDPA-TMR copolymer.28 The pH-dependent fluorescence properties of PDPA-TMR aqueous solution are shown in Figure 2A. To quantitatively assess the pH responsive properties, we plotted normalized fluorescence intensity (NFI=[F-Fmin]/[Fmax-Fmin]) as a function of pH, where F is the fluorescence intensity of the nanoparticle at any given pH, and Fmax and Fmin are the maximal and minimal fluorescence intensities at the ON/OFF states, respectively. To quantify the sharpness of pH response, we measured ΔpH10-90%, the pH range in which the NFI value varies from 10% to 90%. For PDPA-TMR (Figure 2B), the ΔpH10-90% is 0.20 pH unit, representing a <2-fold change in proton concentration ([H+]). For pH-sensitive small molecular dyes,25 ΔpH10-90% is typically 2 pH units, corresponding to a 100-fold change in [H+].19
Figure 2.
(A) Ultra-pH responsive properties of PDPA-TMR nanoprobe (200 μg/mL), where fluorescence activation is observed within a pH range of 6.2-6.6. The sample was excited at 545 nm, and the emission spectra were collected from 550 to 750 nm. (B) Normalized fluorescence intensity as a function of pH for PDPA-TMR. The inset fluorescent images of PDPA-TMR aqueous solutions (100 μg/mL) at pH 5.5 and 7.4 were taken on an Maestro instrument. The pH dependence of number-weighted hydrodynamic radius, <Rh>, was obtained by pH titration of PDPA-TMR using 0.02 M NaOH aqueous solution. (C) Molar fraction of tertiary amino groups in PDPA-TMR as a function of pH. The fluorescence transition point (pHt) from Fig. 2B and the apparent pKa of the PDPA-TMR copolymer are indicated. (D) Fluorescence intensity ratio of PDPA-TMR samples at different pH over pH 7.4 at different polymer concentrations.
Amino groups have previously been introduced in polymers as ionizable groups to render pH sensitivity.29,30 In our nanoparticle design (Figure 3), tertiary amines with hydrophobic constituents are introduced as the ionizable hydrophobic block and poly(ethylene glycol) as the hydrophilic block. In this system, micelle formation is thermodynamically driven by two delicate balances: the first is the pH-dependent ionization equilibrium between the positively charged tertiary ammonium groups (i.e., -NHR2+) and the neutral hydrophobic tertiary amines (-NR2); and the second is the micelle self-assembly process after a critical threshold of hydrophobicity is reached in the tertiary amine segment.31-33 To mechanistically understand the correlation between pH-dependent fluorescence activation and pH-induced micellization, we compared the fluorescence activation curve with micelle formation from dynamic light scattering (DLS) experiment. Hydrodynamic radius, <Rh>, is used as the primary parameter to indicate the unimer (3 nm) to micelle (24 nm) transition (Figure 2B, Supporting Information Figure S1B). Figure 2B shows that micellization pH coincides with fluorescence activation pH, where both curves meet at pH 6.36 at 50% point. Interestingly, fluorescence pH transition value occurs before the apparent pKa (6.64, where 50% of ammonium groups are deprotonated) of the PDPA-TMR copolymer (Figure 2C). These data indicate that fluorescence quenching happens at the early phase of pH titration, where micelles are formed when a relatively small portion (~10 mol%) of ammonium groups are deprotonated to reach sufficient hydrophobicity of the PDPA segment for micelle formation. This is further supported by transmission electron microscopy analysis, which shows unimer state at pH 5.8, and formation of micelles at pH 6.8 (Supporting Information Figure S2). It is worth noting that approximately 0.5 pH unit (pH 6.4-6.9) is needed to change the ionization state of tertiary amines from 10 to 90%, suggesting micelle-induced cooperative deprotonation process compared to small ionizable molecules. Similar cooperative response was observed by Nie and coworkers with Au nanoparticles coated with carboxylic acids.34
Figure 3.
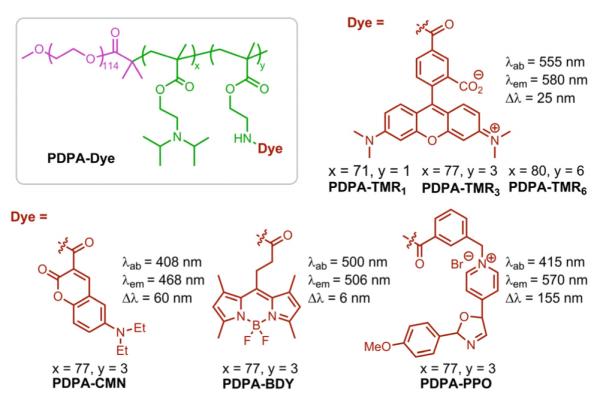
Chemical structures of PDPA-TMR1, PDPA-TMR3, PDPA-TMR6, PDPA-CMN, PDPA-BDY, PDPA-PPO and their corresponding fluorescence properties.
To further corroborate the micelle-induced fluorescence activation mechanism, we investigated the pH-dependent fluorescence intensity at copolymer concentrations above and below the critical micelle concentration (CMC).35,36 In this study, the PDPA-AMA synthetic precursor was used to measure CMC instead of PDPA-TMR to avoid possible interference of TMR dye. Data (Supporting Information Figure S3) show that the CMC is approximately 0.9 μg/mL at pH 7.4 in 0.2 M phosphate buffer. Results in Figure 2D show the extent of fluorescence activation decreases at lower copolymer concentrations. When the copolymer concentration is at 0.2 μg/mL (i.e., < CMC), almost no pH response is observed (free TMR dye is also pH insensitive in this pH range). These data suggest that the ultra- pH response (ΔpH10-90% <0.25 pH unit) of these fluorescent nanoparticles is a unique nanoscale phenomena, where pH-induced micellization is directly responsible for the observed fluorescence activation.
Investigation of the photochemical mechanisms for micelle-induced fluorescence quenching
Three most common photochemical mechanisms may contribute to the observed fluorescence quenching in the micelle nanoenvironment (Figure 1): (1) formation of H-type dimer (H-dimer) as a result of increased dye concentration in the micelle core, (2) Förster resonance energy transfer (FRET) between the dye molecules in proximity, and (3) photo-induced electron transfer (PeT) between the micelle core (e.g. electron-donating tertiary amines) and the fluorophore.6,9,17,37-40 These mechanisms have been superbly reviewed in the design of activatable fluorescent molecular dyes.6,17 For small molecular pH-sensitive dyes, PeT has been the predominant mechanism, where a window of 2 pH unit is reported for ON/OFF activation.
To investigate the relative contribution from the above three mechanisms, we systematically synthesized a series of diblock copolymers with different densities and types of the dye molecules (Figure 3). Several types of fluorophores, such as rhodamine, BODIPY and cyanine derivatives, can easily form H-type dimers at relatively high local concentrations with quenched fluorescence signal.41-45 H-dimer is a ground state complex where two dye molecules are in a sandwich-type arrangement.37,46-48 In a H-type dimer, the transition to the lower energy excited state is forbidden, which leads to its absorption blue-shifted and fluorescence diminished with respect to monomer.41,48
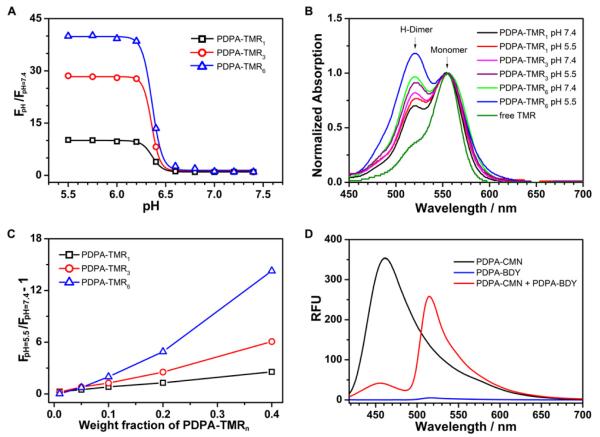
First we sought to determine the contribution of H-dimer formation to the pH-activatable fluorescence of PDPA-TMR copolymer. We synthesized a series of PDPA-TMR copolymers where the number of TMR molecules per polymer chain was increased from 1 to 3 to 6 (Supporting information, Table S1). Increase in TMR number resulted in increased fluorescence activation ratio, RF (RF = Fmax/Fmin) from 10 to 28 to 40 fold, respectively (Figure 4A). Examination of the UV-Vis spectra of all three copolymers shows that higher percentages of H-dimers were formed at the lower pH (i.e., pH = 5.5, unimer state) than those at higher pH (i.e. pH = 7.4, micelle state) as indicated by the higher intensity of absorption peak at 520 nm (Figure 4B). This result indicates that H-dimer formation is not a predominant mechanism that caused the fluorescence quenching at the micelle state. The slight increase of H-dimers at pH 5.5 may be a result of the increased mobility of the polymer chains at the unimer state, which facilitates TMR dimerization. Since H-type dimers are a ground-state complex, their formation does not affect the fluorescence lifetimes.38,49 The short fluorescence lifetime (τ ~ 0.4 ns) of PDPA-TMR3 at pH 7.4 compared to free dye (τ ~ 2 ns, Supporting Information, Figure S4) further supports H-dimer formation is not the primary cause for the fluorescence quenching at the micelle state.
Figure 4.
(A) pH dependence of the fluorescence intensity ratio of PDPA-TMR1, PDPA-TMR3 and PDPA-TMR6 aqueous solutions at different pHs to pH 7.4. Copolymer concentrations were at 200 μg/mL and maximum emission intensity was measured at 580 nm. (B) The UV-Vis absorbance spectra with normalization to the monomer peak intensity of PDPA-TMR1, PDPA-TMR3 and PDPA-TMR6 in aqueous solution at pH 7.4 and 5.5. Copolymer concentrations were at 200 μg/mL and free TMR dye concentration was at 1.0 μg/mL. (C) Fluorescence intensity ratio of pH 5.5 to 7.4 as a function of weight percentage of PDPA-TMR1, PDPA-TMR3 and PDPA-TMR6 over their dye-free precursors (PDPA-AMAn=1,3,6), respectively. (D) Fluorescence emission spectra of PDPA-CMN, PDPA-BDY and their molecular mixture with 1:1 weight ratio at pH 7.4. The samples were excited at CMN wavelength (λex =408 nm). Each copolymer concentration was controlled at 200 μg/mL.
Next, we investigated the contribution of the PeT and homo-FRET mechanisms to the micelle-induced fluorescence quenching. PeT occurs when HOMO energy level of the electron donors (e.g., tertiary amines from the micelle core segment) is between LUMO and HOMO energy levels of fluorescence acceptor and when they are close in proximity.6,50,51 For FRET to occur, three specific conditions must be met:38,52 (i) the emission spectrum of the donor fluorophore must overlap with the acceptor’s absorbance spectrum. With homo-FRET, the donor and acceptor are identical and therefore the dye must have a small Stokes shift; (ii) the donor and acceptor must be in the proper physical orientation; (iii) the dye-pair must be close to each other. FRET efficiency has a sixth power dependence on the separation distance, which is the most frequently manipulated parameter in its implementation in fluorescence imaging studies.
Amino groups are known to quench fluorophores through the PeT mechanism.53-57 In the PDPA-TMR solution at higher pH, its weak fluorescence signal could be caused by these electron-rich tertiary amine groups in PDPA-TMR copolymers via the PeT mechanism. To distinguish the relative contributions of PeT and homo-FRET in fluorescence quenching, we systematically varied the distance between TMR dyes (or TMR density in the micelle core) while keeping the core nanoenvironment constant. More specifically, we blended the PDPA-TMRn=1,3,6 copolymers with their dye-free precursor copolymers, (PDPA-AMAn=1,3,6), at different weight fractions (see Supporting Information for detailed procedure). We plotted (RF-1), the ratio of fluorescence intensity at pH 7.4 and 5.5 minus 1, as a function of weight fractions. With the PeT-dominant mechanism, (RF-1) is expected to be independent of the mixed percentage and the Y-intercept reflects the PeT quenching efficiency. With homoFRET-dominant mechanism, (RF-1) is expected to depend on mixed percentage with the Y-intercept approaching 0. Figure 4C clearly shows that (RF-1) approaches 0 as the mixed weight percentage decreases to zero, regardless of the TMR number in the PDPA block. Increase of TMR concentration in the micelle core (either through the increase of TMR per polymer chain, or higher molar fraction of TMR-conjugated copolymer) leads to significantly increased fluorescence quenching (i.e., higher RF values). These results indicate that homo-FRET is the predominant mechanism for the fluorescence quenching in the PDPA-TMR system with a negligible contribution from PeT.
To further verify the homo-FRET mechanism, we examined the fluorescence transfer effect from copolymers with two sets of established hetero-FRET dyes: (a) PDPA-CMN and PDPA-BDY, (b) PDPA-BDY and PDPA-TMR (see their structures and fluorescence properties in Figure 3). Each pair of copolymers was dissolved in their good solvent, THF, to make them molecularly mixed and then was added dropwise into water to make a molecular mixture of micelles (Supporting Information). In the pair of PDPA-CMN and PDPA-BDY, the fluorescence spectrum of Coumarin dye overlaps the absorbance spectrum of BODIPY dye for the hetero-FRET effect. Compared to PDPA-CMN alone micelle solution, the fluorescence intensity at Coumarin emission wavelength (i.e. 468 nm) in the mixed micelle solution decreased over 8 fold (Figure 4D). Moreover, the fluorescence intensity at BODIPY emission (506 nm) increased over 53 fold for mixed micelle solution over PDPA-BDY alone micelle solution. These results clearly demonstrate that there is a strong fluorescence energy transfer from Coumarin to BODIPY dye in the mixed micelle of PDPA-CMN and PDPA-BDY at pH 7.4. No fluorescence energy transfer is observed between them at pH 5.5 (Supporting Information Figure S5). Similar observation is made in the pair of PDPA-BDY and PDPA-TMR (Supporting Information Figure S6).
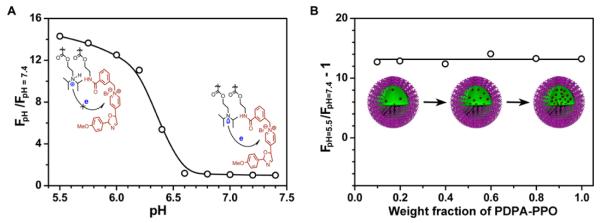
As mentioned above, homo-FRET only occurs between two identical dyes with small Stokes shift. When dye molecules with large Stokes shift are introduced into PDPA-AMA copolymer, no homo-FRET effect should be observed because their absorbance spectra do not overlap with emission spectra. As shown in Supporting information Figure S7, there is almost no pH responsive fluorescence behavior for PDPA-CMN where λex = 408 nm, λem = 468 nm and Δλ = 60 nm). For PDPA-PPO (λex = 415 nm, λem = 570 nm and Δλ = 155 nm), a 14-fold increase in RF response is observed (Figure 5A). Further examination (Figure 5B) shows that (RF-1) is independent of dye concentration and therefore distance in the micelle core. These data demonstrate that homo-FRET does not contribute to pH-induced fluorescence response of PDPA-PPO. Instead, fluorescence quenching in the micelle state is mostly due to the PeT mechanism as indicated by the large Y-intercept (RF= 14).
Figure 5.
(A) Fluorescence intensity ratio at different pH over pH 7.4 for PDPA-PPO copolymer solution (concentration = 500 μg/mL). (B) Fluorescence intensity ratio at pH 5.5 over 7.4 as a function of weight percentage of PDPA-PPO in the molecular mixture of PDPA-PPO and its dye-free synthetic precursor.
Development of a multicolored pH-tunable fluorescence nanoplatform
Although PeT mechanism can lead to pH-responsive activation of nanoparticles as shown in PDPA-PPO, it is not an ideal strategy to produce multicolored nanoplatform since the PeT efficiency is highly dependent on the matching of the HOMO of the electron-donating amino groups and LUMO of the fluorophore. This inter-dependence will greatly limit the choice of the dye molecules as well as polymers with different tertiary amines, which will make it impossible to independently control the emission wavelengths of the nanoparticles and their pH transition. Finally, the protonation/deprotonation state of amino groups will also affect the PeT efficiency54,56,57 and will lead to broadened pH response as demonstrated by the PDPA-PPO nanoparticles (Figure 5A).
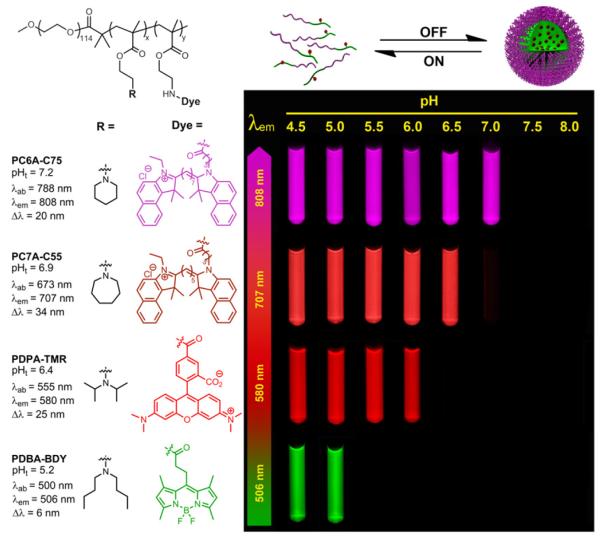
Due to the above reasons, we propose that homo-FRET combined with pH-induced micellization provide a more facile and robust strategy for the creation of multi-colored, pH-tunable fluorescence nanoplatform. Fluorophores with a small Stokes shift (Δλ<40 nm) can be selected from a variety of commonly available dye molecules with a wide range of emissions. This strategy has the additional advantage of independent control of pH sensitivity and emission wavelengths without direct energy/electron transfer between the polymers and fluorophores. Based on this rationale, we established a series of pH tunable nanoparticles with emission wavelengths ranging from green to near IR. Figure 6 shows the fluorescent images of a series of multichromatic nanoparticle solutions at different pH illustrating the sharp fluorescence transition for each nanoparticle. Quantitative data analysis show the ΔpH10-90% values are 0.22, 0.20, 0.23, and 0.24 and their pH transition points 5.2, 6.4, 6.9 and 7.2 for PDBA-BDY, PDPA-TMR, PC7A-C55 and PC6A-C75, respectively (Figure 7). For the PDPA-TMR, PC7A-C55, and PC6A-C75 (Figure 4C and Supporting information Figure S9D and S10D), only homo-FRET contributes to the fluorescence quenching mechanisms. For PC7A-C55, and PC6A-C75, 33 and 34-fold fluorescence activation ratio are achieved, respectively. For PDBA-BDY, PeT contributed to 2.5-fold fluorescence activation and homo-FRET contributed 5.2-fold (Supporting Information Figure S11D).
Figure 6.
Chemical structures of PBDA-BDY, PDPA-TMR, PC7A-C55, and PC6A-C75 and their corresponding fluorescence data. The representative fluorescent images of their aqueous solutions at the same polymer concentration (100 μg/mL) but different pH values were shown. Pseudo colors were used for PC7A-C55 and PC6A-C75 nanoprobes due to their near IR emissions.
Figure 7.
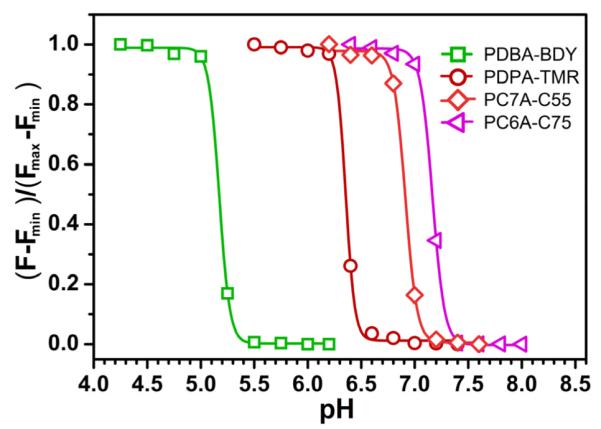
Normalized fluorescence intensity as a function of pH for PBDA-BDY, PDPA-TMR, PC7A-C55, and PC6A-C75. The excitation and emission conditions for each nanoparticle are shown in Figure 6.
The proposed strategy applies to several classes of commonly available fluorophores, including BODIPY, rhodamine, and cyanine families of derivatives for fine tuning of emission wavelengths. The strategy has the additional advantage of mix-matching different fluorophores with pH-sensitive polymer segments to create nanoparticles with desired color and pH transition point for biological studies.
Sequential activation of multicolored nanoparticles with different pH transitions inside endocytic vesicles
Vesicular trafficking is an essential process in eukaryotic cells for the delivery of membrane proteins or soluble cargos between intracellular compartments.13 Vesicular pH is a critical parameter that directly affects the membrane recycling, endo/lysosome maturation, and intracellular transport of endocytic vesicles.14,20 Vesicular pH is precisely regulated by various proton pumps such as vacuolar (H+)-ATPase, Na+/H+ exchanger, and Cl-/H+ exchanger.15,58
Our previous study has shown that nanoparticles with pH transitions at 6.3 and 5.4 can be selectively activated in different endocytic compartments such as Rab5a-GFP labeled early endosomes or Lamp1-GFP labeled late encosomes/lysosomes, respectively. Co-incubation of bafilomycin A, a V-ATPase inhibitor, is able to inhibit the acidification of endocytic organelles and prevent the activation of both nanoparticles.
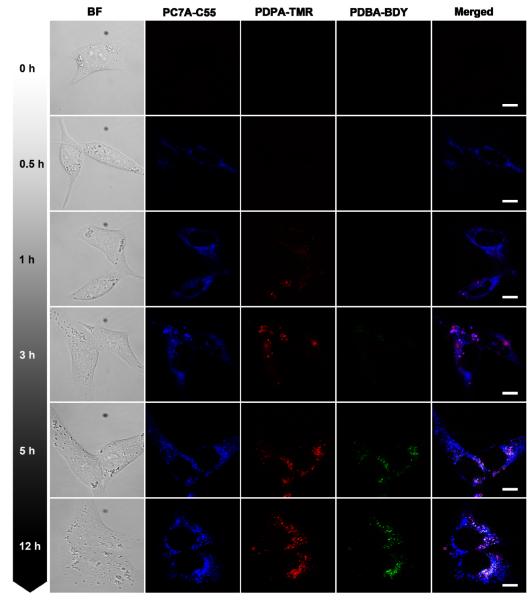
In this study, we simultaneously applied the multicolored nanoparticles with different pH transitions and investigated their spatial-temporal pattern of activation inside human H2009 lung cancer cells. The nanoparticle set consists of a mixed nanoparticle solution of PDBA-BDY (pHt = 5.2), PDPA-TMR (pHt = 6.4), and PC7A-C55 (pHt = 6.9). Each nanoparticle was controlled at the same concentration (200 μg/mL) in the same culture medium and live cell imaging was performed by confocal laser scanning microscopy using three emission wavelengths. After one-hour incubation, the mixed nanoparticle solution was removed to avoid excessive cell uptake. Because each nanoparticle was "silent" in the external cell culture medium at pH 7.4, we are able to immediately monitor the kinetics of nanoparticle uptake and activation inside the H2009 cells over time. As shown in Figure 8, the PC7A-C55 (pHt = 6.9) nanoparticles are first activated to produce the pseudo-colored blue fluorescence dots and their fluorescence intensity increases over the first hour and reaches a plateau (Figure 8). In comparison, a few PDPA-TMR nanoparticles (pHt = 6.4) start to emerge in the first hour and steadily increase over a 3 hr span as shown by the red fluorescence dots. Most of the punctate red fluorescent dots are colocalized with a subset of blue fluorescent dots. Finally, PDBA-BDY (pHt = 5.2) nanoparticles are the last to be activated, where little green fluorescence is observed in the first three hour of incubation. After 5 hours, activated fluorescence dots are fully visible, and interestingly, these punctates are further a subset of PDPA-TMR dots (Figure 8). To further quantify the time-course of intracellular activation of these nanoparticles, the fluorescence intensity for each nanoparticle over time is normalized to that at 12 hours (Figure 9). The half times of fluorescence activation for PC7A-C55, PDPA-TMR, and PDBA-BDY are determined to be 0.6, 1 and 4 hours, respectively, indicating sequential activation of these nanoparticles.
Figure 8.
Representative confocal images of human H2009 lung cancer cells after incubation with a mixture of PBDA-BDY, PDPA-TMR and PC7A-C55 nanoparticles over time. Nanoparticles with higher pH transitions (e.g. PC7A-C55, pHt = 6.9) was activated earlier in time over those with lower pH transitions. Nanoparticles with the lowest pH transitions (PBDA-BDY, pHt = 5.2) were found mostly at peri-nuclear regions. Each nanoparticle concentration was controlled at 200 μg/mL. All the scale bars are 10 μm.
Figure 9.
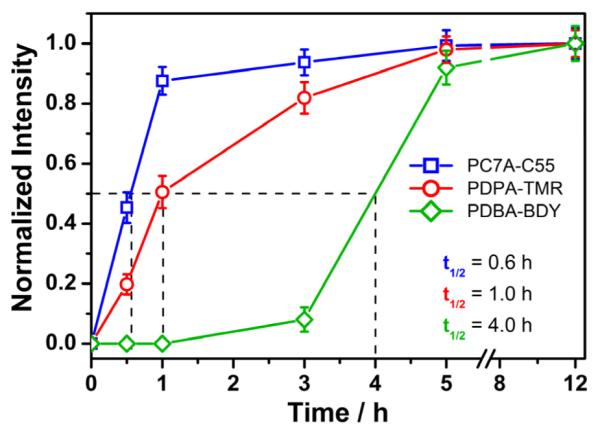
Sequential activation of multicolored nanoparticles with different pH transitions over time. The quantitative data was analyzed from confocal images as represented in Figure 8. The fluorescence intensity inside each cell was normalized to that at 12 hrs. The time (t1/2) to achieve half of the maximum intensity was estimated for each nanoparticle.
The sequential activation pattern of the multicolored nanoparticles directly correlates with their pH transitions, where nanoparticles with higher pH transition are activated earlier than those with lower pH transition. This data is consistent with the tendency of pH value change along the endocytic trafficking pathway where the vesicular pH gradually decreases from pH 7.4 (cell periphery) to 5.9-6.2 (early endosomes), then to 5.0-5.5 (late endosomes/lysosomes).13,20,59 Moreover, the intracellular location of the nanoparticle activation for PDBA-BDY (pHt = 5.2 for specific activation in lysosomes28) is consistent with the peri-nuclear distribution of lysosomes. These data demonstrate the strong potential of the ultra-pH responsive, multicolored nanoplatform to detect small pH differences between the different endocytic organelles.
CONCLUSIONS
Herein we demonstrate a robust and general strategy to create a series of pH-tunable, multicolored fluorescent nanoparticles through the use of commonly available pH-insensitive dyes. pH-induced micellization and homo-FRET quenching of fluorophores in the micelle core are the two key mechanisms for the independent control of pH transition (via polymers) and fluorescence emission (dyes with small Stoke shifts). The fluorescence wavelengths can be fine tuned from green to near IR emission range (500-820 nm). Their fluorescence ON/OFF activation can be achieved within 0.25 pH units, which is much narrower compared to small molecular pH sensors. This multicolored, pH tunable and activatable fluorescent nanoplatform provides a valuable tool to investigate fundamental cell physiological processes such as pH regulation in endocytic organelles, receptor cycling, and endocytic trafficking, which are related to cancer, lysosomal storage disease, and neurological disorders.
Supplementary Material
ACKNOWLEDGMENT
We thank Dr. Michael White for helpful discussions on cellular imaging studies, Ramona Lopez for her assistance with fluorescent imaging and Milan Poudel for fluorescence lifetime measurement. This research is supported by the NIH (RO1 EB013149) and CPRIT (RP120094).
Footnotes
ASSOCIATED CONTENT
Supporting Information. Materials, methods, detailed experimental procedures (synthesis, characterization and biological assays), and supplementary figures. This material is available free of charge via the Internet at http://pubs.acs.org.
REFERENCES
- (1).Tsien RY. Nat. Rev. Mol. Cell Biol. 2003;4:SS16. [PubMed] [Google Scholar]
- (2).Weissleder R, Pittet MJ. Nature. 2008;452:580. doi: 10.1038/nature06917. [DOI] [PMC free article] [PubMed] [Google Scholar]
- (3).Fernandez-Suarez M, Ting AY. Nat. Rev. Mol. Cell Biol. 2008;9:929. doi: 10.1038/nrm2531. [DOI] [PubMed] [Google Scholar]
- (4).Giepmans BNG, Adams SR, Ellisman MH, Tsien RY. Science. 2006;312:217. doi: 10.1126/science.1124618. [DOI] [PubMed] [Google Scholar]
- (5).Gross S, Piwnica-Worms D. Cancer Cell. 2005;7:5. doi: 10.1016/j.ccr.2004.12.011. [DOI] [PubMed] [Google Scholar]
- (6).de Silva AP, Gunaratne HQN, Gunnlaugsson T, Huxley AJM, McCoy CP, Rademacher JT, Rice TE. Chem. Rev. 1997;97:1515. doi: 10.1021/cr960386p. [DOI] [PubMed] [Google Scholar]
- (7).Zhang J, Campbell RE, Ting AY, Tsien RY. Nat. Rev. Mol. Cell Biol. 2002;3:906. doi: 10.1038/nrm976. [DOI] [PubMed] [Google Scholar]
- (8).Lee S, Park K, Kim K, Choi K, Kwon IC. Chem. Commun. 2008;4250 doi: 10.1039/b806854m. [DOI] [PubMed] [Google Scholar]
- (9).Kobayashi H, Choyke PL. Acc. Chem. Res. 2010;44:83. doi: 10.1021/ar1000633. [DOI] [PMC free article] [PubMed] [Google Scholar]
- (10).Lovell JF, Liu TWB, Chen J, Zheng G. Chem. Rev. 2010;110:2839. doi: 10.1021/cr900236h. [DOI] [PubMed] [Google Scholar]
- (11).Ueno T, Nagano T. Nat. Methods. 2011;8:642. doi: 10.1038/nmeth.1663. [DOI] [PubMed] [Google Scholar]
- (12).Alberts B, Johnson A, Lewis J, Raff M, Roberts K, Walter P. Molecular Biology of the Cell. 5th ed Garland Science; New York: 2008. [Google Scholar]
- (13).Maxfield FR, McGraw TE. Nat Rev Mol Cell Biol. 2004;5:121. doi: 10.1038/nrm1315. [DOI] [PubMed] [Google Scholar]
- (14).Izumi H, Torigoe T, Ishiguchi H, Uramoto H, Yoshida Y, Tanabe M, Ise T, Murakami T, Yoshida T, Nomoto M, Kohno K. Cancer Treat. Rev. 2003;29:541. doi: 10.1016/s0305-7372(03)00106-3. [DOI] [PubMed] [Google Scholar]
- (15).Nishi T, Forgac M. Nat Rev Mol Cell Biol. 2002;3:94. doi: 10.1038/nrm729. [DOI] [PubMed] [Google Scholar]
- (16).Webb BA, Chimenti M, Jacobson MP, Barber DL. Nat Rev Cancer. 2011;11:671. doi: 10.1038/nrc3110. [DOI] [PubMed] [Google Scholar]
- (17).Kobayashi H, Ogawa M, Alford R, Choyke PL, Urano Y. Chem. Rev. 2010;110:2620. doi: 10.1021/cr900263j. [DOI] [PMC free article] [PubMed] [Google Scholar]
- (18).Han JY, Burgess K. Chem. Rev. 2010;110:2709. doi: 10.1021/cr900249z. [DOI] [PubMed] [Google Scholar]
- (19).Atkins P, De Paula J. Physical Chemistry. Oxford University Press; 2009. [Google Scholar]
- (20).Casey JR, Grinstein S, Orlowski J. Nat. Rev. Mol. Cell Biol. 2010;11:50. doi: 10.1038/nrm2820. [DOI] [PubMed] [Google Scholar]
- (21).Zhang X, Lin Y, Gillies RJ. J. Nucl. Med. 2010;51:1167. doi: 10.2967/jnumed.109.068981. [DOI] [PMC free article] [PubMed] [Google Scholar]
- (22).Srikun D, Albers AE, Chang C. J. Chem. Sci. 2011;2:1156. [Google Scholar]
- (23).Benjaminsen RV, Sun HH, Henriksen JR, Christensen NM, Almdal K, Andresen TL. ACS Nano. 2011;5:5864. doi: 10.1021/nn201643f. [DOI] [PubMed] [Google Scholar]
- (24).Albertazzi L, Storti B, Marchetti L, Beltram F. J. Am. Chem. Soc. 2010;132:18158. doi: 10.1021/ja105689u. [DOI] [PubMed] [Google Scholar]
- (25).Urano Y, Asanuma D, Hama Y, Koyama Y, Barrett T, Kamiya M, Nagano T, Watanabe T, Hasegawa A, Choyke PL, Kobayashi H. Nat. Med. 2009;15:104. doi: 10.1038/nm.1854. [DOI] [PMC free article] [PubMed] [Google Scholar]
- (26).Li C, Xia JA, Wei XB, Yan HH, Si Z, Ju SH. Adv. Funct. Mater. 2010;20:2222. [Google Scholar]
- (27).Almutairi A, Guillaudeu SJ, Berezin MY, Achilefu S, Fréchet JMJ. J. Am. Chem. Soc. 2007;130:444. doi: 10.1021/ja078147e. [DOI] [PubMed] [Google Scholar]
- (28).Zhou K, Wang Y, Huang X, Luby-Phelps K, Sumer BD, Gao J. Angew. Chem. Int. Ed. 2011;50:6109. doi: 10.1002/anie.201100884. [DOI] [PMC free article] [PubMed] [Google Scholar]
- (29).Dai S, Ravi P, Tam KC. Soft Matter. 2008;4:435. doi: 10.1039/b714741d. [DOI] [PubMed] [Google Scholar]
- (30).Gil ES, Hudson SM. Prog. Polym. Sci. 2004;29:1173. [Google Scholar]
- (31).Zhou K, Lu Y, Li J, Shen L, Zhang G, Xie Z, Wu C. Macromolecules. 2008;41:8927. [Google Scholar]
- (32).Riess G. Prog. Polym. Sci. 2003;28:1107. [Google Scholar]
- (33).Lee ES, Shin HJ, Na K, Bae YHJ. Controlled Release. 2003;90:363. doi: 10.1016/s0168-3659(03)00205-0. [DOI] [PubMed] [Google Scholar]
- (34).Kairdolf BA, Nie S. J. Am. Chem. Soc. 2011;133:7268. doi: 10.1021/ja2001506. [DOI] [PMC free article] [PubMed] [Google Scholar]
- (35).Ananthapadmanabhan KP, Goddard ED, Turro NJ, Kuo PL. Langmuir. 1985;1:352. doi: 10.1021/la00063a015. [DOI] [PubMed] [Google Scholar]
- (36).Ruckenstein E, Nagarajan R. J. Phys. Chem. 1975;79:2622. [Google Scholar]
- (37).Valeur B. Molecular fluorescence: principles and applications. Wiley-VCH; 2002. [Google Scholar]
- (38).Lakowicz JR. Principles of Fluorescence Spectroscopy. 3rd ed Springer; New York City: 2006. [Google Scholar]
- (39).Demchenko AP. Introduction to Fluorescence Sensing. Springer Science; New York: 2008. [Google Scholar]
- (40).Lee S, Xie J, Chen XY. Curr. Top. Med. Chem. 2010;10:1135. doi: 10.2174/156802610791384270. [DOI] [PMC free article] [PubMed] [Google Scholar]
- (41).West W, Pearce S. J. Phys. Chem. 1965;69:1894. [Google Scholar]
- (42).López Arbeloa I, Ruiz Ojeda P. Chem. Phys. Lett. 1982;87:556. [Google Scholar]
- (43).Valdes-Aguilera O, Neckers DC. Acc. Chem. Res. 1989;22:171. [Google Scholar]
- (44).Packard BZ, Komoriya A, Toptygin DD, Brand L. J. Phys. Chem. B. 1997;101:5070. [Google Scholar]
- (45).Ogawa M, Kosaka N, Choyke PL, Kobayashi H. ACS Chem. Biol. 2009;4:535. doi: 10.1021/cb900089j. [DOI] [PMC free article] [PubMed] [Google Scholar]
- (46).Johansson MK, Cook RM. Chem. Eur. J. 2003;9:3466. doi: 10.1002/chem.200304941. [DOI] [PubMed] [Google Scholar]
- (47).Scheibe GZ. Angew. Chem. 1936;49:563. [Google Scholar]
- (48).Jelley EE. Nature. 1936;138:1009. [Google Scholar]
- (49).Berezin MY, Achilefu S. Chem. Rev. 2010;110:2641. doi: 10.1021/cr900343z. [DOI] [PMC free article] [PubMed] [Google Scholar]
- (50).Weller A. Pure Appl. Chem. 1968;16:115. [Google Scholar]
- (51).Wasielewski MR. Chem. Rev. 1992;92:435. [Google Scholar]
- (52).Vogel SS, Thaler C, Koushik SV. Sci. STKE. 2006;2006:re2. doi: 10.1126/stke.3312006re2. [DOI] [PubMed] [Google Scholar]
- (53).de Silva AP, Gunaratne HQN, McCoy CP. Chem. Commun. 1996;2399 [Google Scholar]
- (54).Dale TJ, Rebek J. J. Am. Chem. Soc. 2006;128:4500. doi: 10.1021/ja057449i. [DOI] [PubMed] [Google Scholar]
- (55).Diaz-Fernandez Y, Foti F, Mangano C, Pallavicini P, Patroni S, Perez-Gramatges A, Rodriguez-Calvo S. Chem. Eur. J. 2006;12:921. doi: 10.1002/chem.200500613. [DOI] [PubMed] [Google Scholar]
- (56).Tal S, Salman H, Abraham Y, Botoshansky M, Eichen Y. Chem. Eur. J. 2006;12:4858. doi: 10.1002/chem.200501332. [DOI] [PubMed] [Google Scholar]
- (57).Petsalakis ID, Lathiotakis NN, Theodorakopoulos GJ. Mol. Struc.- THEOCHEM. 2008;867:64. [Google Scholar]
- (58).Ohgaki R, van Ijzendoorn SCD, Matsushita M, Hoekstra D, Kanazawa H. Biochemistry (Mosc) 2010;50:443. doi: 10.1021/bi101082e. [DOI] [PubMed] [Google Scholar]
- (59).Modi S, Swetha MG, Goswami D, Gupta GD, Mayor S, Krishnan Y. Nat Nano. 2009;4:325. doi: 10.1038/nnano.2009.83. [DOI] [PubMed] [Google Scholar]
Associated Data
This section collects any data citations, data availability statements, or supplementary materials included in this article.


