Abstract
Because self-assembly of matrix proteins is a key step in hard tissue mineralization, developing an understanding of the assembly pathways and underlying mechanisms is likely to be important for successful hard tissue engineering. While many studies of matrix protein assembly have been performed on bulk solutions, in vivo these proteins are likely to be in contact with charged biological surfaces composed of lipids, proteins, or minerals. Here we report the results of an in situ AFM study of self-assembly by amelogenin - the principal protein of the extracellular matrix in developing enamel - in contact with two different charged substrates: hydrophilic negatively charged bare mica and positively charged 3-aminopropyl triethoxysilane (APS) silanized mica. First we demonstrate an AFM-based protocol for determining the size of both amelogenin monomers and oligomers. Using this protocol, we find that, although amelogenin exists primarily as ∼26 nm in diameter nanospheres in bulk solution at pH8.0 studied by DLS, it behaves dramatically differently upon interacting with charged substrates at the same pH, and exhibits complex substrate-dependent assembly pathways and dynamics. On positively charged APS-treated mica surfaces, amelogenin forms a relatively uniform population of decameric oligomers which then transforms into two main populations: higher-order assemblies of oligomers and amelogenin monomers, while on negatively charged bare mica surfaces, it forms a film of monomers that exhibits tip-induced desorption and patterning. The present study represents a successful attempt to identify the size of amelogenin oligomers and to directly monitor assembly and disassembly dynamics on surfaces. The findings have implications for amelogenin-controlled calcium phosphate mineralization in vitro and may offer new insights into in vivo self-assembly of matrix proteins, as well as their control over hard tissue formation.
Introduction
Self-assembly of proteins is a commonplace phenomenon in living systems and is frequently responsible for development of one, two and three dimensional functional structures. Examples include collagen fibrils,1 crystalline bacterial cell surface layers,2 clathrin-coated vesicles3 and ferritin cages.4 Matrix protein self-assembly has received particular interest because of the significant roles these proteins play in hard tissue growth and regeneration.5-6 Thus an understanding of the pathways and mechanisms of matrix protein assembly is important for hard tissue engineering and may aid in development of biomimetic approaches to design and synthesize a broad range of functional molecular structures.
Amelogenin is a major extracellular matrix protein comprising ∼90% of the total protein content in developing tooth enamel. During early stages, the matrix contains only about 30% mineral and the rest is protein and water.7 Amelogenin is mainly composed of hydrophobic regions, but has a small portion at the C-terminus that is hydrophilic. Both in vitro and in vivo experiments have shown amelogenin is able to self-assemble into higher-order structures.6,8-9 For example, it is well accepted that amelogenin self-assembles into monodisperse nanospheres at pH8.0 in vitro.6,8 In addition, a previous in vivo study by Brookes et al. indicates that amelogenin monomers form hexamers intra-cellularly before secretion, after which the further self-assembly occurs.9 Although the exact roles of amelogenin monomers and assemblies in directing enamel formation are not fully understood, several in vitro studies of calcium phosphate mineralization found that amelogenin plays a significant role in the formation of high-aspect ratio hydroxyapatite (HAP).6,10-13 Force spectroscopy and molecular modeling provided a potential rationale for this control through determinations of the free energy of binding between the C-terminal region of amelogenin and the dominant HAP faces.14 In vivo studies showed the importance of amelogenin in proper enamel formation.15-17
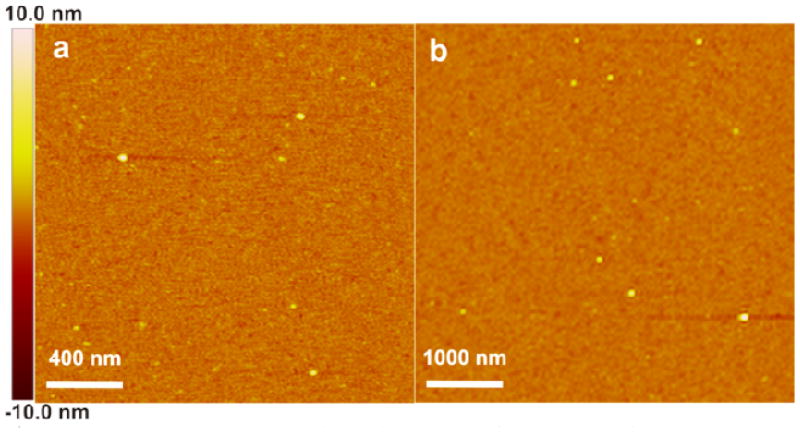
Although the amelogenin environment during mineralization in vivo is not exactly known, amelogenin will inevitably interact with lipid, protein, mineral, or other charged biological surfaces.12,17-18 Recent in vivo studies showed new bone formation exhibited much higher acceleration on the negatively charged surface of HAP than on positively charged surfaces.19 However, whether surface charge impacted matrix protein assembly and function during the hard tissue formation in vivo is unknown. In addition, ex situ studies indicated amelogenin nanospheres are unstable on a variety of surfaces in vitro.20-22 Therefore, in situ investigations of amelogenin adsorption and assembly on charged model surfaces that mimic possible in vivo environments provide a potential means to better understand amelogenin controlled enamel formation, and advance the important long-term goal of developing new therapies and materials for dental tissue repair and regeneration.
The purpose of this investigation was to utilize the in situ high-resolution capabilities of AFM to elucidate amelogenin assembly pathways and dynamics on two model surfaces of opposite physicochemical character: 1) negatively charged hydrophilic bare mica, which can be considered a model of cell membranes surfaces composed predominantly of anionic phospholipids23 or the negatively charged (001) faces of HAP crystal in vivo,24 and 2) positively charged APS mica, which may be viewed as a proxy for the positively charged (100) faces of HAP crystal in physiological conditions.24-26 In contrast to many approaches (i.e. NMR,27 DLS,28-31 SAXS,29,32 TEM30-31,33) used for the study of amelogenin self-assembly, AFM enables direct monitoring of self-assembly on surfaces at the single molecule or near-single molecule level because 1) AFM height measurements are accurate to < 1Å34 and 2) AFM imaging can be performed in situ in solution conditions close to physiological conditions at surfaces, where the course of assembly is largely dictated by intermolecular interactions and interfacial phenomena. Thus while previous efforts predominantly utilized bulk assays to investigate amelogenin self-assembly in “substrate-free” buffer solutions, or high-resolution techniques to examine ex situ samples assembled on substrates,20-22,29-31 the present study represents a successful attempt to directly observe amelogenin self-assembly on charged model surfaces under buffered environments, which may better represent the in vivo context of amelogenin assembly and enamel formation.
Experimental Section
Amelogenin (rP172) Preparation
Purified recombinant porcine amelogenin full-length rP172 was prepared as described previously.35 The rP172 protein has 172 amino acids and is an analogue to the full-length native porcine P173, but lacking the N-terminal methionine and a phosphate group on Ser16. The protein was expressed in Escherichia Coli strain BL21-codon plus (DE3-RP, Strategene), and purified by ammonium sulfate precipitation, and reverse-phase high performance liquid chromatography (HPLC, C4-214TP510 column, Vydac, Hesperia, CA).
AFM Imaging
Both ex situ (in air) and in situ (in fluid) AFM imaging were done in tapping mode or ScanAsyst mode at room temperature with either a NanoScope IIIa or Nano-Scope 8. Negatively charged hydrophilic bare mica and positively charged mica silanized by 3-aminopropyl triethoxysilane (APS)36 were used as two model surfaces of opposite physicochemical character. Amelogenin proteins solution at pH3.8 (NaOAc-HOAc buffer, 25 mM) and pH8.0 (Tris-HCl buffer, 25 mM) were prepared by directly adding related buffer solutions into pre-lyophilized 0.1 mg proteins in plastic vial to reach concentration of 0.75 mg/mL or 2.0 mg/mL. AFM samples were prepared by directly depositing them onto freshly cleaved mica, or freshly made APS-treated mica.36 In situ imaging was performed using a commercial fluid cell and silicon nitride tips under ScanAsyst mode. All the height values were determined manually from the images using Nano-Scope Analysis software, or analyzed by using SPIP 5.1.4 program.
TEM Characterization
TEM sample was prepared by pipetting one drop of amelogenin solution (0.75 mg/mL, 25 mM pH8.0 Tris-HCl buffer) onto carbon-coated electron microscopy grid; 2% phosphotungstic acid was used for negative staining. TEM was conducted on a JEOL 2100F instrument operated at 200 kV and images were collected using Gatan CCD image system.
Dynamic Light Scattering (DLS)
Dynamic light scattering (DLS) was performed using a Wyatt DynaPro Nanostar DLS instrument (Wyatt Technology, Santa Barbara, CA) at 22 °C on solutions prepared according to the same procedures as used for the AFM studies. The data were analyzed using Dynamics 7.0 software and produced by the program performing a regularization fit using a Raleigh sphere model on the Dynals algorithm.
Results and Discussion
1. An AFM-based protocol for determining the size of amelogenin monomers and oligomers
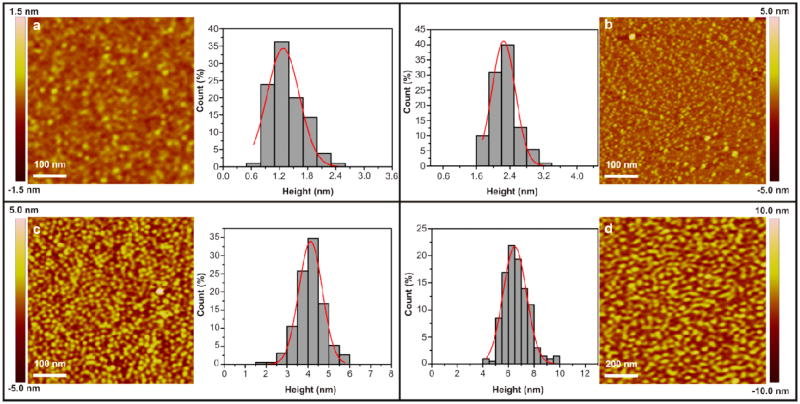
In order to elucidate the assembly pathway, degree of oligomerization and architecture of the resulting structures, we first developed an AFM-based protocol for determining the size of amelogenin particles. Calibration curves recently developed by us show a good estimate of the mass of globular proteins and their oligomers can be achieved by measuring particle heights.37 To demonstrate the feasibility of using these calibration curves to follow amelogenin self-assembly on surfaces, we began by measuring amelogenin particle heights using pH3.8 buffered protein solution, because previous studies showed amelogenin exists almost exclusively as monomers under this condition.27,30 We found amelogenin particles deposited on APS mica had uniform heights of 1.4 ± 0.4 nm when measured ex situ and 2.3 ± 0.3 nm when measured in situ (Figure 1 and Figure S1). Taking the molecular weight of amelogenin rP172 (20 kDa), we find both measurements fall squarely on the calibration curves of Cho et al. (Table S1).37
Figure 1.
AFM height images of amelogenin particles on APS mica surfaces from 0.75 mg/mL protein solution in NaOAc-HOAc buffer (25 mM, pH3.8) or Tris-HCl buffer (25 mM, pH8.0). (a) Ex situ, pH 3.8, height = 1.4 ± 0.4 nm, based on 105 counts. (b) In situ, pH 3.8, height = 2.3 ± 0.3, based on 110 counts. (c) Ex situ, pH 8.0, height = 4.1 ± 0.6 nm, based on 190 counts. (d) In situ, pH 8.0, height = 6.7 ± 1.0 nm, based on 201 counts.
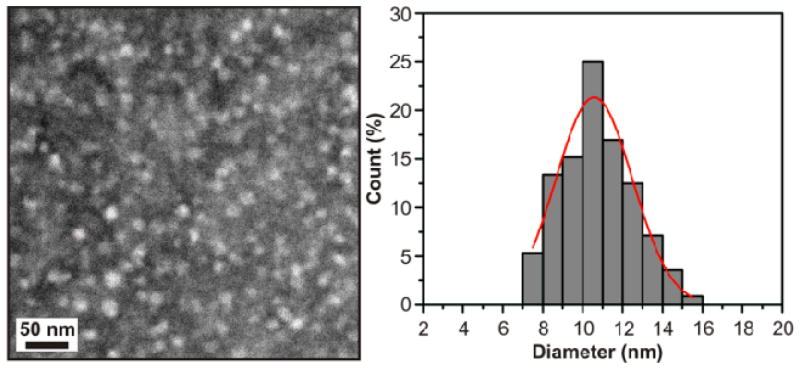
We then examined amelogenin particles formed in buffer solution at pH 8.0, because previous research showed amelogenin exists almost exclusively as nanospheres under this condition. 6,8,30 In good agreement with previous findings,30 our DLS analysis on bulk solutions revealed nanospheres having a diameter of 26.4 ± 0.6 nm (Hereafter the term “nanospheres” refers to amelogenin assemblies measuring ∼26 nm diameter in bulk solution by DLS). On APS mica, we found that the amelogenin particles had uniform ex situ heights of 4.1 ± 0.6 nm and in situ heights of 6.7 ± 1.0 nm (Figure 1 and Figure S1). As with the monomers, these ex situ and in situ heights fall on the calibration curves at precisely the same molecular weight. However, that molecular weight corresponds to a hydrodynamic diameter of only 10.4 ± 1.3 nm (Table S1). While this is less than half of the value determined for nanospheres in bulk solution by DLS, it is in excellent agreement with TEM measurements of amelogenin particles deposited on carbon grids showing the nanoparticles had uniform diameters of 10.8 ± 1.8 nm under these same solution conditions (Figure 2). Moreover, previously reported TEM data gave similarly sized nanoparticles at pH7.2.30,33 From the calibration curves, we find these heights correspond to a protein mass between 140 kDa and 290 kDa with an average of 200kDa. That is, they represent oligomers containing between 7 and 14 monomers and are, on average, decameric oligomers. Amelogenin particles formed under the same conditions and deposited on bare mica exhibited similar ex situ heights of 4.5 ± 0.9 nm (Figure S1).
Figure 2.
TEM image of amelogenin particles on a carbon grid at pH 8.0 (protein concentration = 0.75 mg/mL), diameter = 10.8 ± 1.8 nm, based on 112 counts.
A number of previous ex situ AFM (tapping mode) studies reported diameters of amelogenin particles on surfaces closer to the ∼26 nm diameter of the nanospheres seen in DLS.20,30-31,38 However, the apparent agreement is misleading due to tip convolution effects associated with lateral AFM measurements of particle size.34 This effect adds ∼ 5 - 15 nm onto the true diameter, depending on tip sharpness. Over a wide range of experimental conditions and AFM tips, we found that amelogenin oligomers gave lateral measurements ranging from ∼ 10 to 26 nm (Figure S2), while the heights were always the same to within the experimental errors noted above.
In previous work using small angle X-ray scattering (SAXS), Aichmayer et al.29,32 found that the nanospheres were oblate spheres with an aspect ratio of 2:1 and a major radius in bulk solution that was smaller than the hydrodynamic radius determined from DLS by about 2 nm (at pH 7.8). They reasoned that this difference in size could arise because nanosperes contain a dense core and a loose shell. However, even if the AFM tip were to compress or penetrate this loose outer shell deduced from the SAXS data, the maximum particle diameter measured by AFM should still be more than two times what we observed.
The results presented here suggest that, although 26 nm nanospheres dominate the particle distributions in solution at pH 8.0,6,8,30 they are not stable on these substrates and rapidly disassemble into a nearly uniform population of this lower-order unit. The result is consistent with previous findings of Tarasevich et al.,20-22 who indicated amelogenin-surface interactions could promote disassembly of nanospheres, and is supported by direct in situ observations that are described below. These new data quantify the oligomer sizes that form through this process, delineate the effect of substrate charge and demonstrate that disassembly occurs in within the time period required to engage the AFM tip (∼ 5 min).
To summarize, these results show the previously developed protein calibration curves can be applied to amelogenin, enabling us to identify monomers and quantify the size of the oligomers on surfaces. There is a clear difference between the 26 nm nanospheres previously defined through bulk solution studies and the much smaller oligomers observed on surfaces. Amelogenin surface interactions caused adsorption of uniform oligomers of 7 - 14 monomers, presumably disassembled from nanospheres in solution. Finally, the comparison of particle heights and lateral dimensions provides a rationale for the disparities in AFM-based diameters reported previously.20,30-31,38
2. Amelogenin self-assembly pathway and dynamics
The successful application of height measurements using the calibration curves to determine the size of amelogenin monomers and oligomers enabled us to perform an in situ investigation of amelogenin self-assembly on surfaces, providing further insights into the behaviors and functions of the monomers and oligomers. We found that amelogenin exhibited distinctly different adsorption and assembly behavior on APS mica where the surface is positively charged vs. freshly cleaved bare mica with its negatively charged, hydrophilic surface.
2.1 Amelogenin self-assembly pathway and dynamics on APS mica surface at pH8.0
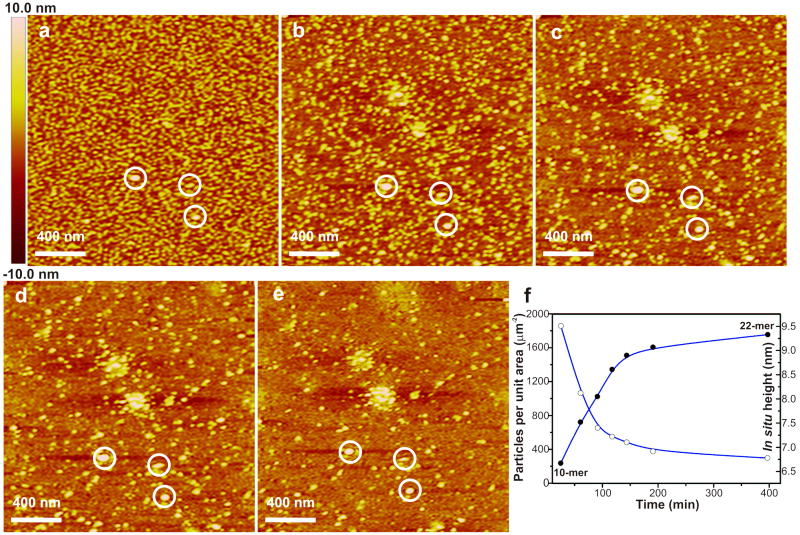
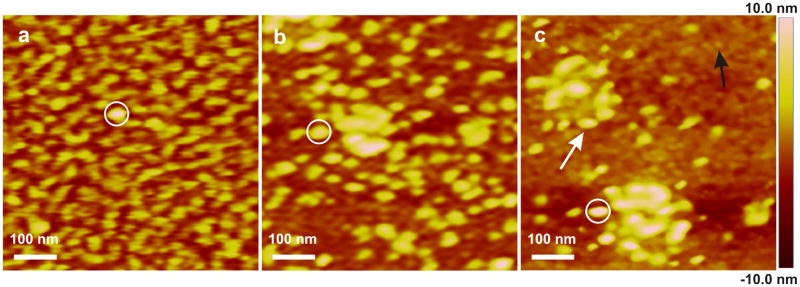
As discussed above, at pH8.0 on APS mica surfaces, amelogenin initially formed a uniform population of oligomers with in situ heights of 6.6 nm. As shown in Figure 3, during in situ imaging, these oligomers continuously increased in height and assembled into larger oligomers, some of which aggregated to form spherical clusters of oligomers. At the same time, the number density of oligomers decreased (Figure 3). Both the changes in size and number density were initially rapid before leveling off (Figure 3f). High-resolution images show that the oligomers first adsorbed on the surface with a dendritic morphology (Figure 4a) before eventually becoming isolated particles (Figure 4b). Careful examination of high-resolution images collected at late stages revealed a film of lower height particles (black arrow) co-existing on the surface with the oligomers (white arrow) and clusters (Figure 4c). Their measured in situ heights of 2.5 nm showed they were monomers (Table S1).37
Figure 3.
In situ AFM images of amelogenin particles on APS mica (pH 8.0) at different time points showing the assembly pathway and kinetics. The three circled particles provide reference points. (a) t = 25.1 min. (b) t = 60.6 min. (c) t = 91.1 min. (d) t = 143.6 min. (e) t = 397.1 min. (f) Time evolution to show total number of particles per unit area (white dots) and height of oligomers (black dots).
Figure 4.
In situ AFM images of amelogenin particles on APS mica (pH 8.0) at different time points. The circled particle provides a reference point. (a) t = 15.0 min. (b) t = 64.9 min. (c) t = 413.2 min. White and black arrows indicated amelogenin oligomer and monomer respectively.
Quantitative analysis (Figure 3f) of the images shows that the final population of clusters, oligomers and monomers can easily account for the reduction in the initial number of oligomers. At t = 25.1 min (Figure 3a), within a 2000 × 2000 nm2 area there were 1,857 oligomers having an average in situ height of ∼ 6.6 nm. According to the calibration curve (Table S1), these were composed of ∼10 monomers. Therefore, the total number of amelogenin molecules within this area was ∼18570. At t = 397.1 min (Figure 3f), the average in situ height had grown to ∼ 9.3 nm while the total number of oligomers had fallen to 298. An oligomer with an in situ height of 9.3 nm is composed of 22 amelogenin monomers (Table S1). Therefore, the total number of amelogenin molecules contained in the oligomers within the observation area had decreased to ∼ 6556. Thus, between 25.1 min and 397.1 min, the total number of amelogenin molecules contained in oligomers within the observation area decreased by 12014. If we assume that these amelogenin molecules dissociated from the oligomers formed the film of monomers observed at t = 397.1 min, then, when evenly distributed across the surface, the density of monomers would have been only one per 333 nm2. According to the calibration curve, the hydrodynamic diameter of an amelogenin monomer is ∼ 4.4 nm, which implies a fully dense monolayer would contain approximately one monomer per 15 nm2. This shows that a monolayer containing all the amelogenin molecules dissociated from the oligomers over this time period could easily fit within the available surface area.
2.2 Amelogenin adsorption and desorption dynamics on mica surfaces at pH8.0
Although similar size amelogenin oligomers were observed on both APS mica and bare mica surfaces under ex situ AFM imaging, further comparisons showed amelogenin adsorption, assembly and disassembly proceeded differently on the two oppositely charged substrates. First, the oligomer density on APS mica was much higher than on bare mica (Figure S3). Second, high-resolution images at the earliest times investigated showed that, although amelogenin existed almost exclusively as oligomers on APS mica, on the bare mica surface large amounts of low-height dendritic particles co-existed along with the oligomers (Figure S4). The ex situ heights of these particles were around 1.4 nm, which indicates they were monomers (Table S1). This phenomenon was also observed previously on bare mica surfaces (Figure S2d),31 although it did not attract much attention in the past. The observation of amelogenin monomers on bare mica surface indicates that the interaction between the amelogenin and bare mica favors disassembly of nanospheres into monomers instead of oligomers. Since the calculated isoelectric point for amelogenin rP172 is at pH7.05,30 oligomers are more negatively charged under pH 8.0 conditions than monomers. Therefore, it is reasonable that the positively charged APS mica promotes the adsorption or stabilization of oligomers, while the negatively charged mica surface favors adsorption of monomers over oligomers. The adsorption of negatively charged monomers on negatively charged bare mica maybe due to the presence of Tris-H+ cations or the possible formation of NH…O hydrogen bonds between amides (NH) from amelogenin and O from bare mica. This preference for adsorption of monomers over oligomers was also observed under in situ conditions even when the protein concentration was increased from 0.75 mg/mL to 2.0 mg/mL (Figures 5 and 6).
Figure 5.
In situ AFM height images of amelogenin particles on mica surface at pH8.0 from different protein concentrations (a) 0.75 mg/mL, (b) 2.0 mg/mL, in which amelogenin oligomers are bright yellow in color.
Figure 6.
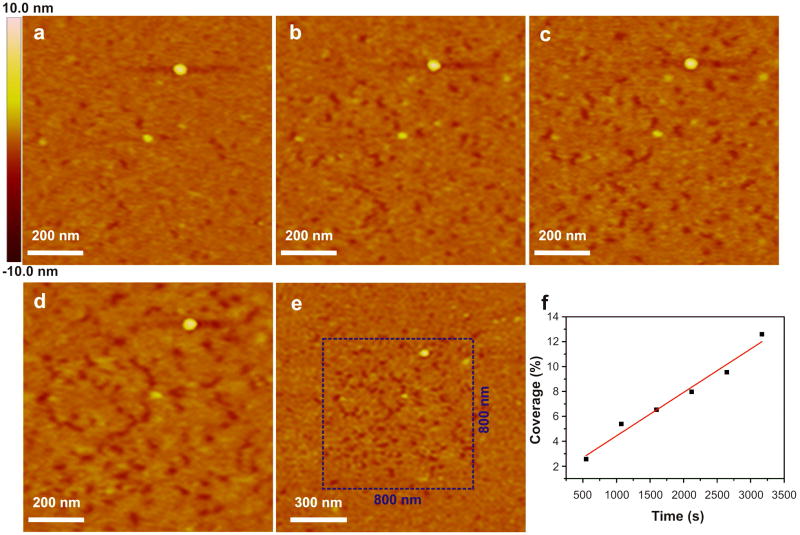
Tip-induced desorption of amelogenin. (a-e) In situ height images of amelogenin particles on mica during continuous scanning at constant force in buffered protein solution (protein concentration = 0.75 mg/mL, 25 mM pH 8.0 Tris-HCl buffer). (a) t = 548 s, (b) t = 1597 s, (c) t = 2121 s, (d) t = 3170 s, (e) t = 3613 s. (f) Time dependence of the percent coverage of amelogenin-free regions.
We reasoned that the binding affinity between the slightly negatively charged amelogenin monomers and the negatively charged bare mica surface should be fairly weak due to electrostatic repulsion. To test this hypothesis, we continuously scanned a single area (800 × 800 nm2) of Figure 5a in amelogenin buffer solution (protein concentration = 0.75 mg/mL, 25 mM pH 8.0 Tris-HCl buffer) using a constant force. This force was adjusted to as small value as was possible while still successfully obtaining images. We found that continuous in situ scanning caused a significant decrease in the number of adsorbed monomers within the scanned area (800 × 800 nm2) (Figure 6a-d) while the surrounding areas showed no significant change (Figure 6e). Quantitative analysis of the images revealed that, during the observation period, the fraction of the surface free of amelogenin increased steadily with time (Figure 6f). Amelogenin film height is ∼2.3 nm, close to the in situ AFM height of a monomer (Table S1). This observation shows: 1) disassembly of the nanospheres present in solution leads to a monolayer thick film of amelogenin, and 2) although the interactions between amelogenin and bare mica favors the adsorption or stabilization of a large population of monomers, the shear forces created by the AFM tip is sufficient to gradually remove these monomers. This effect suggests an approach to patterning amelogenin on surfaces and thus offers a potential approach to investigating amelogenin-controlled mineralization.
3. Implications for matrix protein assembly pathways and dynamics in vivo
Although determining the in vivo microenvironment in which amelogenin assembles and enamel forms remains a challenge, interactions of amelogenin with various surfaces, such as those of the forming mineral, non-amelogenin proteins and cell surfaces, are inevitable.12,17-18,39 The results presented here demonstrate that the dynamics of amelogenin adsorption and self-assembly depends on substrate surface properties. While negatively charged bare mica only weakly adsorbs amelogenin monomers, a high density of amelogenin oligomers adsorb on APS mica, consistent with Wallwork et al.'s indication that positive sites of HAP promotes adsorption of amelogenin.26 Moreover, amelogenin interaction with surfaces results in structures other than nanospheres, including monomers, oligomers and higher-order assemblies such as clusters of oligomers. Therefore, our results imply that, while amelogenin self-assembly into nanospheres may be a key step during the early stages of enamel formation, surface induced disassembly of nanospheres may also be an important process, particularly during enamel crystal growth and maturation. In particular, when the interaction between amelogenin and a surface is stronger than the interactions holding nanospheres together, their disassembly should be a common phenomenon.
Our findings also show that amelogenin surface interactions not only promote disassembly of nanospheres, as also indicated in recent ex situ studies by Tarasevich et al.,20-22 but induce adsorption of decameric oligomers to an extent that depends on surface chemistry. These oligomers function as intermediates in self-assembly of larger oligomers and oligomer clusters, as well as in disassembly into monomers. We speculate that, in analogy to the roughly circular clusters of these oligomeric intermediates that form on the surface, the nanospheres observed in bulk solution by DLS and Cryo-EM40,41 may consist of spherical clusters of these oligomeric intermediates forming in bulk solution.
These findings further indicate that amelogenin may form a broad range of quaternary structures in vivo, and exhibit much more complicated assembly dynamics and functions than previously appreciated.6,8,12,28 These structures may well have distinct biological functions; for example, monomers and small oligomers might control the growth and aspect ratio of the crystallites while nanospheres may control the spacing and organization of the crystallites as suggested by Tarasevich et al.20 In addition, the important role that surface charge plays in mediating amelogenin adsorption, assembly and disassembly dynamics may offer insights into the mechanism of amelogenin controlled HAP morphology and growth kinetics in vivo. For example, the weak adsorption of amelogenin monomers on negatively charged surfaces suggests the alteration of crystal growth kinetics and morphology can be understood in terms of reversible binding of amelogenin to the negatively charged (001) faces of HAP.24
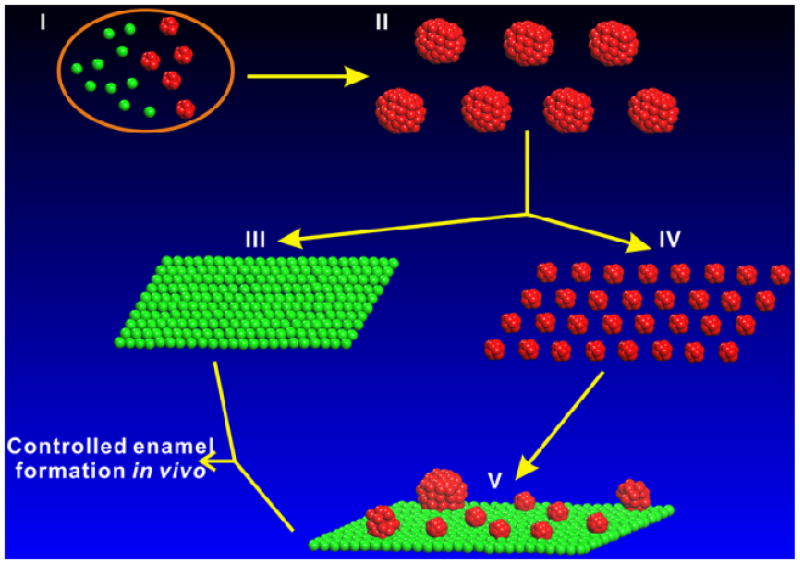
Although more in vivo and in vitro studies are needed to obtain a complete understanding of amelogenin self-assembly and structural dynamics in vivo, because the occurrence of both positively and negatively charged surfaces should be common during enamel formation, the self-assembly pathway and structural dynamics proposed in Figure 7 provides a feasible scenario for amelogenin assembly.
Figure 7.
The proposed pathway of amelogenin self-assembly and structural dynamics in vivo. Intracellular amelogenin monomers (green) and hexamers (red) in ameloblast cells (I).9 amelogenin nanospheres assemble after secretion (II). Monolayer of amelogenin monomers forms after nanospheres interact with negatively charged hydrophilic surface (III). Decameric amelogenin oligomers form following disassembly of nanospheres through interaction with positively charged surfaces (IV). Decameric oligomers exhibit unexpected structural dynamics on positively charged surfaces in situ and form a mixture of higher-order assemblies of oligomers and monomers (V).
Conclusions
By developing an AFM based protocol for determining the size of amelogenin particles, we have unambiguously assigned dimensions to amelogenin monomers and oligomers adsorbed onto mica substrates and investigated the dynamics of amelogenin assembly in situ. The results demonstrate that, while DLS data show amelogenin exists almost exclusively as nanospheres in solution at pH 8.0, no such particles appear on either bare or APS-treated mica. Instead, amelogenin initially forms a nearly uniform population of oligomers containing 10 (+4/−3) monomers. Moreover, the fate of amelogenin nanospheres and oligomers that adsorb to the surface is highly dependent on substrate surface properties. Amelogenin-substrate interactions appear to play a significant role in determining the extent to which oligomers adsorb, assemble and disassemble, possibly competing with protein-protein or inter-oligomeric interactions. We expect the protocol described here will also be useful for investigating mineralization of amelogenin following its assembly. We also believe the findings reported in this study hold clues for understanding matrix protein assembly and function during the hard tissues formation in vivo, because interactions between matrix proteins such as amelogenin and natural surfaces such as the developing mineral are commonplace in in vivo environments.
Supplementary Material
Acknowledgments
The authors gratefully acknowledge funding from the NIH-NIDCR (DE-13414 and ARRA DE-13414S2). We thank Shibi Matthew for her assistance in protein expression and purification. Portions of this work (AFM imaging) were performed as a User project at the Molecular Foundry, Lawrence Berkeley National Laboratory, which is supported by the Office of Science, Office of Basic Energy Sciences, of the U.S. Department of Energy under Contract No. DE-AC02-05CH11231.
Footnotes
Supporting Information. Supporting figures (Figures S1 – S4) and Table S1. This material is available free of charge via the Internet at http://pubs.acs.org.
Contributor Information
Janet Moradian-Oldak, Email: joldak@usc.edu.
James J. DeYoreo, Email: jjdeyoreo@lbl.gov.
References
- 1.Orgel J, Irving TC, Miller A, Wess TJ. Proc Natl Acad Sci U S A. 2006;103:9001. doi: 10.1073/pnas.0502718103. [DOI] [PMC free article] [PubMed] [Google Scholar]
- 2.Sleytr UB, Beveridge TJ. Trends Microbiol. 1999;7:253. doi: 10.1016/s0966-842x(99)01513-9. [DOI] [PubMed] [Google Scholar]
- 3.Fotin A, Cheng YF, Sliz P, Grigorieff N, Harrison SC, Kirchhausen T, Walz T. Nature. 2004;432:573. doi: 10.1038/nature03079. [DOI] [PubMed] [Google Scholar]
- 4.Theil EC, Matzapetakis M, Liu XF. J Biol Inorg Chem. 2006;11:803. doi: 10.1007/s00775-006-0125-6. [DOI] [PubMed] [Google Scholar]
- 5.George A, Ravindran S. Nano Today. 2010;5:254. doi: 10.1016/j.nantod.2010.05.005. [DOI] [PMC free article] [PubMed] [Google Scholar]
- 6.Margolis HC, Beniash E, Fowler CE. J Dent Res. 2006;85:775. doi: 10.1177/154405910608500902. [DOI] [PubMed] [Google Scholar]
- 7.Robinson C, Kirkham J, Hallsworth AS. Arch Oral Biol. 1988;33:159. doi: 10.1016/0003-9969(88)90040-4. [DOI] [PubMed] [Google Scholar]
- 8.Moradian-Oldak J. J Dent Res. 2007;86:487. doi: 10.1177/154405910708600603. [DOI] [PubMed] [Google Scholar]
- 9.Brookes SJ, Lyngstadaas SP, Robinson C, Shore RC, Kirkham J. Eur J Oral Sci. 2006;114:280. doi: 10.1111/j.1600-0722.2006.00311.x. [DOI] [PubMed] [Google Scholar]
- 10.Deshpande AS, Fang PA, Simmer JP, Margolis HC, Beniash E. J Biol Chem. 2010;285:19277. doi: 10.1074/jbc.M109.079939. [DOI] [PMC free article] [PubMed] [Google Scholar]
- 11.Fan YW, Sun Z, Wang RZ, Abbott C, Moradian-Oldak J. Biomaterials. 2007;28:3034. doi: 10.1016/j.biomaterials.2007.02.016. [DOI] [PMC free article] [PubMed] [Google Scholar]
- 12.Fincham AG, Moradian-Oldak J, Simmer JP. J Struct Biol. 1999;126:270. doi: 10.1006/jsbi.1999.4130. [DOI] [PubMed] [Google Scholar]
- 13.Yang XD, Wang LJ, Qin YL, Sun Z, Henneman ZJ, Moradian-Oldak J, Nancollas GH. J Phys Chem B. 2010;114:2293. doi: 10.1021/jp910219s. [DOI] [PMC free article] [PubMed] [Google Scholar]
- 14.Friddle RW, Battle K, Trubetskoy V, Tao JH, Salter EA, Moradian-Oldak J, De Yoreo JJ, Wierzbicki A. Angew Chem, Int Ed. 2011;50:7541. doi: 10.1002/anie.201100181. [DOI] [PMC free article] [PubMed] [Google Scholar]
- 15.Diekwisch T, David S, Bringas P, Santos V, Slavkin HC. Development. 1993;117:471. doi: 10.1242/dev.117.2.471. [DOI] [PubMed] [Google Scholar]
- 16.Gibson CW, Yuan ZA, Hall B, Longenecker G, Chen EH, Thyagarajan T, Sreenath T, Wright JT, Decker S, Piddington R, Harrison G, Kulkarni AB. J Biol Chem. 2001;276:31871. doi: 10.1074/jbc.M104624200. [DOI] [PubMed] [Google Scholar]
- 17.Paine ML, Zhu DH, Luo W, Bringas P, Goldberg M, White SN, Lei YP, Sarikaya M, Fong HK, Snead ML. J Struct Biol. 2000;132:191. doi: 10.1006/jsbi.2000.4324. [DOI] [PubMed] [Google Scholar]
- 18.Bartlett JD, Ganss B, Goldberg M, Moradian-Oldak J, Paine ML, Snead ML, Wen X, White SN, Zhou YL. Curr Top Dev Biol. 2006;74:57. doi: 10.1016/S0070-2153(06)74003-0. [DOI] [PubMed] [Google Scholar]
- 19.Nakamura S, Kobayashi T, Nakamura M, Itoh S, Yamashita K. J Biomed Mater Res Part A. 2010;92A:267. doi: 10.1002/jbm.a.32354. [DOI] [PubMed] [Google Scholar]
- 20.Tarasevich BJ, Lea S, Bernt W, Engelhard MH, Shaw WJ. J Phys Chem B. 2009;113:1833. doi: 10.1021/jp804548x. [DOI] [PMC free article] [PubMed] [Google Scholar]
- 21.Tarasevich BJ, Lea S, Bernt W, Engelhard MH, Shaw WJ. Biopolymers. 2009;91:103. doi: 10.1002/bip.21095. [DOI] [PMC free article] [PubMed] [Google Scholar]
- 22.Tarasevich BJ, Lea S, Shaw WJ. J Struct Biol. 2010;169:266. doi: 10.1016/j.jsb.2009.10.007. [DOI] [PMC free article] [PubMed] [Google Scholar]
- 23.Kowalewski T, Holtzman DM. Proc Natl Acad Sci U S A. 1999;96:3688. doi: 10.1073/pnas.96.7.3688. [DOI] [PMC free article] [PubMed] [Google Scholar]
- 24.Ohtsuki C, Ichikawa Y, Shibata H, Kawachi G, Torimoto T, Ogata S. J Mater Sci: Mater Med. 2010;21:1225. doi: 10.1007/s10856-009-3982-z. [DOI] [PubMed] [Google Scholar]
- 25.Kirkham J, Brookes SJ, Shore RC, Wood SR, Smith DA, Zhang J, Chen HF, Robinson C. Curr Opin Colloid Interface Sci. 2002;7:124. [Google Scholar]
- 26.Wallwork ML, Kirkham J, Zhang J, Smith DA, Brookes SJ, Shore RC, Wood SR, Ryu O, Robinson C. Langmuir. 2001;17:2508. [Google Scholar]
- 27.Buchko GW, Tarasevich BJ, Bekhazi J, Snead ML, Shaw WJ. Biochemistry. 2008;47:13215. doi: 10.1021/bi8018288. [DOI] [PMC free article] [PubMed] [Google Scholar]
- 28.Moradian-Oldak J, Simmer JP, Lau EC, Sarte PE, Slavkin HC, Fincham AG. Biopolymers. 1994;34:1339. doi: 10.1002/bip.360341006. [DOI] [PubMed] [Google Scholar]
- 29.Aichmayer B, Margolis HC, Sigel R, Yamakoshi Y, Simmer JP, Fratzl P. J Struct Biol. 2005;151:239. doi: 10.1016/j.jsb.2005.06.007. [DOI] [PubMed] [Google Scholar]
- 30.Wiedemann-Bidlack FB, Beniash E, Yamakoshi Y, Simmer JP, Margolis HC. J Struct Biol. 2007;160:57. doi: 10.1016/j.jsb.2007.06.007. [DOI] [PMC free article] [PubMed] [Google Scholar]
- 31.Du C, Falini G, Fermani S, Abbott C, Moradian-Oldak J. Science. 2005;307:1450. doi: 10.1126/science.1105675. [DOI] [PubMed] [Google Scholar]
- 32.Aichmayer B, Wiedemann-Bidlack FB, Gilow C, Simmer JP, Yamakoshi Y, Emmerling F, Margolis HC, Fratzl P. Biomacromolecules. 2010;11:369. doi: 10.1021/bm900983b. [DOI] [PMC free article] [PubMed] [Google Scholar]
- 33.Wiedemann-Bidlack FB, Kwak SY, Beniash E, Yamakoshi Y, Simmer JP, Margolis HC. J Struct Biol. 2011;173:250. doi: 10.1016/j.jsb.2010.11.006. [DOI] [PMC free article] [PubMed] [Google Scholar]
- 34.Gaczynska M, Osmulski PA. Curr Opin Colloid Interface Sci. 2008;13:351. doi: 10.1016/j.cocis.2008.01.004. [DOI] [PMC free article] [PubMed] [Google Scholar]
- 35.Ryu OH, Fincham AG, Hu CC, Zhang C, Qian Q, Bartlett JD, Simmer JP. J Dent Res. 1999;78:743. doi: 10.1177/00220345990780030601. [DOI] [PubMed] [Google Scholar]
- 36.Hu J, Wang M, Weier HUG, Frantz P, Kolbe W, Ogletree DF, Salmeron M. Langmuir. 1996;12:1697. [Google Scholar]
- 37.Cho KR, Huang Y, Yu SL, Yin SM, Plomp M, Qiu SR, Lakshminarayanan R, Moradian-Oldak J, Sy MS, De Yoreo JJ. J Am Chem Soc. 2011;133:8586. doi: 10.1021/ja1117446. [DOI] [PMC free article] [PubMed] [Google Scholar]
- 38.Fincham AG, Moradian-Oldak J, Simmer JP, Sarte P, Lau EC, Diekwisch T, Slavkin HC. J Struct Biol. 1994;112:103. doi: 10.1006/jsbi.1994.1011. [DOI] [PubMed] [Google Scholar]
- 39.Fan DM, Du C, Sun Z, Lakshminarayanan R, Moradian-Oldak J. J Struct Biol. 2009;166:88. doi: 10.1016/j.jsb.2009.01.003. [DOI] [PMC free article] [PubMed] [Google Scholar]
- 40.Fang PA, Margolis HC, Conway JF, Simmer JP, Dickinson GH, Beniash E. Cells Tissues Organs. 2011;194:166. doi: 10.1159/000324250. [DOI] [PMC free article] [PubMed] [Google Scholar]
- 41.Fang PA, Conway JF, Margolis HC, Simmer JP, Beniash E. Proc Natl Acad Sci U S A. 2011;108:14097. doi: 10.1073/pnas.1106228108. [DOI] [PMC free article] [PubMed] [Google Scholar]
Associated Data
This section collects any data citations, data availability statements, or supplementary materials included in this article.


