

Abstract
Purpose
To examine neural response to spoken and printed language in children with speech sound errors (SSE).
Method
Functional MRI was used to compare processing of auditorily and visually presented words and pseudowords in 17 children with SSE, ages 8;6–10;10, to 17 matched controls.
Results
When processing spoken words and pseudowords, the SSE group showed less activation than typically speaking controls in left middle temporal gyrus. They also showed greater activation than controls in several cortical and subcortical regions (e.g., left superior temporal gyrus, globus pallidus, insula, fusiform and bilateral parietal regions). In response to printed words and pseudowords, children with SSE had greater activation than controls in regions including bilateral fusiform and anterior cingulate. Some differences were found in both speech and print processing that that may be associated with children with SSE failing to show common patterns of task-induced deactivation and/or attentional resource allocation.
Conclusion
Compared with controls, children with SSE appear to rely more upon several dorsal speech perception regions and less on ventral speech perception regions. When processing print, numerous regions were observed to be activated more for the SSE group than for controls.
Overt misarticulations (e.g., sound substitutions, omissions, and distortions) that persist into elementary school are associated with negative academic, social, and speech-language outcomes (Lewis & Freebairn, 1992; Nathan, Stackhouse, Goulandris, & Snowling, 2004; Silverman & Paulus, 1989). In English (as well as many other languages), children with residual speech sound errors (SSE) typically misarticulate liquids (/r, l/), lingual fricatives (/s, z, ʃ, ʒ, Ɵ, ð/) and/or affricates /ʧ, ʤ/ (e.g., Shriberg, 1994). Some SSE may be associated with clear etiologies (e.g., structural or sensory impairment), but the majority of children with misarticulations that persist into mid-elementary school age exhibit these errors in the absence of a known cause. The cognitive and psycholinguistic processes associated with misarticulations have been investigated for decades, but the neurobiological bases have not been well explored (Peterson, McGrath, Smith, & Pennington, 2007). Therefore, the present report provides an initial description of the neural bases of language processing in school-age children with SSE of unknown origin.
Understanding how children with SSE differ in their processing of spoken language at the neural level can have important implications for understanding differences at the behavioral level. For example, there is longstanding behavioral evidence that children with SSE differ from control children in their recognition and processing of the acoustic-phonetic components of spoken words and pseuodowords and exhibit poorer discrimination and recognition of speech sounds (Bird & Bishop, 1992; Cohen & Diehl, 1963; Madison & Fucci, 1971; Rvachew & Grawburg, 2006; Shuster, 1998). Cohen and Diehl (1963) reported that first through third grade children with articulation impairments made almost twice as many errors as children with typical speech development on an auditory discrimination task of English phonemes. Moreover, Shiller, Rvachew and Brosseau-Lapré (2010) recently summarized several decades of research that has compared speech perception abilities of children with articulation difficulties to children without; of 13 studies they reviewed, very large group differences were observed (effect sizes from d=1.35 to d=8.75). As a complement to these behavioral studies, we now explore neurobiological differences in speech perception.
Shriberg and colleagues (Shriberg, 1994; Shriberg, et al., 2005) have proposed a construct they call “phonological attunement” to describe differences in children with persisting speech errors. They describe phonological attunement as the process of “tuning in and tuning up” (Shriberg et al., 2005; pg. 838) to phonetic information, presumably at the perceptual level. Although not fully specified in their writing, an inference can be made that attunement is driven by neurobiological differences in response to spoken language exhibited by children during early speech development.
In addition to speech perception differences, articulatory problems that persist into school age have been associated with difficulties in reading and spelling, as well as the phonological bases of these skills (Lewis & Freebairn, 1992; Peterson et al., 2009; Preston & Edwards, 2007). The nature of the specific mechanisms that underlie these behavioral associations remains unclear. From a cognitive-linguist perspective several studies have suggested that children with SSE have poorly specified phonological representations, which may be associated with poor speech perception, speech production and phonological awareness (e.g., Preston & Edwards, 2007; Rvachew & Grawburg, 2006). Here, we explore neurobiological differences in processing both printed language as well as spoken language in children with SSE.
Neural Bases of Speech Perception
A number of neural regions have been implicated in speech perception. The classic Wernicke’s area in the posterior superior temporal gyrus (STG) is undoubtedly important in speech perception, but recent neuroimaging studies have identified several other regions that are engaged when humans process spoken information.Binder et al. (1997), for example, reported that processing of single spoken words in adults activated a widely distributed cortical network in the left hemisphere that included the superior, middle, and inferior temporal gyri, fusiform and parahippocampal gyri, inferior, middle, and superior frontal gyri, anterior cingulate and angular gyrus, posterior cingulate/precuneus, and the right posterior cerebellum. Similar networks have been observed in studies using phonologically-based tasks; for example, in a rhyme judgment task, Booth, Wood, Lu, Houk, and Bitan (2007) observed correlated activations in left inferior/middle frontal gyrus, fusiform, superior/middle temporal gyrus, and putamen. Clearly, complex networks are involved in perception and processing of phonological information.
Hickok, Poeppel and colleagues (Hickok & Poeppel, 2004, 2007; Poeppel, Idsardi, & van Wassenhove, 2008) outline a network-based model of speech perception that provides a useful template for the present study. In their dual route model, both a dorsal and a ventral perceptual system are implicated in processing of speech. Specifically, acoustic-phonetic speech input is believed to be initially coded in the bilateral STG (e.g., Binder et al., 1997; Guenther et al., 2004; Whalen et al., 2006); following this initial activation, dorsal and ventral pathways are engaged. The dorsal pathways are comprised of the auditory-to-motor mappings in the temporal-parietal juncture of the left Sylvian fissure and the left inferior frontal/premotor regions (Callan, Jones, Callan, & Akahane-Yamada, 2004; Hickok & Poeppel, 2004). Ventral pathways involve a more direct/more efficient sound-to-meaning interface in the left middle and inferior temporal/fusiform gyri (e.g., Majerus et al., 2005; Szaflarski et al., 2006). In general, dorsal paths are engaged to a greater extent when processing novel or phonologically complex speech, whereas ventral circuits are engaged more if the input is simple or more familiar (Hickok & Poeppel, 2004, 2007).
Notably, many of the functional regions identified in speech perception studies have also been implicated as regions that are important in speech production, including left inferior frontal gyrus (IFG), precentral gyrus, STG, inferior parietal cortex and cerebellum (e.g., Guenther, 2006). Functional MRI data provide evidence of partial overlap between perception and production of speech, with the left posterior STG serving as an important region that is common in both processes (Buchsbaum, Hickok & Humphries, 2001). These findings are particularly important for understanding typical and impaired speech because they suggest that perception-based activities engage at least some of the same brain regions as those activated during speech production. In the present study, we seek to examine regions that are engaged differently in children with SSE when listening to spoken words and pseudowords.
Neural Differences in Individuals with Developmental Speech Sound Errors
Few extant studies have examined functional neural organization in persons who have SSE as their primary communication deficit. In one early study, Lou, Henricksen and Bruhn (1984) performed CAT scans with 13 children ages 6–15 years with deficits that included SSE (described as having dyspraxia or phonological-syntactic dysphasia) and attention difficulties. Compared to nine age-matched controls with typical speech and attention scores, three children described as having “dyspraxia” had reduced blood flow in left anterior perisylvian regions and four children with “phonological-syntactic” disorder had reduced bloodflow in both anterior and posterior perisylvian regions during rest. During speaking, several of the children with SSE failed to show the typical pattern of increased bloodflow to Broca's area in the left IFG. Although provocative, this study is difficult to interpret because of the heterogeneity of participants and concomitant language deficits.
One of the most comprehensive genetic and neuroimaging studies of adults with congenital speech and language impairment comes from one highly unique family, known as the “KE” family. This family includes several members with a genetic mutation resulting in severe deficits in language production as well as oral dyspraxia (Alcock, Passingham, Watkins, & Vargha-Khadem, 2000; Belton, Salmond, Watkins, Vargha-Khadem, & Gadian, 2003; Liegeois, et al., 2003; Watkins, et al., 2002). In one fMRI study in this series,Liegeois et al. (2003) reported that, relative to five unaffected family members, affected adults from the KE family showed under-activation of Broca’s area during verb generation tasks. In a companion structural study, affected KE members had reduced grey matter density (bilaterally) in the caudate nucleus, cerebellum, and the IFG (Belton, et al., 2003).
Finally, in a recent fMRI study, Tkach et al. (2011) examined six adolescents (ages 12–18) with histories of speech disorders (five whose speech errors had resolved) using a pseudoword repetition task. Compared to controls with typical speech and language, the participants with histories of speech difficulties showed less activation in right IFG and middle temporal gyrus. The clinical group also showed greater activation in bilateral premotor cortex, as well as left supplementary motor area, inferior frontal cortex, anterior cingulate, post-central gyrus, angular gyrus, and inferior parietal lobule and supramarginal gyrus. Because this task involves both perception and production, further examination of regions associated with differences in perception is warranted.
Speech and Literacy
Children with SSE tend to perform more poorly than typically speaking peers on tasks assessing phonological awareness, reading and spelling; these differences may exist even in the absence of co-occurring language impairments, and can persist into adolescence and adulthood (Bird, Bishop & Freeman, 1995; Larivee & Catts, 1999; Lewis & Freebairn, 1992; Lewis et al., 2002; Preston, 2010; Preston & Edwards, 2007). Thus, although co-occurring language impairment is often associated with poorer literacy skills than speech production deficits alone (e.g., Lewis et al., 2000; Nathan et al., 2004), several studies have found weaknesses in phonological awareness and early reading and spelling in children with isolated articulation problems (Bird, Bishop & Freeman, 1995; Leitao, Hogben & Fletcher, 1997; Lewis, Freebairn, & Taylor, 2002; Raitano et al., 2004). Interestingly, the neural circuitry involved in processing spoken and printed language shows some overlap, including left hemisphere temporal sites, fusiform gyrus, and IFG (Booth, et al., 2001; Constable, et al., 2004; Shankweiler et al., 2008). The inferior frontal subsystem, centered on Broca’s area in the posterior IFG, is believed to be sensitive to the phonological structure of printed language (Frost et al., 2009) and is also important for the perception and production of phonetic information (Callan et al., 2004; Guenther, 2006). Moreover, although the sensory input modalities differ, behavioral data indicate that the processing of printed language engages the articulatory/phonological system (e.g., Lukatela, Eaton, Sabadini, & Turvey, 2004). Thus, a secondary goal of the study is to examine how children with SSE differ in their processing of printed language.
Aims of the Study
The present study examines functional brain responses to speech and to print in children with SSE of unknown origin whose speech errors have not yet resolved by at least age 8;6. Characterizing neural differences associated with the processing of both spoken and printed language may provide important and novel information about the biological mechanisms of school-age SSE, helping us to better specify how phonetic learning might go awry. We hypothesize that if speech errors arise primarily from dysfunction of speech perception circuits (which partially overlap with production circuits), measures of functional activation will reveal differences between children with SSE and typically speaking children at cortical and subcortical speech perception circuits.
Compared with previous neuroimaging studies of children with SSE, the present study has several advantages. It includes a larger and more homogeneous sample than reported in any prior studies of SSE and participants with co-occurring language problems are excluded. Participants were obtained from a community-based sample which helps to alleviate ascertainment bias. Finally, when compared with previous studies, the control and SSE groups in the present study are more closely matched on relevant variables.
Our specific research question is, compared with typically-speaking peers, will children with SSE demonstrate differences in neural activation in regions traditionally associated with phonological processing and speech perception when processing spoken and printed language?
Methods
Participants and subject classification procedures
The Haskins/Yale study of reading development is an ongoing prospective study examining the neural and genetic bases of spoken and printed language processing in children with a wide variety of reading abilities and cognitive-linguistic profiles. Potential subjects are recruited on a rolling basis using public notices and contacts with local schools and clinics. Participants in this study are tested individually in a quiet sound-treated room and sessions are recorded with a SONY ICD-P620 digital recorder or a JVC TD-W354 cassette recorder. Children complete a wide range of standardized cognitive, academic, and language tests, including the Peabody Picture Vocabulary Test-III (Dunn & Dunn, 1997), the Woodcock-Johnson Tests of Achievement-III (Woodcock, McGrew, & Mather, 2001), the Comprehensive Test of Phonological Processing (Wagner, Torgesen, & Rashotte, 1999), the Test of Word Reading Efficiency (Torgesen, Wagner & Rashotte, 1999), and the Wechsler Abbreviated Scale of Intelligence (Wechsler, 1999). In addition, children participate in an fMRI study that asks them to make decisions about word and word-like stimuli that are presented auditorily (auditory decision-making) and visually (print decision-making).
Identification of children with SSE and matched controls from this larger sample was a multi-step process. Three initial selection criteria were imposed: 1) all subjects had to be monolingual English speakers with no frank cognitive, physical, or sensory disabilities that might affect speech production; 2) fMRI data had to be available and of sufficient quality for review (i.e., had data equivalent to at least 6 functional runs); 3) children had to be between 8;6 and 11;0 at the time of fMRI. Applying these criteria resulted in a pool of 76 potential subjects. These subjects were subsequently divided into those with and without SSE through an analysis of approximately five minutes of audio-recorded connected speech (the vocabulary subtest of the WASI, although other speech samples were used if this recording was of poor quality).
The audio recordings of all 76 potential subjects were analyzed by a trained listener to identify the presence of perceptually identifiable articulation errors. The listeners first determined if the recording was of adequate quality to evaluate the phonetic accuracy of the child’s speech, resulting in exclusion of data from four subjects. The remaining 72 tapes were subsequently classified as follows: no misarticulations (potential control group, N=51), questionable speech (infrequent errors, excluded from the study, N=4), or persistent misarticulations (SSE group, N=17). These initial classifications were confirmed by a second listener (either the first or second author) who was blind to the initial classification decision. Agreement between the first and second listeners for classification of SSE was 100%. As a final step, the potential control group was re-examined to exclude children for whom there was a positive parent report that the child had received speech or language therapy for any reason (n=14) and to balance gender (n=19 females). This adjustment resulted in a final study sample of 17 control subjects (14 males) and 17 SSE subjects (14 males) between the ages of 8;6–10;10.
Percent Consonants Correct-Late 8 (Shriberg et al., 1997) was used to quantify accuracy of the late developing phonemes (/r, l, s, z, ð, θ, ʃ, ʒ/) from the speech samples. All samples included more than 300 consonant attempts and at least 120 Late 8 consonant attempts. The SSE group achieved PCC-Late 8 scores from 42–88%, whereas all control children achieved scores from 95–100%. All children in the SSE group displayed errors on the /s/ and/or the /r/ phonemes and occasionally other sounds. Sounds that were in error on greater than 30% of a child’s attempts included /r/ (10 children), /l/ (2 children), /s/ (9 children), /z/ (8 children), /θ/ (3 children), / ʃ/ (4 children), /ʧ/ (3 children) and /ʤ/ (1 child). Error patterns reflected those typically seen in children with residual articulation impairments (e.g., gliding or derhoticization of /r/, dentalization or lateralization of /s, z/, depalatalization or lateralization of palatals).
Of the 17 children with SSE, 16 parents provided information about the child’s history of speech-language therapy. Eight of these children were reported to have received articulation therapy at some point in the past or present, and two of these had targeted language goals (vocabulary, syntax) at some point. One was reported to have been diagnosed with verbal dyspraxia as a toddler. When asked to qualitatively describe early communication, five parents of SSE children reported the child to speak first words “late” (compared to four controls), and six were reported to begin forming sentences “late” (compared to five controls). Ten parents of SSE children reported reading and spelling were difficult for their child (compared to seven controls). Two children in each group were reported to have been diagnosed with ADD. None had a reported history of head trauma.
Group comparisons are presented in Table 1. Effect sizes of d<0.35 are observed for age, receptive vocabulary, oral language, and verbal IQ. Larger effect sizes were observed on some phonological awareness and reading measures. This finding of somewhat lower reading and phonological awareness performance in children with SSD is consistent with previous findings (e.g., Bird et al., 1995; Preston, 2010).
Table 1.
Descriptive and Inferential Statistics on Behavioral and fMRI tasks for 17 Typically Speaking Controls and 17 Children with Speech Sound Error (SSE)
| Variable | Control Group Mean (SD) |
SSE Group Mean (SD) |
t (df) | p-value | Effect Size (d) |
|---|---|---|---|---|---|
| Age (Yrs; mos) | 9;10 (7 mos) | 9;7 (9 mos) | 1.05 (32) | 0.303 | 0.35 |
| PPVT-III | 114 (11) | 113 (14) | 0.41 (32) | 0.684 | 0.14 |
| WJ Oral Expression | 117 (14) | 115 (15) | 0.27 (31) | 0.616 | 0.18 |
| WJ Listening Comprehension | 116 (13) | 113 (11) | 0.75 (31) | 0.56 | 0.21 |
| WASI Verbal IQ | 113 (12) | 113 (14) | 0.10 (32) | 0.911 | 0.04 |
| WASI Performance IQ | 103 (17) | 111 (17) | 1.07 (32) | 0.134 | 0.52 |
| TOWRE Phonemic Decoding | 104 (15) | 96 (11) | 1.86 (32) | 0.073 | 0.64 |
| TOWRE Sight Words | 104 (14) | 95 (12) | 1.8 (32) | 0.082 | 0.62 |
| WJ Word Attack | 105 (11) | 98 (9) | 2.0 (31) | 0.054 | 0.70 |
| WJ Letter-Word ID | 105 (14) | 99 (14) | 1.4 (31) | 0.176 | 0.48 |
| WJ Spelling | 104 (17) | 95 (18) | 1.4 (31) | 0.158 | 0.50 |
| CTOPP Elision | 11.4 (2.3) | 8.4 (2.6) | 3.5 (32) | 0.001 | 1.20 |
| CTOPP Blending Words | 11.4 (2.8) | 9.6 (3.0) | 1.85 (32) | 0.074 | 0.63 |
Notes: PPVT-III = Peabody Picture Vocabulary Test-III; WJ = Woodcock-Johnson Tests of Achievement; WASI = Wechsler Abbreviated Scales of Intelligence; TOWRE = Test of Word Reading Efficiency; CTOPP = Comprehensive Test of Phonological Processing.
One participant from the Control group did not complete the WJ tests because the parent reported very similar tests had just been administered through the school (hence, df=31); although the school had not administered the WJ, similar standardized tests revealed language and readings scores within the average range (commensurate with group means presented here).
fMRI procedures
Functional MRI data were acquired using a 1.5T Siemens scanner on a separate day from the behavioral testing. Participants were provided with a neck support, foam padding, and restraining band within the headcoil to stabilize the head. Prior to scanning, participants engaged in a practice session to familiarize them with the paradigm and procedures.
The fMRI task assessed functional activation in response to words and pseudowords presented visually or auditorily (see Frost et al., 2009, Preston et al., 2010 for additional examples of this paradigm). Trials were presented in a randomized fast event-related design with trial durations of 4–7 seconds (to provide sufficient jitter to deconvolve overlapping hemodynamic responses) with occasional longer “null” trials (to provide better baseline estimates). All conditions were represented in each run, and up to 10 runs were presented per participant. Functional runs began with a picture cue presented in the upper central portion of the display; this picture remained on the screen during presentation of spoken and printed monosyllabic word and pseudoword targets. Each picture remained on the screen during presentation of 7 or 8 targets (45–55 sec), after which it was replaced by another picture. For example, while a picture of a tent was on the screen, participants either heard or saw the correct word (TENT; a match) or they heard or saw a closely-related monosyllabic real word (e.g., TEST; a mismatch) or pseudoword that began with the same phoneme (e.g., TERT; a mismatch). Participants indicated via button press whether targets matched or mismatched the picture cue. Print stimuli were displayed in a box beneath the picture cue for 1000 msec and speech stimuli were presented through MR compatible headphones (mean duration of audio stimuli = 543 msec; S.D.=115.3).
All stimuli were 2–5 phonemes. Printed stimuli were 3–5 letters. There was no significant difference between auditory or visual words or pseudowords in phonotactic probabilities (positional frequency of each phoneme as well as biphone frequencies, all p’s >0.22, using phonotactic probabilities calculated from procedures described by Vitevich & Luce, 2004).
In 80% of the trials, the stimulus did not match the picture cue; that is, they were auditory or visual mismatches, and these were the trials of interest. The rare match trials were coded as separate conditions, and excluded from main analyses. The task was designed to elicit a high degree of accuracy and, as can be seen in Table 2, both groups made few errors in either condition (accuracy rates were 89% or better for both groups in both auditory and visual conditions). Moreover, the groups did not differ significantly in reaction time to either speech or print. Thus, differences in activation should not be driven by differences in task performance.
Table 2.
fMRI Task Performance for 17 Typically Speaking Controls and 17 Children with Speech Sound Error (SSE)
| Variable | Control Group Mean (SD) |
SSE Group Mean (SD) |
t (df) | p-value |
|---|---|---|---|---|
| A-prime | 0.94 (.04) | 0.93 (.05) | 0.31 (32) | 0.759 |
| Speech Accuracy Percent Correct | 0.90 (.06) | 0.89 (.06) | 0.59 (32) | 0.561 |
| Print Accuracy Percent Correct | 0.92 (.06) | 0.90 (.06) | 0.73 (32) | 0.470 |
| Reaction time – Speech (ms) | 1485 (249) | 1503 (198) | 0.24 (32) | 0.815 |
| Reaction time – Print (ms) | 1436 (283) | 1457 (209) | 0.24 (32) | 0.812 |
Twenty axial-oblique anatomic images were acquired, parallel to the intercommissural line based on sagittal localizer images. At these same 20 slice locations, activation images were acquired using single shot, gradient echo, echo planar acquisitions (FA (flip angle) 80 degrees; TE 50 ms; TR 2000 ms; FOV 20×20 cm; 6 mm slice thickness, no gap; 64×64×1 NEX; voxel resolution 3.125×3.125×6mm). High-resolution anatomical images were collected for 3D reconstruction. Images were sinc-interpolated to correct for slice acquisition time, motion- corrected with SPM-99 (Friston et al., 1995) and spatially smoothed with a 4.69-mm FWHM Gaussian filter. Images were excluded if they exceeded a tolerance of 2 mm displacement or 2° rotation from the first image in the functional series, or if they exceeded an image-to-image change of 1 mm displacement or 1° rotation. Regression-based estimation was used for the hemodynamic response at each voxel and for each condition, without prior specification of a reference function (Miezin et al., 2000). These parameters estimated the mean response for each condition from −3 to +15 s relative to stimulus onset, and individual activation maps were created to estimate the mean difference between a baseline (0–3 sec before onset) and an activation period (3–8 sec post-onset). Prior to across subjects analysis, participants’ data were transformed to 2 mm isotropic standardized reference space defined by the Montreal Neurological Institute (MNI) by mapping to the high resolution anatomic to the “Colin” brain, using linear and nonlinear registration parameters obtained with BioImage Suite (www.bioimagesuite.org; Papademetris et al., 2003).
The two groups were compared in four conditions in a repeated measures ANOVA: auditory words and pseudowords, and printed words and pseudowords. Planned contrasts from the ANOVA were used to compare groups for the main effect of auditory and print conditions (collapsed across words and pseudowords). The group-by-lexicality (real words vs. pseudowords) interactions were tested in both auditory and printed conditions using planned contrasts. A statistical threshold of p<0.01 (False Discovery Rate [FDR] corrected; Genovese, Lazar & Nichols, 2002), with a minimum cluster criteria of 10 contiguous voxels, was used to identify regions of significant differences in the perception of auditory and printed stimuli.
Results
Differences in auditory processing of speech
In several distributed (but potentially networked) regions, the mean activations for SSE and control groups was found to differ significantly when participants were engaged in a task requiring them to identify auditory tokens that did not match a picture cue. These differences involved both significantly greater activation by the SSE group relative to controls in some regions (SSE>Control) and significantly less activation by the SSE group relative to controls in other regions (SSE<Control), described in more detail below. Table 3 presents these regions of significant difference and associated p-values.
Table 3.
Regions showing differences between Typically Speaking Control group and Speech Sound Error group in response to spoken words and pseudowords.
| SSE > Controls | |||||
|---|---|---|---|---|---|
| Region | Volume (mm3) |
p-value (peak) |
MNI coordinates | ||
| X | Y | Z | |||
| Bilateral Inferior/Superior Parietal Lobule | 18264 | <0.0001 | −14 | −64 | 66 |
| Precuneus | 11936 | <0.0001 | −18 | −50 | 50 |
| R Supramarginal & Postcentral Gyrus | 4416 | 0.0003 | 54 | −34 | 40 |
| L Fusiform Gyrus | 3936 | 0.0001 | −51 | −60 | −17 |
| L Superior Temporal Gyrus | 3536 | <0.0001 | −66 | −28 | 12 |
| Posterior Cingulate | 3432 | 0.0009 | 0 | −68 | 9 |
| R Middle Frontal Gyrus | 2824 | 0.0001 | 32 | 54 | 28 |
| Cuneus | 2784 | <0.0001 | −2 | −90 | 16 |
| L Globus Pallidus | 2616 | 0.0002 | −10 | 6 | −8 |
| R Postcentral Gyrus | 2248 | 0.0001 | 30 | −26 | 38 |
| R Lingual Gyrus | 2200 | 0.0005 | 30 | −78 | −16 |
| Anterior Cingulate | 1200 | 0.0005 | 18 | 10 | 36 |
| R Superior Temporal Gyrus | 832 | 0.0004 | 51 | −36 | 10 |
| L Cerebellum | 736 | 0.0004 | −38 | −52 | −44 |
| R Temporal Pole | 656 | 0.001 | 42 | 14 | −40 |
| L Middle Frontal Gyrus | 568 | 0.0021 | −44 | 38 | 28 |
| R Superior Frontal Gyrus | 472 | 0.0004 | 10 | 4 | 72 |
| L Middle Occipital Gyrus | 448 | 0.0001 | −46 | −80 | 16 |
| L Insula | 424 | 0.002 | −34 | 10 | 6 |
| R Precentral Gyrus | 392 | 0.0031 | 54 | −2 | 24 |
| SSE<Controls | |||||
| R Orbital Gyrii | 1944 | 0.0001 | 14 | 40 | −22 |
| L Temporal Pole | 1160 | <0.0001 | −42 | 10 | −18 |
| L Orbital Gyrii | 608 | 0.0005 | −16 | 38 | −22 |
| R Inferior Temporal Gyrus | 408 | 0.0002 | 62 | −36 | −24 |
| L Middle Temporal Gyrus | 232 | 0.0025 | −56 | −30 | −4 |
Note: Only regions greater than 200 mm3 are reported.
Children with SSE exhibited greater activation than controls during the processing of auditory input in several regions, including left STG, left insula, and fusiform, as well as right supramarginal and postcentral gyrus. Several of these regions are associated with speech-motor processing and production (e.g., STG, insula). Figure 1 shows axial slices of selected regions in which the groups differed (where blue/purple represents greater activation for the SSE group). Figure 2 illustrates the group mean activation patterns for selected regions (left STG, insula); positive values represent a group mean increase in the blood oxygen level dependent (BOLD) signal following stimulus, whereas negative values represent a group mean decrease in BOLD. The specific pattern was for children with SSE to activate some of these dorsal regions and for the control group to show little or no activation when performing the same task.
Figure 1.

Axial slices of selected regions of interest in which the groups differed in processing auditory words and pseudowords.
Note. Activations are significant at <0.01, FDR corrected. Images are presented in radiological format with the right hemisphere displayed on the left side of the image. Numerals represent Z-axis mm values in MNI space. Blue/purple represents greater activation for the SSE group; yellow/red represents greater activation for the Control group. From top-to-bottom: bilateral superior/inferior parietal lobule and left precentral gyrus (+60); left superior temporal gyrus and cuneus (+14); left insula (+6); left globus pallidus and left middle temporal gyrus (−6); bilateral fusiform, right lingual gyrus, left temporal pole (−16).
Figure 2.

Barplots of BOLD response to auditorily presented words and pseudowords in selected regions of interest and in regions in which groups differed by lexicality
Note: Error bars represent 1 standard error
The SSE group was also observed to have significantly more activation than controls in several other regions in which the control group displayed a tendency to de-activate (reduce BOLD) in response to speech. These included bilateral superior and inferior parietal lobule, left globus pallidus (see Fig. 1) as well as anterior cingulate, and cuneus. However, the SSE group tended to activate these areas during the same task (see Fig. 2). Stated differently, these results suggest a pattern of task-induced deactivation in these regions within the control group when processing speech, which failed to occur in children with SSE.
Table 3 also reveals a small number of regions that were under-activated in the SSE group relative to the control group. These under-activated regions in the SSE group (shown as red/yellow in Fig. 1) included the left middle temporal gyrus (see Fig. 2 bar plot), left temporal pole and right inferior temporal gyrus. As previously mentioned, some of these regions play an important part of the ventral (lexical) speech processing system.
Finally, a group-by-lexicality interaction was explored to determine if the SSE and control groups differed in their response to spoken material as a function of stimulus type (words vs. pseudowords). At p<0.01, a significant interaction was found for only two regions: the left IFG/middle frontal gyrus and the left anterior fusiform gyrus/occipito-temporal sulcus. As can be seen in the rightmost barplots of Figure 2, the control group tended to engage these regions only during the auditory presentation of pseudowords (but not real words), whereas the SSE group displayed the opposite pattern, with activation in response to real words, but not to pseudowords.
Differences in print processing
In the print condition, no group-by-lexicality interactions were significant; consequently, group comparisons for print processing were collapsed across words and pseudowords. These group differences are reported in Table 4, and selected regions are displayed in Figure 3 (axial slices of selected regions) and Figure 4 (patterns of response activation). Children with SSE displayed significantly greater activation than controls (p<0.01, shown as blue/purple in Fig. 3) in response to printed stimuli mismatches in several regions, including left IFG, left globus pallidus, left superior temporal sulcus/middle temporal gyrus, right STG/superior temporal sulcus, and bilateral fusiform gyrus. In regions such as anterior cingulate and precuneus, de-activation was found in the control group, whereas no such de-activation occurred in the SSE group.
Table 4.
Regions showing differences between Typically Speaking Control group and Speech Sound Error group in response to printed words and pseudowords
| SSE > Controls | |||||
|---|---|---|---|---|---|
| Region | Volume (mm3) |
p-value (peak) |
MNI Coordinates | ||
| X | Y | Z | |||
| Precuneus | 25736 | <0.0001 | 10 | −58 | 54 |
| R Superior Temporal Gyrus/Superior Temporal Sulcus | 14872 | <0.0001 | 62 | −30 | 4 |
| Anterior Cingulate | 11144 | <0.0001 | 6 | 26 | 26 |
| L Fusiform Gyrus | 10064 | <0.0001 | −38 | −52 | −13 |
| Posterior Cingulate | 9808 | 0.0001 | 4 | −62 | 20 |
| L Middle/Superior Frontal Gyrii | 7624 | 0.0001 | 20 | 60 | 19 |
| L Superior Temporal Sulcus/Middle Temporal Gyrus | 4344 | 0.0002 | −42 | −66 | 22 |
| L Middle/Superior Frontal Gyrii | 2816 | 0.0002 | −28 | 40 | 46 |
| L Superior Parietal Lobule | 2624 | 0.0001 | −24 | −77 | 46 |
| R Fusiform Gyrus | 2560 | <0.0001 | 46 | −40 | −14 |
| R Middle Temporal Gyrus | 2064 | <0.0001 | 54 | −22 | −10 |
| L Globus Pallidus | 1576 | 0.0009 | −10 | −4 | −1 |
| L Superior Frontal Gyrus | 1384 | 0.0001 | 4 | 2 | 58 |
| R Anterior Inferior Parietal Sulcus | 1320 | 0.0005 | 44 | −24 | 28 |
| R Lingual Gyrus | 944 | 0.0006 | 14 | −76 | −8 |
| L Postcentral Gyrus | 848 | 0.0007 | −46 | −14 | 24 |
| L Inferior Frontal Gyrus | 808 | 0.0004 | −36 | 30 | −5 |
| R Precentral Gyrus | 744 | 0.001 | 60 | 4 | 10 |
| R Middle Frontal Gyrus | 744 | 0.0005 | 46 | 12 | 38 |
| L Middle Frontal Gyrus | 688 | 0.0002 | −42 | 46 | 6 |
| R Parahippocampal Gyrus | 408 | 0.0002 | 22 | −20 | −24 |
| R Superior Temporal Gyrus | 320 | 0.0003 | 68 | 0 | 0 |
| SSE<Controls | |||||
| L Superior Occipital Gyrus | 848 | <0.0001 | −14 | 104 | 4 |
| L Cerebellum | 312 | 0.0002 | −52 | −62 | −48 |
Note: Only regions greater than 200 mm3 are reported.
Figure 3.

Axial slices of selected regions of interest in which the groups differed in processing printed words and pseudowords.
Note. Activations are significant at <0.01, FDR corrected. Images are presented in radiological format with the right hemisphere displayed on the left side of the image. Numerals represent Z-axis mm values in MNI space. Blue/purple represents greater activation for the SSE group; yellow/red represents greater activation for the Control group. From top to bottom: anterior cingulate (+22), right superior temporal gyrus/superior temporal sulcus (+6), bilateral fusiform (−16).
Figure 4.
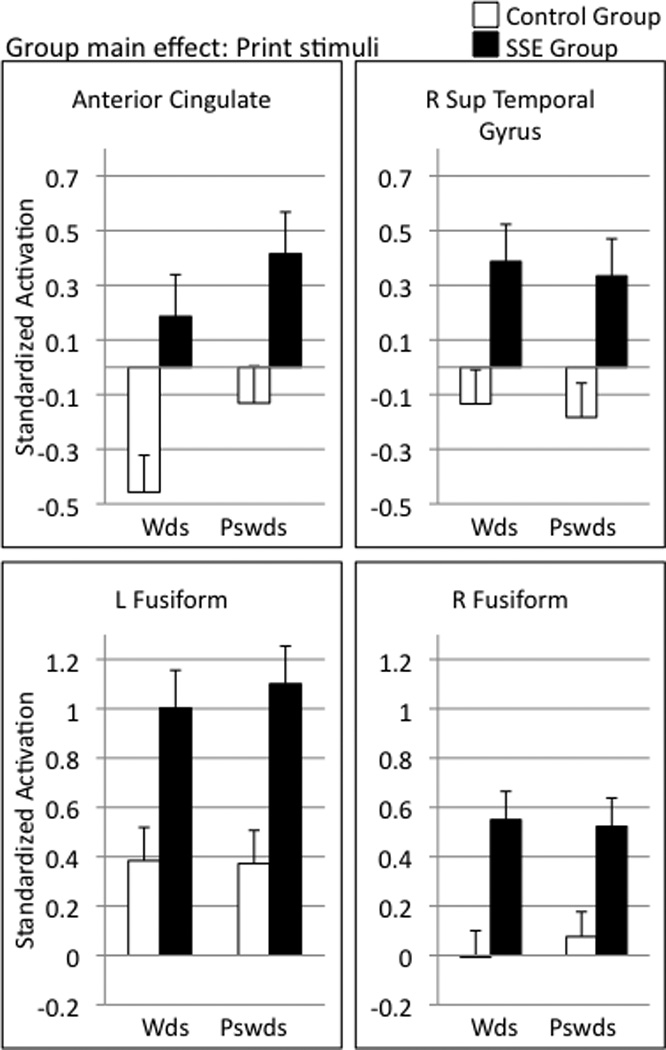
Barplots of BOLD response to printed words and pseudowords in selected regions of interest.
Note: Error bars represent 1 standard error
Discussion
The present study provides an initial account of how children with SSE and normal-range language skills differ from well-matched children with typical speech articulation in their neural processing of spoken and printed language in tasks not involving overt pronunciation. The fMRI task required children to identify (by a button press) whether a spoken or a printed word or nonword stimulus matched a picture target. A number of regions in both cortices and in subcortical areas were identified that met our statistical threshold for distinguishing the two groups during this task. Taken together, these results provide a neurobiological complement to prior behavioral studies revealing differences in speech perception and reading in school-age children with SSE (Bird, et al., 1995; Cohen & Diehl, 1963; Larivee & Catts, 1999).
Differences in speech processing
To provide a framework for the presentation and interpretation of our complex findings we refer, in part, to Hickok and Poeppel’s dual route model of single word processing (previously described). Although it does not explain all of the findings, it is used as an organizational heuristic. For example, greater engagement for the SSE group was observed in several potentially networked dorsal regions that Hickok and Poeppel describe as important for the acquisition of new auditory-motor representations and/or processing novel, complex, or low-frequency speech input. In addition, less activation was observed for the SSE group relative to controls in some ventral regions that may participate in auditory-lexical mapping, such as the left middle temporal gyrus (though the opposite pattern was observed in the fusiform gyrus). Beyond this model, our data also suggest that children with SSE show increased attention and/or failure to show the typical patterns of task-induced deactivation when presented with linguistic input. Note that these components need not be viewed as functioning independently.
Dorsal articulatory-phonetic perception regions
Relative to control subjects, children with SSE displayed a pattern of greater engagement of the left STG networks when processing spoken speech. These networks may be recruited when speech processing demands are high (e.g., when articulatory rehearsal is needed, see Hickok & Poeppel, 2004). The region in left STG is close (though slightly posterior) to the sensori-motor interface in the posterior temporal-parietal junction described by Hickok and colleagues (Hickok, Okada, & Serences, 2009; Hickok & Poeppel, 2007). We also observed greater engagement by children with SSE of right supramarginal and post-central gyrus, which has been observed to be related to perception of acoustic-phonetic information (Caplan, Gow & Makris, 1995; Guenther et al., 2004). The left insula was also engaged to a greater extent in children with SSE than in controls. The left insula is known to be important for speech production, as well as for the processing of phonological information (Hillis, et al., 2004; Wise, Greene, Buchel, & Scott, 1999).
One possible explanation for these findings may be that the children with SSE tended to process most spoken forms as unfamiliar or challenging phonological forms, thus requiring more recruitment of dorsal articulatory-motor regions. In these children, mapping from auditory input to a phonological representation may be weak. Alternatively, it is possible that the SSE children were relying on these regions to a greater extent than control children to compensate for ventral systems that are developing differently (see below). Both explanations, which are not mutually exclusive, suggest that the SSE group may have auditory perceptual systems that rely on articulatory/motor coding (with or without actual subvocalization) when confronted with tasks requiring phonological processing. This hypothesis is supported by studies of individuals learning the phonetic contrasts of new languages, a task that is likely to tax the dorsal system. In one study, for example,Callan et al. (2004) found that several of the regions identified in the present study (i.e., insula, STG) were also highly activated in second language learners who were attempting to master new phonetic productions.
A group-by-lexicality interaction was observed in the left inferior frontal/middle frontal gyrus; children with SSE engaged these regions when processing real words but not pseudowords, whereas the opposite pattern was observed in the control group (Fig. 2). The responses from the control group are consistent with the notion that IFG activation is observed primarily when the phonological demands of the task are high and/or novel. Children with SSE, on the other hand, demonstrated heightened activation of this region to process real words, suggesting that, for them, even real words require more articulatory-phonetic encoding. Thus, when presented with real words, the response pattern in the IFG may reflect evidence that the phonological systems of children with SSE do not deal efficiently with the phonological properties of spoken lexical information (as supported by differences in the ventral system, see below). Moreover, in response to pseudowords, children with SSE did not engage IFG but control children did (Fig. 2). These perceptual findings may support data fromTkach et al. (2011), who reported greater-engagement of left IFG by typically speaking adolescents relative to children with SSE when repeating pseudowords. Therefore, the IFG may not be properly recruited by individuals with SSE when processing novel phonetic forms.
Ventral perception circuit
The left middle temporal and inferior temporal gyri were regions where children with SSE showed significantly less activation than controls. These temporal regions have been described as being involved in directly and efficiently connecting acoustic and lexical information (Hickok & Poeppel, 2004; Szaflarski et al., 2006; Poeppel, et al., 2008). Reduced engagement of these ventral regions could indicate less efficient acoustic-to-lexical processing for children with SSE within this circuit. That is, the SSE group appears to over-engage the less efficient dorsal articulatory motor mapping regions and under-engage some of the (potentially more efficient) auditory-lexical regions when listening to spoken words and pseudowords.
The left fusiform gyrus, which has been described as part of the semantic processing network (e.g., Poeppel et al., 2004; Vigneau et al., 2006) was found to be engaged to a greater extent in the SSE group relative to controls. Thus, not all regions of the ventral circuit were observed to be under-engaged. However, in typically developing individuals, reduced fusiform activation during auditory tasks is observed with increasing age (Church et al., 2008), suggesting maturational influences. Based on this developmental perspective, it is possible that the SSE group’s greater fusiform activation is due to a less “mature” perceptual system.
Attention/Task-induced deactivation
Task-induced deactivation is a phenomenon observed in many neuroimaging studies that is presumed to reflect a reallocation of resources from “resting state” to task-engagement (here, attending to spoken or printed stimuli) (Fox & Raichle, 2007; McKiernan, Kaufman, Kucera-Thompson, & Binder, 2003; Raichle & Snyder, 2007). The circuitry involved in task-induced deactivation is broadly distributed and overlaps with regions related to cognitive processes of selective attention and orientation to stimuli (Behrmann, Geng & Shomstein, 2004; Fan, McCandliss, Fossella, Flombaum, & Posner, 2005). In the present study, children in the SSE group displayed a marked pattern in which there was greater activation than controls in multiple regions within this broad orienting network when processing speech and print. The general pattern was for reduced bloodflow for the control group when processing speech (but for no such reduction in the SSE group) in several regions including inferior and superior parietal lobules, anterior cingulate, precuneus, cuneus, and middle frontal gyrus. Although alternative explanations for this observation are possible, one plausible “cognitively-based” interpretation is that children with SSE are “working harder” than control subjects to pick up sensitive phonological cues in both modalities. Returning to Shriberg’s concept of phonological attunement (cf. Shriberg, 1994; Shriberg, et al., 2005), the present results may indicate that school-aged children with SSE (but normal language) must expend more neural/cognitive effort to achieve the same result as typically-speaking children on perception-based tasks that require them to pay close attention to phonetic details in their environment.
Differences in print processing
As observed in prior studies, the children with SSE were, on average, somewhat below controls on behavioral measures of reading, spelling and phonological awareness (Table 1). The patterns of functional activation in response to printed words and pseuodowords was therefore studied to understand the neural characteristics of the differences in the phonological bases of literacy. As was found with spoken language, children with SSE displayed several differences in processing printed mismatches (both real words and pseudowords) when compared with their typically-speaking peers. In response to printed words and pseudowords, children with SSE showed greater activation than controls in several regions, including left IFG (a region associated with articulatory encoding during reading), left globus pallidus (a region that also differed between groups in response to speech), and right STG. Right hemisphere compensation has been observed in fMRI studies of children with reading disability (although more commonly in IFG and temporal-parietal regions; for a review see Sandak, Mencl, Frost, & Pugh, 2004), and this pattern may reflect failure to consolidate a left hemisphere-dominant circuit.
Additionally, the SSE group had significantly greater activation in both left and right fusiform gyrus. The control group, on average, did not activate the right fusiform gyrus when processing the printed stimuli, suggesting a pattern of left lateralization and perhaps a more mature neural response pattern to print in this region (Turkeltaub, Gareau, Flowers, Zeffiro, & Eden, 2003). In contrast, the children with SSE engaged the fusiform bilaterally, reflecting perhaps a reading system that is not left-hemisphere dominant. Studies of children with reading disability often implicate the fusiform gyrus, although the canonical pattern is for poor readers to show less engagement of this region than typical readers (Hoeft, et al., 2007; Pugh, et al., 2008). Thus, the fusiform gyrus may play a critical role in the speech and print processing differences in children with SSE, although these children do not show the same neural signatures in the fusiform as reading disabled children.
Children with SSE also showed significantly greater activation than their typically speaking peers in anterior cingulate; the control group was observed to show some deactivation of this region when processing printed words, and neither activation nor deactivation when processing pseudowords. Similar differences were observed in response to speech in this region.Carter et al. (1998) found that this region activates during conditions when errors are likely to occur; therefore, we speculate that greater activation may indicate that children with SSE (implicitly) recognize reading and processing spoken language as a task in which errors may be more likely to happen.
Caveats and Future Directions
Because this is one of the first studies to examine neural processing differences between children with and without persistent SSE, the results must be considered preliminary. Clearly, prospective replication is needed to determine if the regions identified here will continue to be the most robust indicators of perceptual differences in children with SSE when a different sample is assessed. Indeed, different neural profiles may emerge depending on how subtypes (and control groups) are defined and the imaging tasks that are used. The fMRI task that was completed in this study - a perceptual judgment task - could be complemented by production tasks (cf. Tkach et al., 2011). Longitudinal investigation of changes in neural response under different treatment conditions might help us to better understand differences in the neurobiology of children with SSE; for example, prior research has demonstrated that perceptual training may improve speech perception and production (e.g., Rvachew, Nowak & Cloutier, 2004), and reasonable predictions can be made about regions that might respond to perceptual training (Guenther et al., 2004). Finally, differences in brain structure and connectivity among regions/networks may improve our understanding of the neural profiles of children with SSE.
The group differences in print processing did not directly mirror the differences identified in speech processing. The extent to which reading and listening rely on the same brain regions depends on reading skill, such that better readers show greater neural integration across listening and speaking modalities (Shankweiler et al., 2008). The present study used controls matched on IQ, age, and oral language skills, but this procedure also resulted in moderate but significant group differences in some phonological and reading skills. Future studies might be designed to compare children with SSE to reading-matched controls. This would enable a more direct assessment of potential similarities and differences in the neural circuitry of children who are similar in reading performance, but differ in only speech production abilities.
Summary and Implications
School-age children with SSE were found to differ from typically speaking controls in their neural responses to spoken and printed words and nonwords. Compared with control subjects, activation differences in speech perception found among children with SSE were hypothesized to reflect over-engagement of a dorsal (motor) speech perception system, under-engagement of a ventral (lexical) speech perception system, and a failure to show the typical task-induced deactivation patterns. The results of this study may be viewed in some ways as confirmatory: that is, several regions canonically associated with speech processing (based on many years of study of normal processes and acquired pathologies in adults) were found to differ from controls in the children with SSE. Further specifying the neural differences in childhood SSE (with respect to brain function, structure, and connectivity) should have important implications for informing neuro-behavioral models of speech development and articulatory impairments. Moreover, continued work in the neurobiological bases of SSE may help to provide foci for neuro-genetic studies of speech development and disorders (Peterson et al., 2007), and may help to further define developmental trajectories of speech perception and production in children with SSE.
ACKNOWLEDGMENTS
Funding support provided by National Institutes of Health grants awarded to Haskins Laboratories (T32HD7548 and 5P01HD001994, C. Fowler, PI) and to Yale University (5R01HD048830, K. Pugh, PI). Thanks to research assistants Anish Kurian, Eleanor Tejada, Heatherly Carlson, and Angie Goen.
References
- Alcock KJ, Passingham RE, Watkins KE, Vargha-Khadem F. Oral dyspraxia in inherited speech and language impairment and acquired dysphasia. Brain & Language. 2000;75(1):17–33. doi: 10.1006/brln.2000.2322. [DOI] [PubMed] [Google Scholar]
- Behrmann M, Geng JJ, Shomstein S. Parietal cortex and attention. Current Opinion in Neurobiology. 2004;14(2):212–217. doi: 10.1016/j.conb.2004.03.012. [DOI] [PubMed] [Google Scholar]
- Belton E, Salmond CH, Watkins KE, Vargha-Khadem F, Gadian DG. Bilateral brain abnormalities associated with dominantly inherited verbal and orofacial dyspraxia. Human Brain Mapping. 2003;18:194–200. doi: 10.1002/hbm.10093. [DOI] [PMC free article] [PubMed] [Google Scholar]
- Binder JR, Frost JA, Hammeke TA, Cox RW, Rao SM, Prieto T. Human brain language areas identified by functional magnetic resonance imaging. Journal of Neuroscience. 1997;17(1):353–362. doi: 10.1523/JNEUROSCI.17-01-00353.1997. [DOI] [PMC free article] [PubMed] [Google Scholar]
- Bird J, Bishop DVM. Perception and awareness of phonemes in phonologically impaired children. European Journal of Disorders of Communication. 1992;27:289–311. doi: 10.3109/13682829209012042. [DOI] [PubMed] [Google Scholar]
- Bird J, Bishop DVM, Freeman NH. Phonological awareness and literacy development in children with expressive phonological impairments. Journal of Speech and Hearing Research. 1995;38:446–462. doi: 10.1044/jshr.3802.446. [DOI] [PubMed] [Google Scholar]
- Booth JR, Burman DD, Van Santen FW, Harasaki Y, Gitelman DR, Parrish TB, Marsel Mesulam MM. The development of specialized brain systems in reading and oral-language. Child Neuropsychology. 2001;7(3):119–141. doi: 10.1076/chin.7.3.119.8740. [DOI] [PubMed] [Google Scholar]
- Booth JR, Wood L, Lu D, Houk JC, Bitan T. The role of the basal ganglia and cerebellum in language processing. Brain Research. 2007;1133:136–144. doi: 10.1016/j.brainres.2006.11.074. [DOI] [PMC free article] [PubMed] [Google Scholar]
- Buchsbaum BR, Hickok G, Humpries C. Role of left posterior superior temporal gyrus in phonological processing for speech perception and production. Cognitive Science. 2001;25(5):663–678. [Google Scholar]
- Caplan D, Gow D, Makris N. Analysis of lesions by MRI in stroke patients with acoustic-phonetic processing deficits. Neurology. 1995;45:293–298. doi: 10.1212/wnl.45.2.293. [DOI] [PubMed] [Google Scholar]
- Callan DE, Jones HA, Callan AM, Akahane-Yamada R. Phonetic perceptual identification by native- and second-language speakers differentially activates brain regions involved with acoustic phonetic processing and those involved with articulatory-auditory/orosensory internal models. NeuroImage. 2004;22(3):1182–1194. doi: 10.1016/j.neuroimage.2004.03.006. [DOI] [PubMed] [Google Scholar]
- Carter CS, Braver TS, Barch DM, Botvinick MM, Noll D, Cohen JD. Anterior cingulate cortex, error detection, and the online monitoring of performance. Science. 1998;280(5364):747–749. doi: 10.1126/science.280.5364.747. [DOI] [PubMed] [Google Scholar]
- Church JA, Coalson RS, Lugar HM, Petersen SE, Schlaggar BL. A developmental fMRI study of reading and repetition reveals changes in phonological and visual mechanisms over age. Cerebral Cortex. 2008;18(9):2054–2065. doi: 10.1093/cercor/bhm228. [DOI] [PMC free article] [PubMed] [Google Scholar]
- Cohen JH, Diehl CF. Relation of speech-sound discrimination ability to articulation-type speech defects. Journal of Speech and Hearing Disorders. 1963;28(2):187–190. doi: 10.1044/jshd.2802.187. [DOI] [PubMed] [Google Scholar]
- Constable RT, Pugh KR, Berroya E, Mencl WE, Westerveld M, Ni W, Shankweiler D. Sentence complexity and input modality effects in sentence comprehension: an fMRI study. NeuroImage. 2004;22(1):11–21. doi: 10.1016/j.neuroimage.2004.01.001. [DOI] [PubMed] [Google Scholar]
- Dunn LM, Dunn LM. Peabody Picture Vocabulary Test. 3rd ed. Circle Pines, MN: AGS; 1997. [Google Scholar]
- Fan J, McCandliss BD, Fossella J, Flombaum JI, Posner MI. The activation of attentional networks. NeuroImage. 2005;26(2):471–479. doi: 10.1016/j.neuroimage.2005.02.004. [DOI] [PubMed] [Google Scholar]
- Fox MD, Raichle ME. Spontaneous fluctuations in brain activity observed with functional magnetic resonance imaging. Nature Reviews Neuroscience. 2007;8(9):700–711. doi: 10.1038/nrn2201. [DOI] [PubMed] [Google Scholar]
- Friston KJ, Ashburner J, Frith CD, Poline J-B, Heather JD, Frackowiak RSJ. Spatial registration and normalization of images. Human Brain Mapping. 1995;2:165–189. [Google Scholar]
- Frost SJ, Landi N, Mencl WE, Sandak R, Fulbright RK, Tejada ET, Jacobsen L, Grigorenko E, Constable RT, Pugh KR. Phonological awareness predicts activation patterns for print and speech. Annals of Dyslexia. 2009;59:78–97. doi: 10.1007/s11881-009-0024-y. [DOI] [PMC free article] [PubMed] [Google Scholar]
- Genovese CR, Lazar NA, Nichols T. Thresholding of statistical maps in functional neuroimaging using the false discovery rate. NeuroImage. 2002;15:870–878. doi: 10.1006/nimg.2001.1037. [DOI] [PubMed] [Google Scholar]
- Guenther FH, Nieto-Castanon A, Ghosh SS, Tourville JA. Representation of sound categories in auditory cortical maps. Journal of Speech, Language & Hearing Research. 2004;47(1):46–57. doi: 10.1044/1092-4388(2004/005). [DOI] [PubMed] [Google Scholar]
- Guenther FH. Cortical interactions underlying the production of speech sounds. Journal of Communication Disorders. 2006;39(5):350–365. doi: 10.1016/j.jcomdis.2006.06.013. [DOI] [PubMed] [Google Scholar]
- Hickok G, Okada K, Serences JT. Area Spt in the human planum temporale supports sensory-motor integration for speech processing. Journal of Neurophysiology. 2009;101:2725–2732. doi: 10.1152/jn.91099.2008. [DOI] [PubMed] [Google Scholar]
- Hickok G, Poeppel D. Dorsal and ventral streams: a framework for understanding aspects of the functional anatomy of language. Cognition. 2004;92(1–2):67–99. doi: 10.1016/j.cognition.2003.10.011. [DOI] [PubMed] [Google Scholar]
- Hickok G, Poeppel D. The cortical organization of speech processing. Nature Reviews Neuroscience. 2007;8(5):393–402. doi: 10.1038/nrn2113. [DOI] [PubMed] [Google Scholar]
- Hillis AE, Work M, Barker PB, Jacobs MA, Breese EL, Maurer K. Re-examining the brain regions crucial for orchestrating speech articulation. Brain. 2004;127(7):1479–1487. doi: 10.1093/brain/awh172. [DOI] [PubMed] [Google Scholar]
- Hoeft F, Meyler A, Hernandez A, Juel C, Taylor-Hill H, Martindale JL, et al. Functional and morphometric brain dissociation between dyslexia and reading ability. Proceedings of the National Academy of Sciences. 2007;104(10):4234–4239. doi: 10.1073/pnas.0609399104. [DOI] [PMC free article] [PubMed] [Google Scholar]
- Larivee LS, Catts HW. Early reading achievement in children with expressive phonological disorders. American Journal of Speech-Language Pathology. 1999;8:118–128. [Google Scholar]
- Leitao S, Hogben J, Fletcher J. Phonological processing skills in speech and language impaired children. European Journal of Disorders of Communication. 1997;32:91–111. doi: 10.1111/j.1460-6984.1997.tb01626.x. [DOI] [PubMed] [Google Scholar]
- Lewis BA. Genetic and neuroimaging research in childhood apraxia of speech. Paper presented at the American Speech-Language-Hearing Association Annual Convention. 2008 [Google Scholar]
- Lewis BA, Freebairn L. Residual effects of preschool phonology disorders in grade school, adolescence, and adulthood. Journal of Speech and Hearing Research. 1992;35:819–831. doi: 10.1044/jshr.3504.819. [DOI] [PubMed] [Google Scholar]
- Lewis BA, Freebairn LA, Taylor H. Correlates of spelling abilities in children with early speech sound disorders. Reading and Writing. 2002;15(3–4):389–407. [Google Scholar]
- Liegeois F, Baldeweg T, Connelly A, Gadian DG, Mishkin M, Vargha-Khadem F. Language fMRI abnormalities associated with FOXP2 gene mutation. Nature Neuroscience. 2003;6(11):1230–1237. doi: 10.1038/nn1138. [DOI] [PubMed] [Google Scholar]
- Lou HC, Henriksen L, Bruhn P. Focal cerebral hypoperfusion in children with dysphasia and/or attention deficit disorder. Archives of Neurology. 1984;41(8):825–829. doi: 10.1001/archneur.1984.04050190031010. [DOI] [PubMed] [Google Scholar]
- Lukatela G, Eaton T, Sabadini L, Turvey MT. Vowel duration affects visual word identification: Evidence that mediating phonology is phonetically informed. Journal of Experimental Psychology / Human Perception & Performance. 2004;30(1):151–162. doi: 10.1037/0096-1523.30.1.151. [DOI] [PubMed] [Google Scholar]
- Madison CL, Fucci DJ. Speech-sound discrimination and tactile-kinesthetic discrimination in reference to speech production. Perceptual and Motor Skills. 1971;33:831–838. doi: 10.2466/pms.1971.33.3.831. [DOI] [PubMed] [Google Scholar]
- Majerus S, Van der Linden M, Collette F, Laureys S, Poncelet M, Degueldre C, et al. Modulation of brain activity during phonological familiarization. Brain and Language. 2005;92(3):320–331. doi: 10.1016/j.bandl.2004.07.003. [DOI] [PubMed] [Google Scholar]
- McKiernan KA, Kaufman JN, Kucera-Thompson J, Binder JR. A parametric manipulation of factors affecting task-induced deactivation in functional neuroimaging. Journal of Cognitive Neuroscience. 2003;15(3):394–408. doi: 10.1162/089892903321593117. [DOI] [PubMed] [Google Scholar]
- Miezin FM, Maccotta L, Ollinger JM, Petersen SE, Buckner RL. Characterizing the hemodynamic response: Effects of presentation rate, sampling procedure, and the possibility of ordering brain activity based on relative timing. NeuroImage. 2000;11:735–759. doi: 10.1006/nimg.2000.0568. [DOI] [PubMed] [Google Scholar]
- Nathan L, Stackhouse J, Goulandris N, Snowling MJ. The development of early literacy skills among children with speech difficulties: A test of the "critical age hypothesis". Journal of Speech, Language, and Hearing Research. 2004;47:377–391. doi: 10.1044/1092-4388(2004/031). [DOI] [PubMed] [Google Scholar]
- Papademetris X, Jackowski AP, Schultz RT, Staib LH, Duncan JS. Computing 3D nonrigid brain registrations using extended robust point matching for composite multisubject fMRI analysis. In: Ellis RE, Peters TM, editors. Medical image computing and computer assisted intervention. Berlin: Springer-Verlag; 2003. pp. 788–795. [Google Scholar]
- Peterson RL, McGrath LM, Smith SD, Pennington BF. Neuropsychology and genetics of speech, language, and literacy disorders. Pediatric Clinics of North America. 2007;54(3):543–561. doi: 10.1016/j.pcl.2007.02.009. [DOI] [PubMed] [Google Scholar]
- Peterson RL, Pennington BF, Shriberg LD, Boada R. What influences literacy outcome in children with speech sound disorder? Journal of Speech, Language & Hearing Research. 2009;52(5):1175–1188. doi: 10.1044/1092-4388(2009/08-0024). [DOI] [PMC free article] [PubMed] [Google Scholar]
- Poeppel D, Guillemin A, Thompson J, Fritz J, Bavelier D, Braun AR. Auditory lexical decision, categorical perception, and FM direction discrimination differentially engage left and right auditory cortex. Neuropsychologia. 2004;42(2):183–200. doi: 10.1016/j.neuropsychologia.2003.07.010. [DOI] [PubMed] [Google Scholar]
- Poeppel D, Idsardi WJ, van Wassenhove V. Speech perception at the interface of neurobiology and linguistics. Philosophical Transactions of the Royal Society B: Biological Sciences. 2008;363(1493):1071–1086. doi: 10.1098/rstb.2007.2160. [DOI] [PMC free article] [PubMed] [Google Scholar]
- Preston JL, Edwards ML. Phonological processing skills of adolescents with residual speech sound errors. Language, Speech & Hearing Services in Schools. 2007;38:297–308. doi: 10.1044/0161-1461(2007/032). [DOI] [PubMed] [Google Scholar]
- Preston JL. Speech and literacy: The connection and the relevance to clinical populations. In: Harrison AE, editor. Speech disorders: Causes, treatments, and social effects. Nova Science Publishers, Inc.; 2010. pp. 43–73. [Google Scholar]
- Preston JL, Frost SJ, Mencl WE, Fulbright RK, Landi N, Grigorenko E, Jacobsen L, Pugh KR. Early and late talkers: school-age language, literacy and neurolinguistic differences. Brain. 2010;133(8):2185–2195. doi: 10.1093/brain/awq163. [DOI] [PMC free article] [PubMed] [Google Scholar]
- Pugh KR, Frost SJ, Sandak R, Landi N, Rueckl JG, Constable RT, Seidenberg MS, Fulbright RK, Katz L, Mencl WE. Effects of stimulus difficulty and repetition on printed word identification: An fMRI comparison of nonimpaired and reading-disabled adolescent cohorts. Journal of Cognitive Neuroscience. 2008;20(7):1146–1160. doi: 10.1162/jocn.2008.20079. [DOI] [PMC free article] [PubMed] [Google Scholar]
- Raichle ME, Snyder AZ. A default mode of brain function: A brief history of an evolving idea. NeuroImage. 2007;37(4):1083–1090. doi: 10.1016/j.neuroimage.2007.02.041. [DOI] [PubMed] [Google Scholar]
- Raitano NA, Pennington BF, Tunick RA, Boada R, Shriberg LD. Pre-literacy skills of subgroups of children with speech sound disorders. Journal of Child Psychology and Psychiatry. 2004;45(4):821–835. doi: 10.1111/j.1469-7610.2004.00275.x. [DOI] [PubMed] [Google Scholar]
- Rvachew S, Grawburg M. Correlates of phonological awareness in preschoolers with speech sound disorders. Journal of Speech, Language, & Hearing Research. 2006;49(1):74–87. doi: 10.1044/1092-4388(2006/006). [DOI] [PubMed] [Google Scholar]
- Rvachew S, Nowak M, Cloutier G. Effect of phonemic perception training on the speech production and phonological awareness skills of children with expressive phonological delay. American Journal of Speech-Language Pathology. 2004;13(3):250–263. doi: 10.1044/1058-0360(2004/026). [DOI] [PubMed] [Google Scholar]
- Shankweiler D, Mencl WE, Braze D, Tabor W, Pugh KR, Fulbright RK. Reading differences and brain: Cortical integration of speech and print in sentence processing varies with reader skill. Developmental Neuropsychology. 2008;33(6):745–775. doi: 10.1080/87565640802418688. [DOI] [PubMed] [Google Scholar]
- Shiller DM, Rvachew S, Brosseau-Lapré F. Importance of the auditory perceptual target to the achievement of speech production accuracy. Canadian Journal of Speech-Language Pathology and Audiology. 2010;34(3):181–192. [Google Scholar]
- Shriberg LD. Five subtypes of developmental phonological disorders. Clinics in Communication Disorders. 1994;4(1):38–53. [PubMed] [Google Scholar]
- Shriberg LD, Austin D, Lewis BA, McSweeny JL, Wilson DL. The percentage of consonants correct (PCC) metric: Extensions and reliability data. Journal of Speech, Language, and Hearing Research. 1997;40:708–722. doi: 10.1044/jslhr.4004.708. [DOI] [PubMed] [Google Scholar]
- Shriberg LD, Lewis BA, Tomblin JB, McSweeny JL, Karlsson HB, Scheer AR. Toward diagnostic and phenotype markers for genetically transmitted speech delay. Journal of Speech, Language, & Hearing Research. 2005;48(4):834–852. doi: 10.1044/1092-4388(2005/058). [DOI] [PubMed] [Google Scholar]
- Shriberg LD, Tomblin JB, McSweeny JL. Prevalence of speech delay in 6-year-old children and comorbidity with language impairment. Journal of Speech, Language, and Hearing Research. 1999;42(6):1461–1481. doi: 10.1044/jslhr.4206.1461. [DOI] [PubMed] [Google Scholar]
- Shuster LI. The perception of correctly and incorrectly produced /r/ Journal of Speech, Language, and Hearing Research. 1998;41:941–950. doi: 10.1044/jslhr.4104.941. [DOI] [PubMed] [Google Scholar]
- Silverman FH, Paulus PG. Peer reactions to teenagers who substitute /W/ for /R/ Language, Speech, and Hearing Services in Schools. 1989;20:219–221. [Google Scholar]
- Szaflarski JP, Schmithorst VJ, Altaye M, Byars AW, Ret J, Plante E, et al. A longitudinal functional magnetic resonance imaging study of language development in children 5 to 11 years old. Annals of Neurology. 2006;59(5):796–807. doi: 10.1002/ana.20817. [DOI] [PMC free article] [PubMed] [Google Scholar]
- Tkach JA, Chen X, Freebairn LA, Schmithorst VJ, Holland SK, Lewis BA. Neural correlates of phonological processing in speech sound disorder: A functional magnetic resonance imaging study. Brain and Language. 2011;119(1):42–49. doi: 10.1016/j.bandl.2011.02.002. [DOI] [PMC free article] [PubMed] [Google Scholar]
- Turkeltaub PE, Gareau L, Flowers DL, Zeffiro TA, Eden GF. Development of neural mechanisms for reading. Nature Neuroscience. 2003;6(7):767–773. doi: 10.1038/nn1065. [DOI] [PubMed] [Google Scholar]
- Vigneau M, Beaucousin V, Hervé PY, Duffau H, Crivello F, Houdé O, et al. Meta-analyzing left hemisphere language areas: Phonology, semantics, and sentence processing. NeuroImage. 2006;30(4):1414–1432. doi: 10.1016/j.neuroimage.2005.11.002. [DOI] [PubMed] [Google Scholar]
- Vitevitch M, Luce P. A Web-based interface to calculate phonotactic probability for words and nonwords in English. Behavior Research Methods. 2004;36(3):481–487. doi: 10.3758/bf03195594. [DOI] [PMC free article] [PubMed] [Google Scholar]
- Wagner RK, Torgesen JK, Rashotte CA. Comprehensive Test of Phonological Processing. Austin, TX: Pro-Ed, Inc.; 1999. [Google Scholar]
- Watkins KE, Vargha-Khadem F, Ashburner J, Passingham RE, Connelly A, Friston KJ, Frackowiak RSJ, Mishkin M, Gadian DG. MRI analysis of an inherited speech and language disorder: structural brain abnormalities. Brain. 2002;125(3):465–478. doi: 10.1093/brain/awf057. [DOI] [PubMed] [Google Scholar]
- Wechsler D. Wechsler Abbreviated Scale of Intelligence. San Antonio: Harcourt Assessment; 1999. [Google Scholar]
- Whalen DH, Benson RR, Richardson M, Swainson B, Clark VP, Lai S, et al. Differentiation of speech and nonspeech processing within primary auditory cortex. The Journal of the Acoustical Society of America. 2006;119(1):575–581. doi: 10.1121/1.2139627. [DOI] [PubMed] [Google Scholar]
- Wise RJ, Greene J, Buchel C, Scott SK. Brain regions involved in articulation. Lancet. 1999;353(9158):1057–1061. doi: 10.1016/s0140-6736(98)07491-1. [DOI] [PubMed] [Google Scholar]
- Woodcock RW, McGrew KS, Mather N. Woodcock-Johnson Test of Achievement. (III ed.) Itasca, IL: Riverside Publishing; 2001. [Google Scholar]