Abstract
Photosystem (PS) II is the multisubunit complex which uses light energy to split water, providing the reducing equivalents needed for photosynthesis. The complex is susceptible to damage from environmental stresses such as excess excitation energy and high temperature. This research investigated the in vivo photosynthetic consequences of impairments to PSII in Arabidopsis thaliana (ecotype Columbia) expressing an antisense construct to the PsbO proteins of PSII. Transgenic lines were obtained with between 25 and 60% of wild-type (WT) total PsbO protein content, with the PsbO1 isoform being more strongly reduced than PsbO2. These changes coincided with a decrease in functional PSII content. Low PsbO (less than 50% WT) plants grew more slowly and had lower chlorophyll content per leaf area. There was no change in content per unit area of cytochrome b6f, ATP synthase, or Rubisco, whereas PSI decreased in proportion to the reduction in chlorophyll content. The irradiance response of photosynthetic oxygen evolution showed that low PsbO plants had a reduced quantum yield, but matched the oxygen evolution rates of WT plants at saturating irradiance. It is suggested that these plants had a smaller pool of PSII centres, which are inefficiently connected to antenna pigments resulting in reduced photochemical efficiency.
Key words: Arabidopsis, chlorophyll fluorescence, oxygen evolution, photosynthesis, photosystem II, PsbO.
Introduction
Primary carbon fixation in plants requires the coordination of the photosynthetic carbon reduction (PCR) cycle and the light-dependent thylakoid reactions, with each process featuring a number of enzymatic steps (Kramer and Evans, 2011). The thylakoid-bound photosystem (PS) II complex features the molecular framework and high redox potential needed to oxidize water, the source of the available electrons, and protons required for nearly all carbon fixation on Earth, with the by-product of molecular oxygen providing the atmosphere that allows for aerobic respiration (Satoh, 1996; Barber, 2006). In concert with the other thylakoid-bound photosynthetic complexes, water splitting by PSII converts absorbed light energy into the reducing equivalents required by the PCR cycle to fix CO2 into stable sugars via the CO2-fixing enzyme Rubisco (Barber, 2006; Kramer and Evans, 2011).
During steady-state photosynthesis by healthy leaves, photosynthetic rate will usually be limited either by CO2 fixation by Rubisco (e.g. at high light or low CO2) or by the rate of energy production from the thylakoid reactions (e.g. at low light or high CO2) (Farquhar et al., 1980; von Caemmerer and Farquhar, 1981; von Caemmerer, 2000). Water-splitting and subsequent electron donation by PSII is rarely considered a rate limiting step to the thylakoid reactions in non-stressed leaves (Evans, 1988; Makino et al., 1994; Price et al., 1998; Yamori et al., 2010). However under stressed conditions such as excessive light or high temperature, PSII is the more labile of the thylakoid complexes (Berry and Björkman, 1980; Long et al., 1994; Murata et al., 2007; Tyystjärvi, 2008; Takahashi and Badger, 2011). The fragility and dynamic changes of the complex are considered a consequence of the effects of UV and blue light on the water splitting complex, the high redox potentials necessary to oxidize water and the sensitivity of the protein repair system to reactive oxygen species (Andersson et al., 1992; van Gorkom and Schelvis, 1993; Takahashi and Murata, 2008; Oguchi et al., 2011; Takahashi and Badger, 2011). The chloroplast encoded D1 protein which, along with the D2 protein, forms the core of PSII, undergoes a constant cycle of oxidative damage, degradation, and replacement, and even under non-stressed conditions has a half life of just 2h (Ohad et al., 1984; Greer et al., 1986; Andersson et al., 1992; Sundby et al., 1993; Andersson and Barber, 1996; Yamashita et al., 2008). Loss of PSII function through these mechanisms can be associated with reduced photosynthetic rates (Ohad et al., 1984; Long et al., 1994). For example in capsicum leaves, it has been demonstrated that photoinhibition of 40% of the total PSII pool can cause a decline in maximum photosynthetic rate at high light (Lee et al., 1999). Under low light conditions, PSII may set the rate of thylakoid electron transport, and consequently influences carbon fixation, primary productivity, and crop yield (Farage and Long, 1991; Long et al., 1992, 1994; Stirling et al., 1993).
Of the eight PSII subunits which are nuclear encoded in Arabidopsis thaliana, and hence relatively easy to genetically manipulate, the extrinsic PsbO protein is one of the most important (Bricker, 1992; Kuwabara and Murata, 1983; Mayfield et al., 1987b; Wollman et al., 1999). The protein, often referred to as the 33kDa protein or the manganese stabilizing protein (MSP), is highly conserved across oxygenic photosynthetic organisms, from cyanobacteria to angiosperms, which in itself suggests a critical role for PSII function (Bricker and Frankel, 1998; Leuschner and Bricker, 1996). The subunit is exposed to the lumenal side of the thylakoid membrane and plays a functional role at the water splitting site, in addition to a structural role, interacting with several of the core PSII subunits (Barber, 2006). Impaired or absent PSII function has been shown in PsbO-lacking mutants in organisms as diverse as Synechocystis (sp. PCC6803, Burnap and Sherman, 1991), Chlamydomonas reinhardtii (Mayfield et al., 1987a, 1987b) and A. thaliana (Yi et al., 2005). These important roles and interactions made the PsbO protein an ideal target for antisense reductions for the purposes of this study.
In A. thaliana there are two regions of nuclear DNA encoding two distinct isoforms of the PsbO protein, PsbO1 and PsbO2 (encoded by At5g66570 and At3g50820, respectively, the Arabidopsis Information Resource, http://www.arabidopsis.org) with the PsbO1 isoform being far more abundant (Murakami et al., 2002). Though the cDNA sequences for the two genes are 83% similar in the coding region, a separate role for the two isoforms was predicted from the assumption that natural selection would be unlikely to maintain a superfluous gene/protein and this has been supported by empirical evidence (Murakami et al., 2002; Lundin et al., 2007). Gene knock-out experiments have indicated that the two isoforms appear to have different roles in water splitting and the phosphorylation and degradation of the D1 protein and subsequent repair of the PSII complex (Lundin et al., 2007, 2008; Allahverdiyeva et al., 2009). PsbO1 appears to play a role in the association of the calcium ion cofactor at the water splitting site, thereby enhancing PSII activity, whereas PsbO2 is more important for the degradation and turnover of the D1 subunit that is necessary to maintain active PSII complexes (Lundin et al., 2007, 2008; Bricker and Frankel, 2008; Allahverdiyeva et al., 2009).
This study aimed to investigate how PSII limits overall photosynthetic rate and interacts with other photosynthetic components by using antisense RNA technology to change the stoichiometry of PSII in vivo. Antisense studies have been used successfully to investigate aspects of the PCR cycle (Raines, 2003) and aspects of the light-dependent thylakoid reactions, for example cytochrome b6f (Price et al., 1998, 1995), PSI (Haldrup et al., 2003) and ATP synthase (Price et al., 1995; Rott et al., 2011; Yamori et al., 2011b). Decreasing leaf cytochrome b6f content by antisense reductions in the Rieske FeS protein decreased chloroplast electron transport rate proportionally (Price et al., 1995, 1998; Anderson et al., 1997; Ruuska et al., 2000; Yamori et al., 2011b), confirming early measurements that indicated a direct link between cytochrome b6f content and maximum chloroplast electron transport capacity (Evans, 1987a, 1988). ATP synthase also exerts a significant limitation on electron transport rate (Price et al., 1995) but this is alleviated somewhat by the ability of the complex to increase its activity in vivo (Kanazawa and Kramer, 2002; Kramer et al., 2004a; Rott et al., 2011; Yamori et al., 2011a). Only a few studies have used antisense techniques to examine the effects on photosynthesis when PSII capacity is diminished (Stockhaus et al., 1990; Andersson et al., 2001; García-Cerdán et al., 2009). This study reports on the in vivo photosynthetic consequences of impairing the capacity of PSII in leaves through antisense reductions in the PsbO proteins in A. thaliana.
Materials and methods
Plasmid construction and generation of transgenic plants
A. thaliana (ecotype Columbia) RNA was extracted in TRIzol reagent (Invitrogen, Australia) and cDNA was synthesized. A segment of psbO1 was amplified with the primer pair 5′-CACCCTCAAGTTGACCATACCACA-3′ (forward) and 5′-GTGGCCATGGCAGCCTCTCT-3′ (reverse) using Platinum Pfx DNA polymerase (Invitrogen). The 1006-bp product spans the full length of the coding DNA sequence of psbO1 and was intended to also affect psbO2, which has an 81% similar coding sequence. A BLAST of the reverse complement of the antisense product, for both coding regions and 5′- and 3′ untranscribed regions for A. thaliana, found a maximum complementarity with other genes of just 20bp (Altschul et al., 1997), less than generally required for RNA suppression (Huntzinger and Izaurralde, 2011). The PCR product was purified from an agarose gel and cloned into the pENTR vector, transformed into Escherichia coli TOP10 (Invitrogen) and sequences confirmed. A Gateway LR Clonase II enzyme mix reaction was used to transfer the construct to the Gateway binary vector, pMDC32 cassette C1 (Curtis and Grossniklaus, 2003) and transformed into Agrobacterium tumefaciens AGL1 (Lazo et al., 1991). The gene construct was transferred into A. thaliana (ecotype Columbia) using the floral dip method described by Clough and Bent (1998).
T1 seed was screened for hygromycin resistance on Murashige and Skoog Basal medium (Murashige and Skoog, 1962), with 0.8% (w/v) Bacto agar (BD, France), 3% (w/v) sucrose, 30 µg/ml (w/v) hygromycin (Sigma-Aldrich, Australia), and 150 µg/ml (w/v) timentin (GlaxoSmithKline, Australia). Seed was stratified at 4 °C for 48h then germinated in conditions of 25 °C and 18/6 h light/dark cycle with an irradiance of 100–150 µmol quanta m–2 s–1 provided by fluorescent lights. Resistant plants were selected by fully expanded cotyledons in the first few days and the development of true leaves within a week.
A number of hygromycin-resistant T1 plants were identified and these were transferred to soil and grown to seed for analysis of the T2 generation. Second-generation (T2) plant lines were identified by a number corresponding to their T1 parent, such that all plants with a different line number are the progeny of independent T1 transformants.
Plant growth conditions
Second-generation (T2) transgenic lines were germinated similarly to T1 seed, but without hygromycin or timentin. After approximately 10 days, when at least two true leaves had developed, plants were transferred to soil supplemented with slow release fertilizer (Osmocote Exact, Scotts, Australia), and moved to a controlled environment growth chamber. Photoperiod was 9h, relative humidity 70%, irradiance at pot height 200 µmol quanta m–2 s–1 and day/night temperature was 23/18 °C.
Plant growth rates
The top view photosynthetic ground cover was used as a proxy for plant size, determined by a chlorophyll fluorescence imaging system (CF Imager, Technologia, UK; Oxborough and Baker, 1997a). This method will increasingly underestimate leaf area with time due to increasing leaf overlap, but was convenient and non-destructive. Area measurements started 10 days after plants were transferred to soil (after 14 days on germination media). Area was then measured every 3 days. Relative rate of rosette area increase over the course of the experiment was calculated by fitting an exponential to the increase in area of each individual plant over the course of measurements.
Determination of leaf functional PSII, cytochrome f, Rubisco, and chlorophyll content
The leaf content of functional PSII centres was determined from the oxygen yield per single turnover saturating flash on fresh leaf discs in 1% CO2 in an oxygen electrode chamber (LD2/3 chamber with an S1 silver-platinum electrode disc, Hansatech, Norfolk, England), according to Chow et al. (1989, 1991). The oxygen yield per flash was used to calculate the number of functional (oxygen evolving) PSII centres per leaf area, assuming one oxygen molecule is evolved from each PSII centre per four flashes.
Total Rubisco catalytic sites per leaf area were quantified by the stoichiometric binding of the radioactively labelled inhibitor, [14C] carboxyarabinitol-bisphosphate (CABP), according to the method described in Ruuska et al. (1998).
Leaf cytochrome f content was determined on a pooled thylakoid sample from WT plants only, extracted as per Dwyer et al. (2007). Cytochrome f concentration was calculated from the spectra of the hydroquinol-reduced, relative to ferricyanide-oxidized, solution, according to Bendall et al. (1971).
For leaf chlorophyll content, frozen leaf samples were ground in phosphate-buffered 80% acetone (pH 7.8) then chlorophyll a and b concentration determined from absorbance readings at 646.6, 663.6, and 750nm in a Cary 50 Bio UV-visible spectrophotometer (Varian, USA), according to Porra et al. (1989).
Western blotting
Leaf content of PsbO and other photosynthetic proteins was determined on an area basis through Western blotting relative to a four-point (25, 50, 75, and 100%) dilution series of a WT leaf extract according to Yamori et al. (2011b) with some modifications. The same WT extract was used as a standard for all quantifications and the mean coefficient of determination (r 2) for the standard curves used for protein quantification was 0.996±0.002. Primary antibodies for the photosynthetic proteins PsbO, PsbD, PetC, PsaD, and AtpC were sourced from Agrisera (Vännäs, Sweden).
To visualize the two PsbO isoforms, thylakoids were isolated as for cytochrome f measurements, except that individual plant samples were not pooled. Thylakoid samples were denatured by boiling for 5min in loading buffer (250mM TRIS-HCl, pH 8.5, 10% (v/v) glycerol, 2% (w/v) SDS, 0.5mM EDTA, 0.01% (w/v) bromophenol blue, and 5% (v/v) beta-mercaptoethanol). Denatured samples were loaded on a chlorophyll basis, equivalent to 2μg chlorophyll, and separated on a precast 18% TRIS-glycine gel (Invitrogen). Proteins were transferred and visualized as described above using the same PsbO primary antibody.
Blue native PAGE
Thylakoid samples were isolated as described above for cytochrome f measurement. Membrane suspensions were solubilized on ice with the addition of n-dodecyl-β-d-maltoside (Sigma-Aldrich) to a final concentration of 2% and insoluble material removed by centrifugation at 12,000 g for 10min at 4 °C. A 1/10 volume of loading buffer of 100mM BIS-TRIS-HCl (pH 7.0), 500mM 6-aminocaproic acid, 30% (v/v) glycerol, and 5% (w/v) Serva Blue G (SERVA Electrophoresis, Germany) was added to the mixture. Thylakoid solutions equivalent to 4 µg chlorophyll were loaded on a 4–16% gradient Novex NativePAGE BIS-TRIS gel (Invitrogen) at 4 °C with the running voltage increased from 75V to 200V over the course of the 3-h run. The cathode buffer (15mM BIS-TRIS, 50mM Tricine-HCl, pH 7.0) with 0.1% (w/v) SERVA Blue G was exchanged for a dye-free buffer after the dye front was two-thirds of the way down the gel. After running, the gel was scanned, stained with GelCode Blue Stain Reagent (ThermoScientific, USA), then scanned again. Bands were identified according to Järvi et al. (2011) and quantified using the Quantity One software (v 4.6.3, Bio-Rad, USA).
Chlorophyll a fluorescence measurements
The maximum quantum yield of PSII photochemistry measured by the chlorophyll a fluorescence ratio, FV/FM, was determined using a PAM-101 fluorometer (Walz, Effeltrich, Germany) with a red measuring beam and fluorescence detection at wavelengths greater than 710nm. Saturating flashes of 1 s duration were provided by a halogen flash lamp (150W) at an intensity of 5000 µmol quanta m–2 s–1. Plants were dark acclimated for a minimum of 2h.
P700 measurements
Redox changes in P700 were monitored through absorbance changes at 810nm (relative to a reference wavelength of 870nm to control for plastocyanin and other signal contamination) under saturating single turnover flashes superimposed over steady far red light, as described in Losciale et al. (2008) with the exception that the signal was calibrated by a signal change corresponding to 0.1% change in transmission under steady-state far red light to yield a (calibrated) change in transmittance, △T c. This signal was then converted to absorbance units, △A, according to the Beer–Lambert law, △A = log10(1 + △T c) (see Supplementary Methods for derivation, available at JXB online).The value of △A is directly proportional to the concentration of P700+ and the maximum absorbance achieved immediately after the saturating flash, △A max, is proportional to the total amount of photo-oxidizable P700, assuming the measuring beam path length remains relatively constant.
Leaf absorbance and response of oxygen evolution to irradiance
Oxygen evolution rates were measured on leaf discs in a water-jacketed (23 °C) gas-phase oxygen electrode chamber (LD2/3 chamber with an S1 silver-platinum electrode disc, Hansatech, England), the top window of which was modified for insertion of a 4cm2 fibre optic bundle which provided actinic light and allowed measurement of chlorophyll fluorescence via the Walz PAM 101 system described above. Actinic light was provided by a 100W xenon projector lamp with an infrared filter, with intensity controlled by neutral density filters. The spectrum of this source, measured with a spectroradiometer (LI-1800, LI-COR, USA), showed a peak intensity at 590nm, and intensity at wavelengths greater than 700nm was 15% of that between 400 and 700nm. The absorbance of each leaf measured was determined with a spectroradiometer and leaf integrating sphere (LI-1800-12).
Leaf pieces of approximately 3cm2 were placed into the darkened oxygen electrode chamber with a pad dampened with 1M NaHCO3 (pH 9) to provide a CO2 concentration of approximately 10 mmol mol–1 (Chow et al., 1989). The oxygen electrode was calibrated by injecting 1ml of air into the chamber then allowed to stabilize for 5min. The slope of the electrode voltage over time in the dark was taken to be the baseline associated with mitochondrial respiration and any instrumental drift, and all gross oxygen evolution rates were determined relative to it. Irradiance was increased stepwise to the maximum, allowing 5min for stabilization at each of the following incident irradiances: 0, 25, 50, 115, 200, 300, 430, 500, 800, 1000, and 1450 µmol quanta m–2 s–1. Quantum yields were calculated from the average increase in oxygen evolution per absorbed quanta between 0 and 115 µmol quanta m–2 s–1 incident irradiance. Maximum oxygen evolution rates were determined from the average of the rate measured at the three highest incident light irradiances, 800, 1000, and 1450 µmol quanta m–2 s–1. Gross oxygen evolution rates (E ogross) were fit to the following empirical model (Ögren and Evans, 1993; von Caemmerer, 2000):
 |
where E Omax is the maximum gross oxygen evolution rate, I abs the irradiance absorbed by the leaf and ठ the curvature factor. The leaf quantum yield for oxygen evolution, ΦO, is dependent on both the intrinsic PSII quantum efficiency and the distribution of excitation energy between PSII and PSI, X. The model was fitted using the least squares method to find values for E Omax, ठ, and ΦO.
Linear chloroplast electron transport rate from PSII calculated from chlorophyll fluorescence, J f, is given by:
 |
where ΦPSII is the quantum yield from chlorophyll fluorescence (Genty et al., 1989) and X is the ratio of quanta absorbed by PSII to quanta absorbed by the leaf (Maxwell and Johnson, 2000).
By substituting the linear electron transport rate calculated from oxygen evolution (assuming four electrons per molecular oxygen), J oxygen, for J f and rearranging Equation 2, an estimate of the partitioning of quanta to PSII can be obtained from the combination of chlorophyll fluorescence and oxygen electrode measurements:
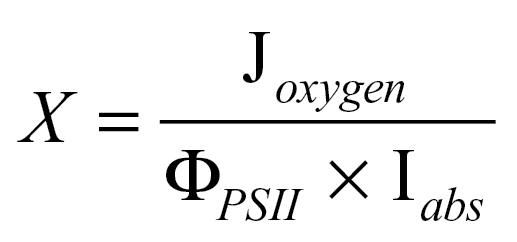 |
This calculation for X is a comparison between electron transport rates calculated from oxygen evolution and from chlorophyll fluorescence.
Microscopy
Representative leaves were cut into pieces of approximately 1–2×3–4mm and embedded in Araldyte 502 similarly to the method of Pengelly et al. (2010). Sections for light microscopy were cut from embedded leaf pieces at 0.5mm thickness using glass knives on an ultramicrotome (Ultracut E, Leica, Austria), stained with toluidine blue, and heat-fixed to glass slides. Sections were viewed through light microscope (Axioskop, Zeiss, Germany) and images captured on a high-resolution CCD camera (Flex, Spot Imaging, USA). Chloroplast number per palisade cell and number of cell layers were counted manually for three regions per section, using ×200 and ×400 magnification respectively. Leaf thickness was determined on three regions per ×200 image using ImageJ software (NIH, USA). These measurements were repeated on three independent leaves for both WT and low PsbO plants. The average value per section was used for statistical analysis.
Thin sections of approximately 90nm were cut from the upper palisade layer of leaves using an ultramicrotome and stained with uranyl acetate and lead citrate. The sections were viewed in a transmission electron microscope (H7000, Hitachi, USA) at 75kV and digital images captured with a CCD camera (13C, Scientific Instruments and Applications, USA).
Statistical treatments
Linear and non-linear relationships were fit in Origin (v7.03, OriginLab Corporation, USA) using a least-squares method with a chi-squared tolerance of 5×10–50. Correlation coefficients and Student’s t-tests were calculated performed using Statistica (v6.0, StatSoft, USA).
Results
Anti-psbO phenotype
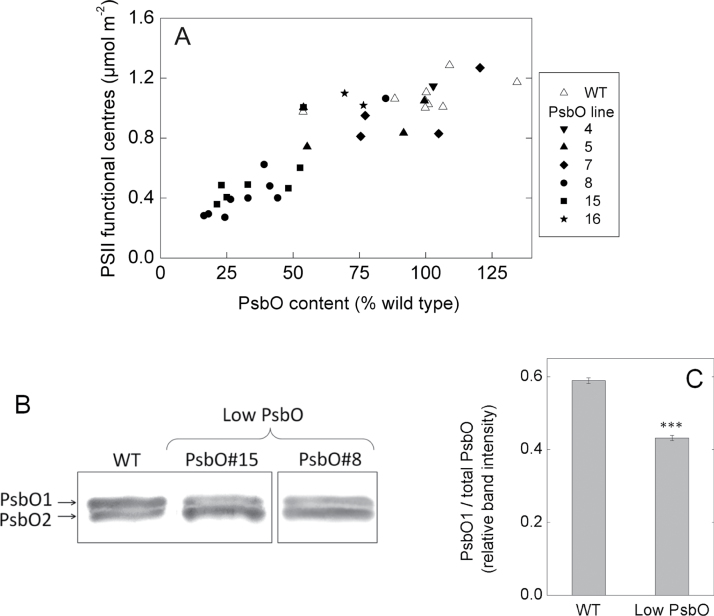
Total leaf PsbO protein content of T2 progeny of transgenic PsbO antisense lines was determined from band intensity on a Western blot relative to a dilution series of a standard extract from wild-type plants. Wild-type (WT) leaves varied in PsbO content from 60 to 130% of the reference extract (Fig. 1). Transgenic T2 lines exhibited a wider range, down to approximately 25% in lines 8 and 15. Functional (i.e. oxygen producing) PSII content, determined on fresh leaf discs from the oxygen yield per single turnover flash method, decreased almost in direct proportion with decreasing PsbO content (Fig. 1A). Photosystem II content in the lowest transgenic plants measured was around 0.3 µmol m–2, approximately 27% of that measured in WT plants.
Fig. 1.
(A) Relationship between total leaf PsbO protein content and functional (oxygen-evolving) PSII centres for a number of independent T2 antisense PsbO lines (r 2 = 0.79, P < 0.0001). PsbO protein content was determined on a leaf area basis through Western blotting relative to a dilution series of a WT standard extraction. Functional PSII was determined from oxygen yield per single turnover flash (see Materials and Methods). (B) Resolution of the two PsbO isoforms from isolated thylakoids of a WT and two low PsbO transgenic lines. Gels were loaded on a chlorophyll basis (note from Table 1 that the chlorophyll content per leaf area in low PsbO plants is around half that of WT). The PsbO line 8 sample was run on the same gel but not on the adjacent lane. (C) The proportion of the total PsbO band intensity accounted for by the PsbO1 isoform. Shown are the averages and standard errors for three biological replicates of WT (mean PSII content 1.11 µmol m–2) and low PsbO (lines #8 and #15, mean PSII content 0.47 µmol m–2). ***, significant difference (P = 0.0001).
High-resolution gel electrophoresis and immunoblotting was performed separately to the above-mentioned Western blots to determine the relative change in the amount of the two PsbO isoforms in the plants with lowest PsbO contents (Fig. 1B). The antisense effect was most evident on the PsbO1 isoform compared to PsbO2. The proportion of the total PsbO content accounted for by the PsbO1 isoform was reduced from 59 to 43% (P = 0.0001, Fig. 1C). The PsbO2 band was not significantly different (P = 0.49) in plants with reduced total PsbO content. Given that these gels were loaded on a chlorophyll basis, this indicates that the PsbO2 change was in proportion to leaf chlorophyll content and thus also decreased on a per area basis (see below). Semiquantitative PCR using primers specific for psbO1 and psbO2 indicated that there was repression of mRNA for both isoforms relative to an 18S control in the lowest PsbO plants (Supplementary Fig. S1).
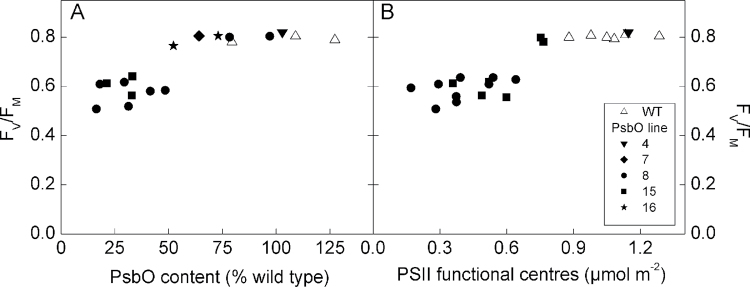
The two T2 lines with the greatest reductions in PsbO content, lines 8 and 15, exhibited a low FV/FM phenotype (Fig. 2A) and small size (Fig. 3A, B). The low FV/FM phenotype in these lines was related to both a decrease in FM and an increase in FO, and was not explainable by PSI signal interference or dark acclimation time (data not shown). Other lines showing moderate reductions in PsbO content (lines 5, 7, and 16) exhibited no obvious FV/FM phenotype. This biphasic response of FV/FM was also evident when plotted against functional PSII (Fig. 2B). Chlorophyll fluorescence imaging demonstrated that this phenotype was consistent within a leaf and between leaves of different ages, indicating that the antisense effects was ontogenetically stable (Supplementary Fig. S2). Plants exhibiting an FV/FM phenotype and less than 0.7 µmol m–2 functional PSII centres (corresponding to approximately 50% PsbO) were designated as ‘low PsbO’ plants.
Fig. 2.
Changes in the dark adapted maximum quantum yield from chlorophyll fluorescence (FV/FM) on the basis of PsbO protein content determined by Western blot (A) and on the basis of functional PSII content determined by the oxygen yield from single turnover flashes (B). The two data sets partially overlap but not all plants that had PsbO content measured were subsequently measured for functional PSII centres, and vice versa.
Fig. 3.
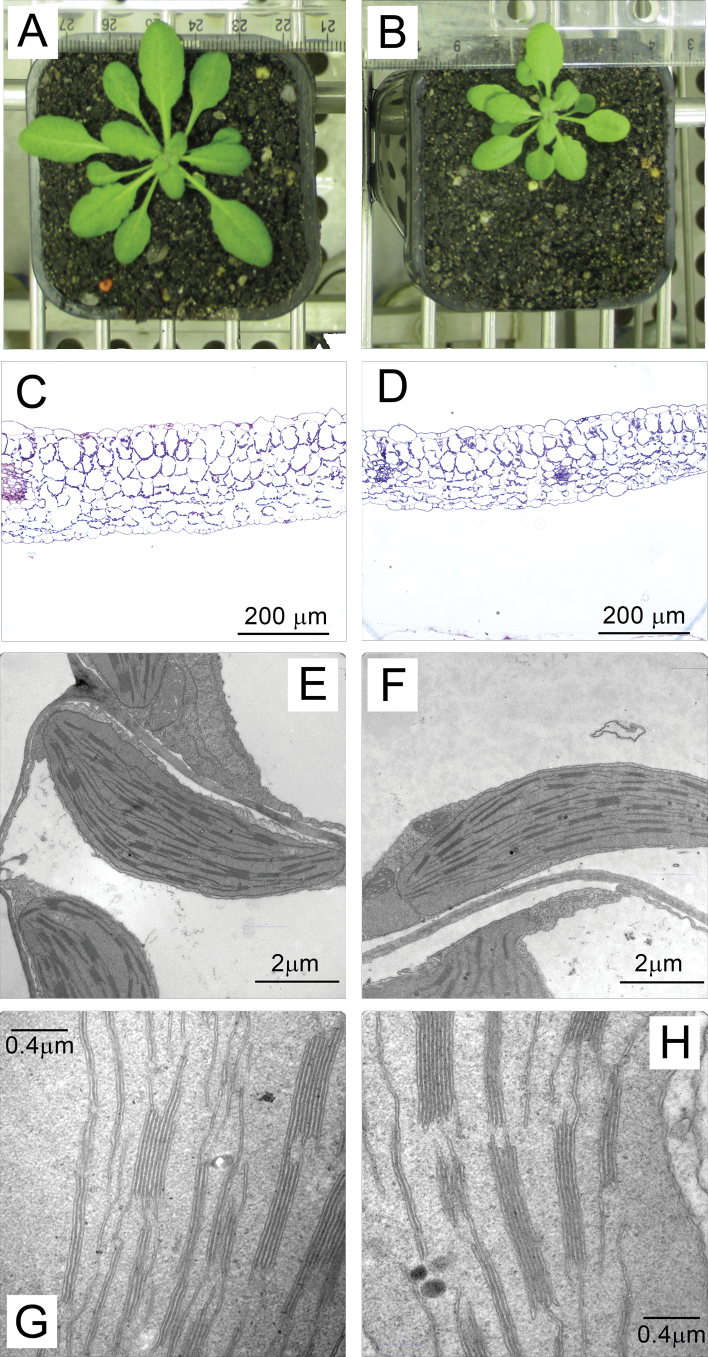
Examples of phenotypic differences between WT (A, C, E, G) and low PsbO (B, D, F, H) plants: (A, B) growth differences, (C, D) transverse leaf sections (magnification ×200), (E–H) chloroplasts from palisade cells. Refer to Table 1 for quantifications from microscopy images. Bars, 200 µm (C, D), 2 µm (E, F), 0.4 µm (G, H) (this figure is available in colour at JXB online).
Given low PsbO plants appeared smaller at maturity than WT (Fig. 3A, B), growth rate was estimated by using the top view of the photosynthetic area as a non-destructive approximation for total leaf area (Table 1). Under the growth conditions used, low PsbO plants were slightly smaller than WT plants at the beginning of area measurements, and this difference was exacerbated over the 12 days of measurement such that relative rate of rosette area increase calculated from the top view of photosynthetic area was reduced by one-third in these transgenics. Dry leaf mass per area was 21% lower in the low PsbO plants compared to WT, but leaf dry mass per fresh mass did not change.
Table 1.
Growth parameters and leaf characteristics of wild-type and low PsbO plants
Wild-type plants all have greater than 0.9 µmol m–2 functional PSII centres and plants with low PsbO have less than 0.6 µmol m–2 functional PSII centres. Average relative growth rate (RGR) over the course of the growth experiment was calculated by fitting an exponential to the data points of each individual plant. Initial surface area refers to that at the start of growth measurements (10 days after transfer from sucrose-supplemented growth media to soil) and final surface area that after a further 12 days (i.e. 22 days after transfer to soil). LMA, Leaf mass per area; △A, absorbance proportional to P700 content, assuming the 810nm measuring beam path length is constant between samples; Adaxial absorptance, absorptance to the xenon projector lamp used as the actinic source for light response measurements.
| Wild type | Low PsbO | P | |||
| Mean ± SE | n | Mean ± SE | n | ||
| Relative rate of rosette area increase (m2 m–2 day–1) | 0.19±0.00 | 5 | 0.13±0.01 | 7 | <0.0001 |
| Initial surface area (cm2) | 3.29±0.16 | 5 | 2.08±0.38 | 7 | 0.0037 |
| Final surface area (cm2) | 30.81±0.84 | 5 | 9.34±2.55 | 7 | <0.0001 |
| LMA dry (g m–2) | 16.9±1.2 | 5 | 13.4±0.4 | 6 | 0.0130 |
| LMA fresh (g m–2) | 258±18 | 5 | 196±9 | 6 | 0.0101 |
| Leaf dry mass/fresh mass | 0.066±0.001 | 5 | 0.070±0.003 | 6 | 0.1893 |
| Leaf thickness of fixed sections (µm) | 214±19 | 3 | 154±10 | 3 | 0.04808 |
| Leaf transverse cell layers | 8.42±0.22 | 3 | 7.50±0.52 | 3 | 0.1802 |
| Grana per chloroplast | 34.5±2.0 | 3 | 28.8±0.7 | 3 | 0.0562 |
| Thylakoid layers per grana | 4.87±0.14 | 3 | 5.66±0.17 | 3 | 0.0236 |
| Chl a (µmol m–2) | 309±9 | 9 | 156±8 | 8 | <0.0001 |
| Chl b (µmol m–2) | 79±2 | 9 | 51±3 | 8 | <0.0001 |
| Chl a/b | 3.9±0.1 | 9 | 3.1±0.1 | 8 | <0.0001 |
| ∆A max (absorbance units × 103) | 4.3±0.2 | 6 | 2.5±0.2 | 7 | 0.0001 |
| Adaxial absorptance | 0.76±0.01 | 7 | 0.73±0.01 | 9 | 0.0216 |
Embedded leaf sections were 28% thinner in low PsbO plants compared to WT, though the number of transverse cell layers was not significantly different (Table 1 and Fig. 3C, D). Analysis of palisade chloroplasts showed that low PsbO mutants did not differ from WT in the number of grana stacks per chloroplast, but tended to have more thylakoid layers per granum (Table 1 and Fig. 3E–H).
Photosynthetic proteins
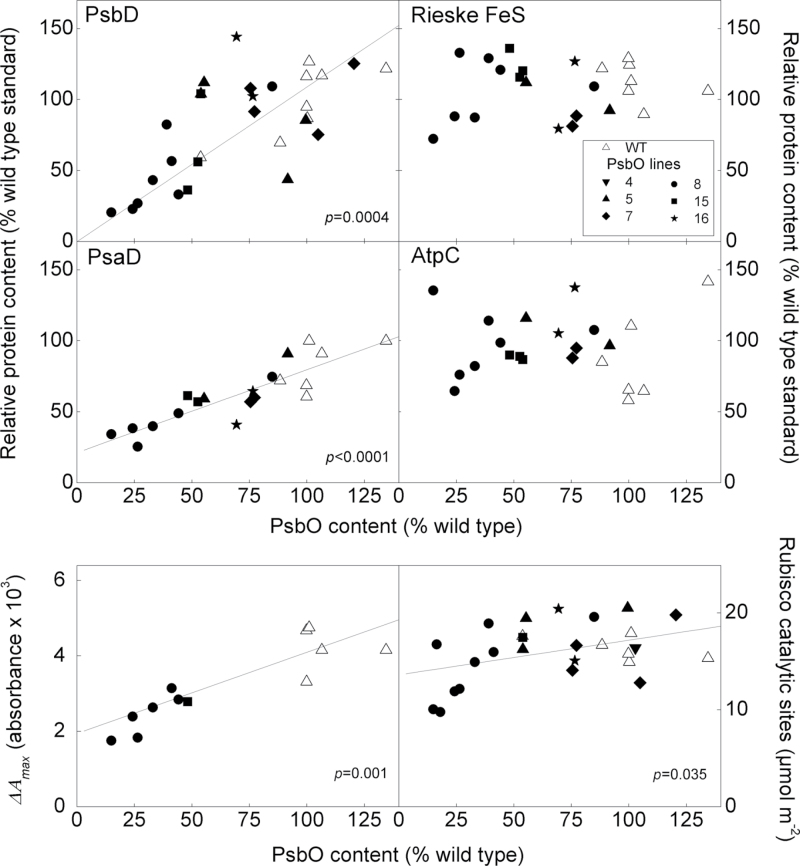
The leaf content of proteins representing the major chloroplast electron transport complexes was quantified by Western blotting using the same WT standard extract used to quantify PsbO (Fig. 4). The core PSII subunit, PsbD (D2), decreased in parallel with PsbO content indicating the change in oxygen yield per single turnover flash was due to an absence of PSII centres (as opposed to assembled but non-functional centres). The PsaD protein of PSI also decreased, but only by approximately half this extent. A similar change was detected in maximum absorbance signal from P700+, △A max. This parameter is proportional to photo-oxidizable P700 content and the change adds functional support to the finding of decreased PSI protein content (Table 1). While both PSII and PSI content was reduced on an area basis in low PsbO plants, the change in PSII was greater such that the ratio of PSII to PSI declined. No change was evident in the relative content per leaf area of the Rieske FeS protein of the cytochrome b6f complex or the AtpC subunit of ATP synthase. The assumption is made that only proteins formed into complexes are sufficiently stable to be measured by Western blot. Therefore, the absence of essential component proteins should reflect the absence of the complex. Rubisco catalytic sites per leaf area were determined separately, via the binding of the radioactively labelled inhibitor, [14C]CABP. There was no change in Rubisco content in transgenic plants until PsbO content was reduced below 40%. Contents per unit leaf area of chlorophyll a and b were significantly less in the low PsbO plants, as was the chlorophyll a/b ratio (Table 1).
Fig. 4.
Relationship between PsbO leaf protein content and major proteins representing the key steps in photosynthesis. PsbD (PSII), PsaD (PSI), Rieske FeS (cytochrome b6f), and AtpC (ATP synthase) were determined by Western blotting. Total Rubisco catalytic sites was determined on a different set of plants by 14C-CABP binding. The ∆A max parameter is proportional to total photo-oxidizable P700 content per area. It is included to give physiological support to the change in PSI content indicated by PsaD. Solid lines indicate a statistically significant relationship: for PsbD the regression equation is y = 1.01x; for PsaD, y = 0.58 + 21.28; for ∆Amax, y = 0.02x + 1.94; for Rubisco, y = 0.04x + 13.64. Note that the slope of the regression line for PsaD is approximately half of that for PsbD.
Cytochrome f content determined spectrophotometrically for a pooled leaf extract from four WT plants was 0.47±0.07 µmol m–2. Given the lack of relationship between PsbO and Rieske FeS protein content, this value of cytochrome f was assumed to be consistent across the range of transgenics.
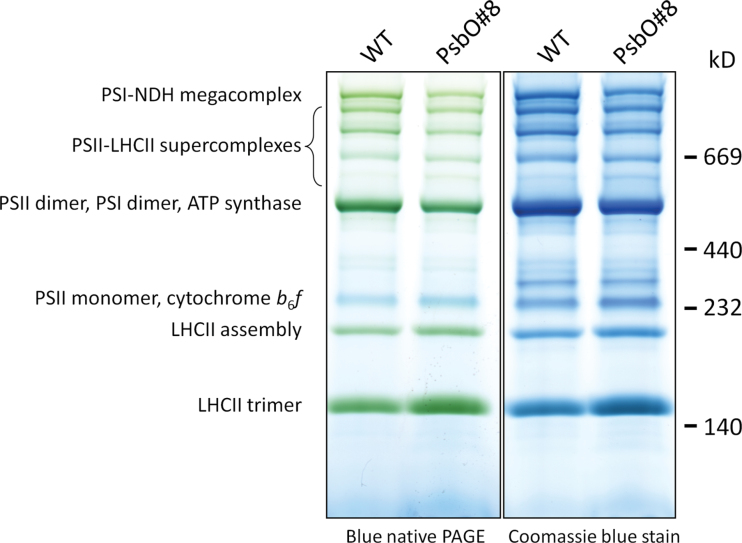
Blue native PAGE was performed to separate and visualize thylakoid membrane bound complexes in the native state. No major band shifts or missing/novel bands were evident in the low PsbO plants compared to the WT (Fig. 5). There was, however, an increase in the relative amount of LHCII not associated with a photosystem core. The sum of bands labelled LHCII assembly and LHCII trimer relative to the sum of all labelled bands for PsbO plants increased by 35% relative to WT. There was also a reduction in the sum of the PSII-LCHII supercomplexes compared to WT.
Fig. 5.
Blue native polyacrylamide gel electrophoresis of isolated thylakoid membranes from a WT and a low PsbO plant. Gels were loaded on an equivalent chlorophyll basis (4 µg). The image shows the original Blue native gel and the same gel after further staining with Coomassie blue. Molecular weights are indicated with a High Molecular Weight Calibration Kit for native electrophoresis (GE Healthcare). Band identifications are taken from Järvi et al. (2011) (this figure is available in colour at JXB online).
Photosynthetic physiology
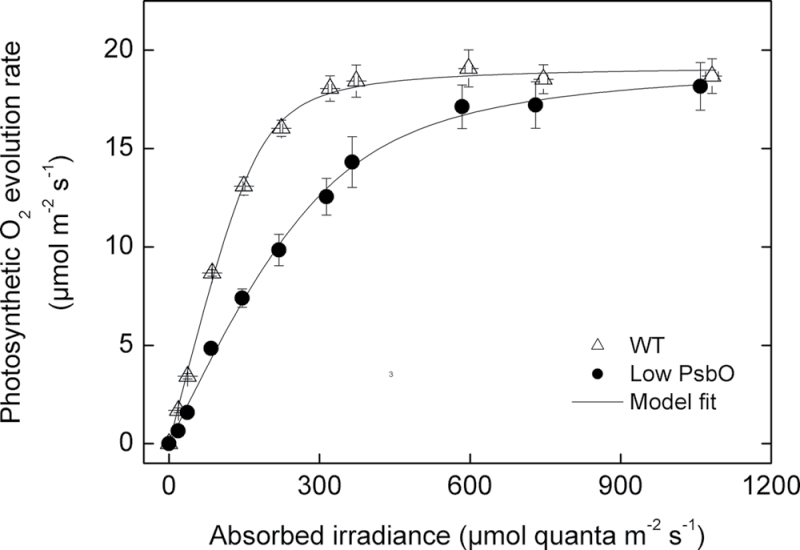
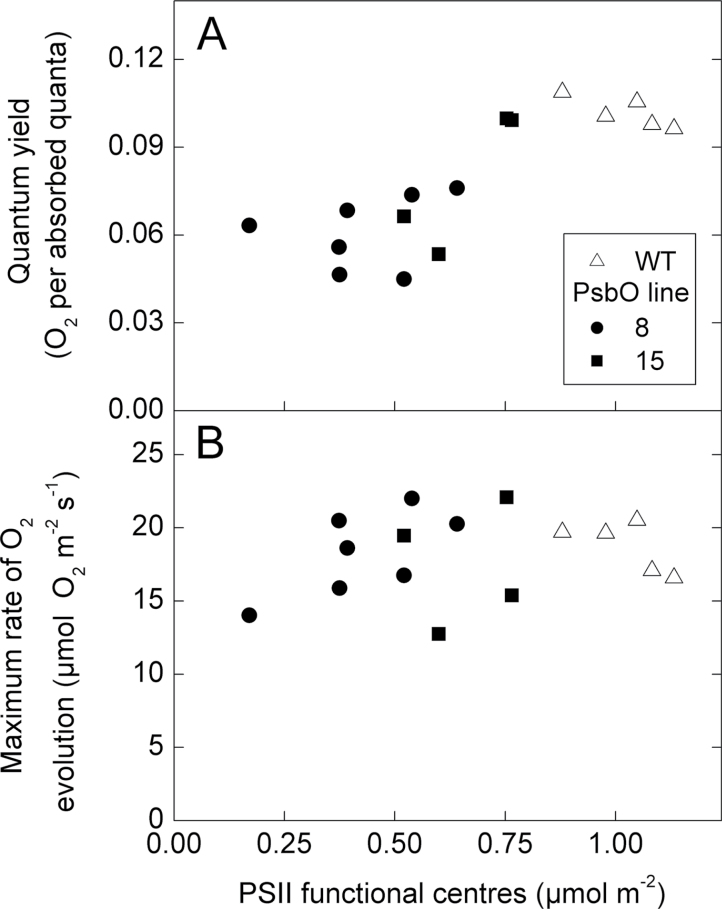
The gross oxygen evolution rate in response to increasing irradiance was measured on leaf pieces with an oxygen electrode under saturating CO2 concentrations (Fig. 6). The quantum yield for oxygen evolution (the slope of the initial phase) decreased as PsbO content decreased, such that low PsbO plants exhibited a quantum yield 50% lower than the WT value of 0.10 oxygen per quantum (Fig. 7A). Maximum rates of oxygen evolution measured under saturating irradiances were independent of PsbO content, with a mean rate of 18.0±0.8 µmol O2 m–2 s–1 (Fig. 7B). The combination of these characteristics meant that WT plants were light saturated at approximately 400 µmol quanta m–2 s–1, whereas low PsbO plants required between 600 and 800 µmol quanta m–2 s–1 to reach their maximum oxygen evolution rates.
Fig. 6.
Gross oxygen evolution per leaf area measured at approximately 1000 µbar CO2 for WT plants (>0.85 µmol m–2 functional PSII centres, n = 5) and antisense mutants with low PSII functional centres (<0.6 µmol m–2, n = 8) PSII functional centres. Gross oxygen evolution rates were calculated relative to the signal drift in the dark, which was taken to be mitochondrial respiration. Solid lines are a fit of the average points to the model given in Equation 1. Model parameters for WT plants are E Omax = 19.25, ठ = 0.93, ΦO = 0.40. For low PsbO plants, E Omax =19.56, ठ = 0.85, ΦO = 0.21.
Fig. 7.
Parameters from light response curves as a function of PSII functional centres. (A) The quantum yield for oxygen evolution, determined from the initial slope of light response curves. (B) The maximum rate of gross oxygen evolution, averaged from the three highest irradiances. There is a significant correlation between PSII functional centres and quantum yield (r 2 = 0.67, P = 0.0001).
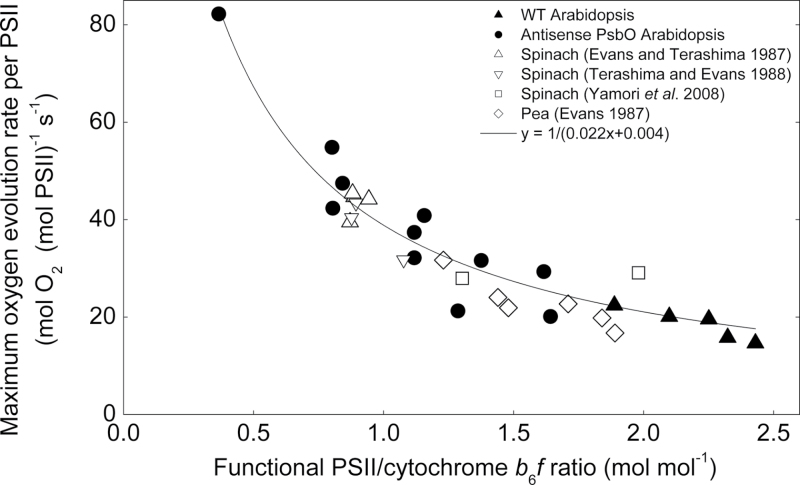
Given that there was no change in the maximum oxygen evolution rate per leaf area (under saturated light and CO2 conditions), the maximum oxygen evolution rate per total functional PSII increased in the low PsbO transgenics (Fig. 8). By plotting this parameter as a function of cytochrome b6f to PSII ratio, a hyperbolic relationship was obtained which was consistent with data recalculated from previous studies on pea and spinach (Evans, 1987b; Evans and Terashima, 1987; Terashima and Evans, 1988; Yamori et al., 2008).
Fig. 8.
Maximum oxygen evolution rates per leaf PSII content as a function of the PSII to cytochrome b6f ratio, for Arabidopsis, spinach, and pea. Open symbols are values calculated from other studies which have measured maximum electron transport-limited photosynthetic rate at 25 °C, total PSII centres and cytochrome b6f content: spinach grown under various nitrogen nutrition (Evans and Terashima, 1987), irradiance (Terashima and Evans, 1988), and temperature (Yamori et al., 2008); and pea grown under various irradiance (Evans, 1987b). For atrazine binding, measurements were converted to the equivalent functional PSII measurements obtained through flash yield, by dividing by 1.14 (Chow and Anderson, 1987; Chow et al., 1989). For Yamori et al. (2008) PSII centres were estimated from the chlorophyll content and cytochrome f content taken from Yamori et al. (2005). The line is a fit to the Arabidopsis data only (r 2 = 0.93).
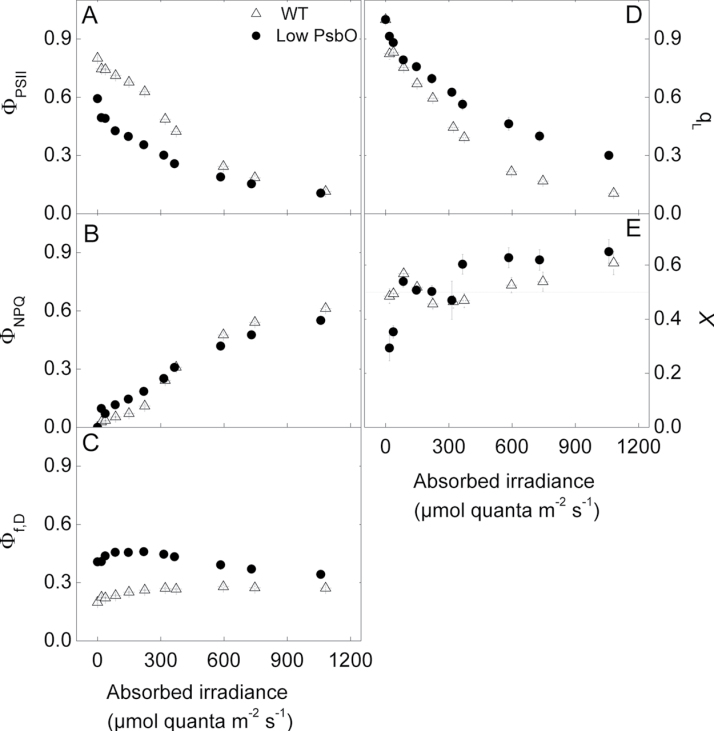
Chlorophyll a fluorescence was measured concurrently with oxygen evolution rates. Consistent with measured oxygen evolution rates, the PSII photochemical efficiency measured from chlorophyll fluorescence (ΦPSII, Genty et al., 1989) was lower in low PsbO plants compared to WT at low irradiance (at approximately 80 µmol quanta m–2 s–1, P < 0.0001), but at saturating irradiances no differences were evident (at approximately 1050 µmol quanta m–2 s–1, P = 0.29; Fig. 9A). The quantum yield of non-photochemical quenching (ΦNPQ, Hendrickson et al., 2004) was slightly higher in the low PsbO relative to WT plants at irradiances below 400 µmol quanta m–2 s–1, but slightly lower than WT at higher irradiances (Fig. 9B). The quantum yield of fluorescence and constitutive thermal energy dissipation, Φf,D, was markedly higher in the low PsbO plants at all light intensities (Fig. 9C). While Φf,D increased with irradiance in the WT, in the transgenic plants it showed a decrease at light intensities above about 150 µmol quanta m–2 s–1. The fraction of ‘open’ PSII centres, q L (according to the shared antenna model of PSII, Kramer et al., 2004b), declined faster in the WT plants as irradiance was increased and was lower compared to low PsbO plants at saturating irradiances (P < 0.0001; Fig. 9D). An estimated PSII to PSI light partitioning factor, X (Equation 3), can be obtained by combining fluorescence parameters with oxygen evolution rates (Fig. 9E). Wild-type plants varied around 0.5 at all irradiances, whereas low PsbO plants varied from 0.4 at irradiances below 50 µmol quanta m–2 s–1 to 0.5 between 50 and 350 µmol quanta m–2 s–1, before increasing to 0.6 at irradiances greater than 400 µmol quanta m–2 s–1. Measurements of chlorophyll fluorescence and photosynthetic O2 evolution gave qualitatively similar responses for photosynthetic electron transport to irradiance.
Fig. 9.
Fluorescence parameters measured concurrently with oxygen evolution rates. (A) The
quantum yield of PSII, ΦPSII, given by 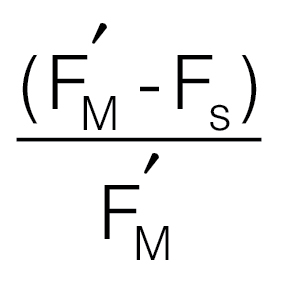 (Genty
et al., 1989). (B′) The quantum yield of non-photochemical quenching,
ΦNPQ, given by
 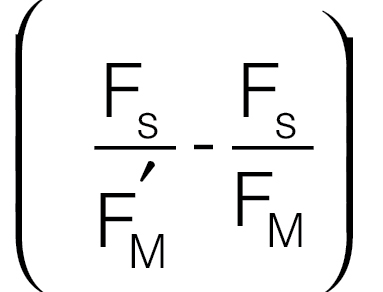 (Hendrickson et al., 2004). (C) The quantum
yield of fluorescence and constitutive thermal energy dissipation, Φf,D, given
by
 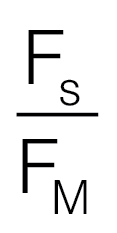 (Hendrickson et al., 2004). (D) The proportion of
‘open’ PSII centres, qL, given by
 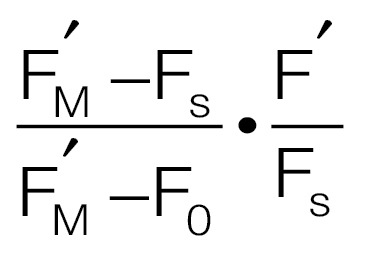 (Kramer et al., 2004b), where F'O was calculated according to Oxborough and Baker (1997b). (E) An estimation
of the proportion of absorbed irradiance used for water splitting at PSII, X,
calculated according to Equation 3. The dashed line at 0.5 shows the expected value if
PSII and PSI centres were using an equal proportion of the absorbed light.
Discussion
Reduction in PsbO content leads to reduced PSII content and low quantum yield
The aim of this study was to gain a better understanding of the rate-limiting potential of photosystem II (PSII) in photosynthesis in vivo by creating transgenic A. thaliana plants with reductions in the total amount of PsbO proteins. Plants with 25–60% of wild-type PsbO protein levels were produced. Both PsbO isoforms were decreased on a leaf area basis, but the antisense had a greater effect on the more abundant PsbO1 isoform. PsbO2 was reduced to a lesser extent, in approximate proportion to reductions in chlorophyll content, and thus the PsbO1/PsbO2 ratio was altered in these plants (Fig. 1). Previous studies of A. thaliana mutants have shown that in the absence of one PsbO isoform, the other isoform tends to accumulate in compensation (Murakami et al., 2002, 2005; Lundin et al., 2007). Given that total PsbO content in the antisense mutants was decreased to such a degree and with no hyper-accumulation of PsbO2 on either a chlorophyll or leaf area basis, it may be concluded that the antisense construct led to a decrease in expression of both PsbO isoforms (see also gene expression data in Supplementary Fig. S1).
Reductions to oxygen evolving (functional) PSII centres were almost directly proportional to reductions in total PsbO. Low PsbO mutants had less than a third of the wild-type content of PSII centres per unit leaf area. The amount of D2 protein of the PSII core was also reduced almost one to one with PsbO content (Fig. 4). The D2 protein is the first building block for PSII assembly and is stable relative to the rapidly turned over D1 protein (Minai et al., 2006). Therefore the decrease in D2 amount indicates that the decrease in oxygen yield per single turnover flash was due to a simple absence of PSII centres, and there was not an accumulation of assembled (or partly assembled) but non-functional PSII centres in the leaf. Blue native PAGE is consistent with this conclusion, as there were no band shifts or additional bands that might suggest the presence of unusually assembled PSII centres (Fig. 5).
The quantum yield of PSII gives a measure of the efficiency of the conversion of excitation energy into electron transport. Here the quantum yield was measured in two ways: through PSII photochemical efficiency calculated from chlorophyll fluorescence and from the initial slope of a light response curve of oxygen evolution, ΦO (Figs. 2 and 6 and Equation 1). The reduction in quantum yield indicates a decrease in the functional efficiency of the PSII centres present in the leaves of low PsbO plants. This phenotype has been noted in plants with reduced PsbO1, but not in plants with reduced PsbO2 (Murakami et al., 2002, 2005; Lundin et al., 2007), and here is also correlated with a decrease in PsbO1/PsbO2 ratio, as demonstrated in Fig. 1. As growth irradiance (200 µmol quanta m–2 s–1) falls within the light limited region of the irradiance response curves for both WT and low PsbO plants (Fig. 6), the difference in quantum yields would contribute to the 32% reduction in rosette expansion in low PsbO plants (Table 1).
Low PsbO plants have lower chlorophyll a/b ratios and reduced PSI content
One of the strengths of antisense techniques is that the protein or component of interest can often be targeted with minimal effects in other components and that a range of reductions in the target component can be achieved. Manipulating the stoichiometry of photosynthetic components in this way provide information as to how the complexes interact, colimit, and regulate (Furbank and Taylor, 1995; Raines, 2003). Despite the perturbation to PSII which is conceptually the first enzymatic step in photosynthesis, low PsbO plants did not exhibit changes in the quantity of Rubisco or proteins representing ATP synthase and cytochrome b6f (Fig. 4). The lack of change detected in cytochrome b6f content is important given its position between PSII and PSI, its role as one of the important limiting steps to electron transport rate and that cytochrome b6f content is highly regulated by growth irradiance (Anderson, 1992; Anderson et al., 1988; Evans, 1987b; Yamori et al., 2011b).
There were some significant pleiotropic changes in the photosynthetic biochemistry of low PsbO plants, however. Notably, a decrease in chlorophyll content, a decrease in the chlorophyll a/b ratio (Table 1) and a decrease in PSI content (Fig. 4). The reduction in PSI content was approximately half the extent of the reduction in PSII, and was in proportion to the overall decrease in chlorophyll content. Physiological measurements of P700, the primary electron donor of PSI, although less marked, give qualitative support to this protein-based conclusion (Fig. 4). The quantitation of PSI from P700 absorbance is complicated by signal contamination from plastocyanin. This contamination was controlled with the dual-wavelength approach used here (see Methods), but could be further eliminated by using a three-wavelength approach (Kirchhoff et al., 2004). Photosystem II to PSI ratio is an important factor in determining photosynthetic efficiency (Kramer and Evans, 2011) and leaves grown under light conditions that preferentially excites one or the other photosystem will adjust the stoichiometry of the two in order to maintain an effective linear electron transport and quantum yield under growth conditions (Chow et al., 1990). The redox state of plastoquinone (PQ), the lipid-soluble electron carrier between PSII and cytochrome b6f, appears to be a key regulatory signal for this adjustment PSII to PSI ratio (Pfannschmidt et al., 1999; Allen and Pfannschmidt, 2000; Shimizu et al., 2010). It is intriguing in this case that PSI content was decreased while cytochrome b6f remained unchanged.
Decreases in chlorophyll a/b ratio are generally driven by increased expression in the chlorophyll b-rich peripheral light harvesting complexes (LHC) per photosystem as an adaptive response to low light, increasing energy capture (Anderson et al., 1988; Bailey et al., 2001) for a minimal protein investment (Evans, 1987b). While reductions in PSII and PSI content would lower the chlorophyll a/b ratio (as the core pigments are mostly chlorophyll a), there may be additional changes to LHC expression driven by factors such as an altered redox state of the PQ pool. There was a reduction in LHC content per unit leaf area in the low PsbO plants, but LHC increased on a chlorophyll basis, as evidenced by the lower chlorophyll a/b ratio and increase in LHC complexes in the Blue native gel (Fig. 5). The reduction in quantum yield and high FO and Φf,D in the low PsbO plants suggest a decrease in the effectiveness of energy transfer from LHCs to PSII.
Increased chlorophyll a/b ratios, have also been noted in antisense plants with reduced ferredoxin content that leads to increased PQ reduction (Holtgrefe et al., 2003). In contrast, this effect was not apparent in tobacco plants with reductions in the Rieske FeS protein of cytochrome b6f, despite a highly reduced PQ pool, with the authors speculating that an interaction between the PQ redox state and the missing cytochrome b6f complex is required for regulation of peripheral light harvesting complexes (Anderson et al., 1997). In the case of low PsbO plants, cytochrome b6f content remained unchanged.
PSII capacity is not limiting to light-saturated electron transport rate
The oxygen evolution rate per total leaf PSII centres was calculated by dividing the light- and CO2-saturated photosynthetic rates by the PSII functional centres determined by the single turnover flash method (Fig. 8). This gives a ‘PSII-normalized’ chloroplast electron transport rate under light-saturated conditions. Altering the amount of functional PSII centres by antisense techniques produced a wide variation in this parameter in A. thaliana, from just 18mol O2 (mol PSII)–1 s–1 in WT plants to over 50mol O2 (mol PSII)–1 s–1 in the low PsbO transgenics. As functional PSII decreased to minimal values, there was no apparent plateau in PSII-normalized electron transport rate (Fig. 8), nor a decrease in maximum photosynthetic rate (Fig. 7). Low PsbO plants appear to maintain a greater proportion of ‘open’ PSII centres at high light, as determined by the chlorophyll fluorescence parameter, q L (Fig. 9D).
There was a hyperbolic relationship between oxygen evolution rate per PSII centre and PSII per unit cytochrome b6f in A. thaliana (Fig. 8). This parameter was calculated (at 25 °C) for pea and spinach from previous studies where the leaf PSII to cytochrome b6f ratio varied in response to light, nutrient, and growth temperature treatments (Evans, 1987b; Evans and Terashima, 1987; Terashima and Evans, 1988; Yamori et al., 2008). These species share the same hyperbolic relationship which can be written as P max/p = 1/(0.022 × p/f + 0.004), where Pmax is the maximum oxygen evolution rate, p is the PSII content, and f the cytochrome b6f content (from the regression line in Fig. 8). Rearrangement of the above equation gives:
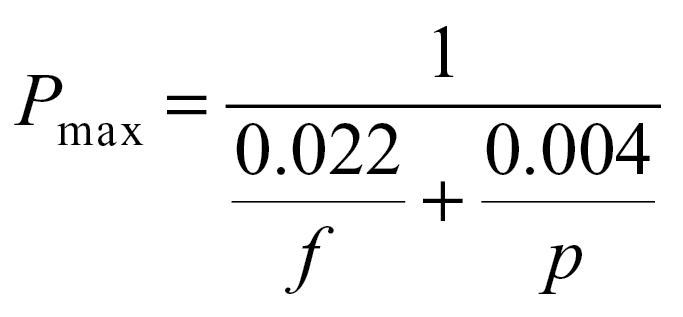 |
It is seen that P max decreases when either f or p decreases. However, since p is approximately twice as large as f in WT Arabidopsis, the first term in the denominator is more than 10-fold larger than the second term. This finding is consistent with cytochrome b6f, rather than PSII, being the most rate-limiting step to light-saturated chloroplast electron transport rates under moderate temperature conditions and therefore being a bottleneck in the light-saturated flow of electrons from PSII to PSI (Evans, 1988; Makino et al., 1994; Price et al., 1995, 1998; Yamori et al., 2010, 2011b). At high light, electron transport from PSII is modulated by changing q L to match the maximum electron transport rate allowed by the amount of cytochrome b6f.
This degree of insensitivity of maximum photosynthetic rate to PSII functional amount has been termed the ‘excess capacity’ of PSII (Behrenfeld et al., 1998; Kaňa et al., 2002) relative to cytochrome b6f at saturating light intensities. This study demonstrates this without the requirement for photoinhibitory treatments or herbicides to manipulate PSII functional centres.
Light-saturated PSII capacity has previously been studied using combinations of photoinhibition and herbicides to manipulate the number of active PSII centres in a leaf (Behrenfeld et al., 1998; Lee et al., 1999; Kaňa et al., 2002). These studies found that PSII became rate limiting to maximum (light-saturated) photosynthetic rate with 40% (in detached capsicum leaves, Lee et al., 1999) to 50% (in phytoplankton assemblages, Behrenfeld et al., 1998; in green algae, Kaňa et al., 2002) deactivation. In this study PSII functional amount was decreased by 75% without a measurable decrease in light- and CO2-saturated photosynthetic rate. Using the results from capsicum leaves in Lee et al. (1999), the maximum oxygen evolution rate per remaining active PSII centre reaches before it becomes limiting is approximately 25mol O2 (mol PSII)–1 s–1, lower than this parameter achieved in low PsbO A. thaliana and lower than for spinach and pea measured under non-photoinhibitory conditions (Fig. 8, data calculated from Evans, 1987b; Evans and Terashima, 1987; Terashima and Evans, 1988; Yamori et al., 2008). A key difference between these approaches and the antisense approach used here is that low PsbO plants simply lack PSII centres, whereas under photoinhibitory conditions it is likely that inactivated PSII centres accumulate in the thylakoid membrane. Kirchhoff et al. (2000) have demonstrated that diffusion of PQ can become a limiting factor to chloroplast electron transport rate due to the formation of microdomains in the thylakoid membrane preventing the free diffusion of reduced PQ from PSII to cytochrome b6f. Therefore it is possible that photosynthesis after photoinhibition of PSII is not limited by the capacity of PSII itself, but by the PQ diffusion limitations in the thylakoid membrane caused by macromolecular crowding from inactive (non-reducing) PSII centres. The lack of inactivated PSII centres in the low PsbO plants allows PQ diffusion to proceed at normal levels, thus leaving chloroplast electron transport limited by cytochrome b6f.
Conclusions
The most notable changes in the low PsbO plants were a decrease in the number of PSII centres per unit leaf area and lowered efficiency of those PSII centres that remained. This reduced quantum yield under low irradiance, but maximum light-saturated photosynthetic rates were unchanged despite having fewer PSII centres per unit leaf area. The reduction in quantum yield is a likely explanation for the reduced growth rate of low PsbO plants. A decrease in the number of PSII centres is not expected to lower quantum yield per se, so long as they are functional and the distribution of excitation energy between PSII and PSI is balanced (Kramer and Evans, 2011). There was more chlorophyll and LHCII content per PSII in low PsbO leaves, but it is not known how the different pigment protein complexes function together as effective antennae to PSII. The observed decrease in PSII efficiency may be due to impaired transfer of excitation energy from the light harvesting pigments to the PSII reaction centre in low PsbO plants associated with the increase in chlorophyll and LHCII content per PSII.
Supplementary material
Supplementary data are available at JXB online.
Supplementary methods. Conversion of a P700 transmittance signal to absorbance units
Supplementary Fig. S1. Semiquantitative PCR on PsbO1 and PsbO2 expression
Supplementary Fig. S2. Chlorophyll fluorescence images of an antisense plant with low PsbO content and a WT plant, demonstrating the consistency of FV/FM changes within and between leaves.
Acknowledgements
This work was supported by an Australian Postgraduate Award to SAD, the Australian Research Council Centre of Excellence in Plant Energy Biology (MRB), and grants from the Australian Research Council (WSC). For technical assistance and advice on methods the authors thank Benedict Long, Jasper Pengelly, Soumi Bala, and Husen Jia from the Research School of Biology, ANU. Cathy Gillespie of the John Curtin School of Medical Research, ANU, sectioned, stained and imaged for TEM.
References
- Allahverdiyeva Y, Mamedov F, Holmstrom M, Nurmi M, Lundin B, Styring S, Spetea C, Aro EM. 2009. Comparison of the electron transport properties of the psbo1 and psbo2 mutants of Arabidopsis thaliana. Biochimica et Biophysica Acta – Bioenergetics 1787 1230–1237 [DOI] [PubMed] [Google Scholar]
- Allen JF, Pfannschmidt T. 2000. Balancing the two photosystems: photosynthetic electron transfer governs transcription of reaction centre genes in chloroplasts Philosophical Transactions of the Royal Society of London. Series B: Biological Sciences 355 1351–1359 [DOI] [PMC free article] [PubMed] [Google Scholar]
- Altschul SF, Madden TL, Schäffer AA, Zhang J, Zhang Z, Miller W, Lipman DJ. 1997. Gapped BLAST and PSI-BLAST: a new generation of protein database search programs Nucleic Acids Research 25 3389–3402 [DOI] [PMC free article] [PubMed] [Google Scholar]
- Anderson JM. 1992. Cytochrome b6f complex: dynamic molecular organization, function and acclimation Photosynthesis Research 34 341–357 [DOI] [PubMed] [Google Scholar]
- Anderson JM, Chow WS, Goodchild DJ. 1988. Thylakoid membrane organisation in sun/shade acclimation Functional Plant Biology 15 11–26 [Google Scholar]
- Anderson JM, Price GD, Chow WS, Hope AB, Badger MR. 1997. Reduced levels of cytochrome bf complex in transgenic tobacco leads to marked photochemical reduction of the plastoquinone pool, without significant change in acclimation to irradiance Photosynthesis Research 53 215–227 [Google Scholar]
- Andersson B, Barber J. 1996. Mechanisms of photodamage and protein degradation during photoinhibition of photosystem II. In: Baker NB, editor, Photosynthesis and the Environment Dordrecht: Kluwer Academic Publishers, pp 101–121 [Google Scholar]
- Andersson B, Salter AH, Virgin I, Vass I, Styring S. 1992. Photodamage to photosystem II–primary and secondary events Journal of Photochemistry and Photobiology B: Biology 15 15–31 [Google Scholar]
- Andersson J, Walters RG, Horton P, Jansson S. 2001. Antisense inhibition of the photosynthetic antenna proteins CP29 and CP26: implications for the mechanism of protective energy dissipation The Plant Cell 13 1193–1204 [DOI] [PMC free article] [PubMed] [Google Scholar]
- Bailey S, Walters RG, Jansson S, Horton P. 2001. Acclimation of Arabidopsis thaliana to the light environment: the existence of separate low light and high light responses Planta 213 794–801 [DOI] [PubMed] [Google Scholar]
- Barber J. 2006. Photosystem II: an enzyme of global significance Biochemical Society Transactions 34 619–631 [DOI] [PubMed] [Google Scholar]
- Behrenfeld MJ, Prasil O, Kolber ZS, Babin M, Falkowski PG. 1998. Compensatory changes in photosystem II electron turnover rates protect photosynthesis from photoinhibition Photosynthesis Research 58 259–268 [Google Scholar]
- Bendall DS, Davenport HE, Hill R. 1971. Cytochrome components in chloroplasts of the higher plants Methods: A Companion to Methods in Enzymology 23 327–344 [Google Scholar]
- Berry J, Björkman O. 1980. Photosynthetic response and adaptation to temperature in higher plants Annual Review of Plant Physiology 31 491–543 [Google Scholar]
- Bricker TM. 1992. Oxygen evolution in the absence of the 33-kilodalton manganese-stabilizing protein Biochemistry 31 4623–4628 [DOI] [PubMed] [Google Scholar]
- Bricker TM, Frankel LK. 1998. The structure and function of the 33kDa extrinsic protein of photosystem II: a critical assessment Photosynthesis Research 56 157–173 [Google Scholar]
- Bricker TM, Frankel LK. 2008. The psbo1 mutant of Arabidopsis cannot efficiently use calcium in support of oxygen evolution by photosystem II Journal of Biological Chemistry 283 29022–29027 [DOI] [PMC free article] [PubMed] [Google Scholar]
- Burnap RL, Sherman LA. 1991. Deletion mutagenesis in Synechocystis sp. PCC6803 indicates that the Mn-stabilizing protein of photosystem II is not essential for O2 evolution Biochemistry 30 440–446 [DOI] [PubMed] [Google Scholar]
- Chow WS, Anderson JM. 1987. Photosynthetic responses of Pisum sativum to an increase in irradiance during growth. II. Thylakoid membrane components Functional Plant Biology 14 9–19 [Google Scholar]
- Chow WS, Hope AB, Anderson JM. 1989. Oxygen per flash from leaf disks quantifies photosystem II Biochimica et Biophysica Acta 973 105–108 [Google Scholar]
- Chow WS, Hope AB, Anderson JM. 1991. Further studies on quantifying photosystem II in vivo by flash-induced oxygen yield from leaf disks Australian Journal of Plant Physiology 18 397–410 [Google Scholar]
- Chow WS, Melis A, Anderson JM. 1990. Adjustments of photosystem stoichiometry in chloroplasts improve the quantum efficiency of photosynthesis Proceedings of the National Academy of Sciences, USA 87 7502–7506 [DOI] [PMC free article] [PubMed] [Google Scholar]
- Clough SJ, Bent AF. 1998. Floral dip: a simplified method for Agrobacterium-mediated transformation of Arabidopsis thaliana The Plant Journal 16 735–743 [DOI] [PubMed] [Google Scholar]
- Curtis MD, Grossniklaus U. 2003. A gateway cloning vector set for high-throughput functional analysis of genes in planta Plant Physiology 133 462–469 [DOI] [PMC free article] [PubMed] [Google Scholar]
- Dwyer SA, Ghannoum O, Nicotra AB, von Caemmerer S. 2007. High temperature acclimation of C4 photosynthesis is linked to changes in photosynthetic biochemistry Plant, Cell and Environment 30 53–66 [DOI] [PubMed] [Google Scholar]
- Evans JR. 1987a. The dependence of quantum yield on wavelength and growth irradiance Australian Journal of Plant Physiology 14 69–79 [Google Scholar]
- Evans JR. 1987b. The relationship between electron transport components and photosynthetic capacity in pea leaves grown at different irradiances Australian Journal of Plant Physiology 14 157–170 [Google Scholar]
- Evans JR. 1988. Acclimation by the thylakoid membranes to growth irradiance and the partitioning of nitrogen between soluble and thylakoid proteins Functional Plant Biology 15 93–106 [Google Scholar]
- Evans JR, Terashima I. 1987. Effects of nitrogen nutrition on electron transport components and photosynthesis in spinach Australian Journal of Plant Physiology 14 59–68 [Google Scholar]
- Farage PK, Long SP. 1991. The occurrence of photoinhibition in an over-wintering crop of oil-seed rape (Brassica napus L.) and its correlation with changes in crop growth Planta 185 279–286 [DOI] [PubMed] [Google Scholar]
- Farquhar GD, von Caemmerer SV, Berry JA. 1980. A biochemical model of photosynthetic CO2 assimilation in leaves of C3 species Planta 149 78–90 [DOI] [PubMed] [Google Scholar]
- Furbank RT, Taylor WC. 1995. Regulation of photosynthesis in C3 and C4 plants: a molecular approach The Plant Cell 7 797–807 [DOI] [PMC free article] [PubMed] [Google Scholar]
- García-Cerdán JG, Sveshnikov D, Dewez D, Jansson S, Funk C, Schröder WP. 2009. Antisense inhibition of the PsbX protein affects PSII integrity in the higher plant Arabidopsis thaliana Plant and Cell Physiology 50 191–202 [DOI] [PubMed] [Google Scholar]
- Genty B, Briantais J, Baker NB. 1989. The relationship between the quantum yield of photosynthetic eletron transport and quenching of chlorohyll fluorescence Biochimica et Biophysica Acta 990 87–92 [Google Scholar]
- Greer DH, Berry JA, Björkman O. 1986. Photoinhibition of photosynthesis in intact bean leaves: role of light and temperature, and requirement for chloroplast-protein synthesis during recovery Planta 168 253–260 [DOI] [PubMed] [Google Scholar]
- Haldrup A, Lunde C, Scheller HV. 2003. Arabidopsis thaliana plants lacking the PSI-D subunit of photosystem I suffer severe photoinhibition, have unstable photosystem I complexes, and altered redox homeostasis in the chloroplast stroma Journal of Biological Chemistry 278 33276–33283 [DOI] [PubMed] [Google Scholar]
- Hendrickson L, Furbank RT, Chow WS. 2004. A simple alternative approach to assessing the fate of absorbed light energy using chlorophyll fluorescence Photosynthesis Research 82 73–81 [DOI] [PubMed] [Google Scholar]
- Holtgrefe S, Bader KP, Horton P, Scheibe R, von Schaewen A, Backhausen JE. 2003. Decreased content of leaf ferredoxin changes electron distribution and limits photosynthesis in transgenic potato plants Plant Physiology 133 1768–1778 [DOI] [PMC free article] [PubMed] [Google Scholar]
- Huntzinger E, Izaurralde E. 2011. Gene silencing by microRNAs: contributions of translational repression and mRNA decay Nature Reviews Genetics 12 99–110 [DOI] [PubMed] [Google Scholar]
- Järvi S, Suorsa M, Paakkarinen V, Aro EM. 2011. Optimized native gel systems for separation of thylakoid protein complexes: novel super- and mega-complexes The Biochemical Journal 439 207–214 [DOI] [PubMed] [Google Scholar]
- Kanˇa R, Lazár D, Prášil O, Nauš J. 2002. Experimental and theoretical studies on the excess capacity of photosystem II Photosynthesis Research 72 271–284 [DOI] [PubMed] [Google Scholar]
- Kanazawa A, Kramer DM. 2002. In vivo modulation of nonphotochemical exciton quenching (NPQ) by regulation of the chloroplast ATP synthaseProceedings of the National Academy of Sciences, USA 99 12789–12794 [DOI] [PMC free article] [PubMed] [Google Scholar]
- Kirchhoff H, Horstmann S, Weis E. 2000. Control of the photosynthetic electron transport by PQ diffusion microdomains in thylakoids of higher plants Biochimica et Biophysica Acta – Bioenergetics 1459 148–168 [DOI] [PubMed] [Google Scholar]
- Kirchhoff H, Schöttler MA, Maurer J, Weis E. 2004. Plastocyanin redox kinetics in spinach chloroplasts: evidence for disequilibrium in the high potential chain Biochimica et Biophysica Acta – Bioenergetics 1659 63–72 [DOI] [PubMed] [Google Scholar]
- Kramer DM, Avenson TJ, Edwards GE. 2004a. Dynamic flexibility in the light reactions of photosynthesis governed by both electron and proton transfer reactions Trends in Plant Science 9 349–357 [DOI] [PubMed] [Google Scholar]
- Kramer DM, Evans J. 2011. Update: the importance of energy balance in improving photosynthetic productivity Plant Physiology 155 70–78 [DOI] [PMC free article] [PubMed] [Google Scholar]
- Kramer DM, Johnson G, Kiirats O, Edwards GE. 2004b. New fluorescence parameters for the determination of QA redox state and excitation energy fluxes Photosynthesis Research 79 209–218 [DOI] [PubMed] [Google Scholar]
- Kuwabara T, Murata N. 1983. Quantitative analysis of the inactivation of photosynthetic oxygen evolution and the release of polypeptides and manganese in the photosystem II particles of spinach chloroplasts Plant and Cell Physiology 24 741–747 [Google Scholar]
- Lazo GR, Stein PA, Ludwig RA. 1991. A DNA transformation-competent Arabidopsis genomic library in AgrobacteriumNature Biotechnology 9 963–967 [DOI] [PubMed] [Google Scholar]
- Lee H-Y, Chow WS, Hong Y-N. 1999. Photoinactivation of photosystem II in leaves of Capsicum annuum Physiologia Plantarum 105 376–383 [Google Scholar]
- Leuschner C, Bricker TM. 1996. Interaction of the 33kDa extrinsic protein with photosystem II: rebinding of the 33kDa extrinsic protein to photosystem II membranes which contain four, two, or zero manganese per photosystem II reaction center Biochemistry 35 4551–4557 [DOI] [PubMed] [Google Scholar]
- Long SP, Farage PK, Aguilera C, Macharia JMN. 1992. Damage to photosynthesis during chilling and freezing, and its significance to the photosynthetic productivity of field crops. In: J Barber, H Guerrero, H Mendrano, editors, Trends in Photosynthesis Research Hampshire, UK: Intercept, pp 345–356 [Google Scholar]
- Long SP, Humphries S, Falkowski PG. 1994. Photoinhibition of photosynthesis in nature Annual Review of Plant Physiology and Plant Molecular Biology 45 633–662 [Google Scholar]
- Losciale P, Oguchi R, Hendrickson L, Hope AB, Corelli-Grappadelli L, Chow WS. 2008. A rapid, whole-tissue determination of the functional fraction of PSII after photoinhibition of leaves based on flash-induced P700 redox kinetics Physiologia Plantarum 132 23–32 [DOI] [PubMed] [Google Scholar]
- Lundin B, Hansson M, Schoefs B, Vener AV, Spetea C. 2007. The Arabidopsis PsbO2 protein regulates dephosphorylation and turnover of the photosystem II reaction centre D1 proteinThe Plant Journal 49 528–539 [DOI] [PubMed] [Google Scholar]
- Lundin B, Nurmi M, Rojas-Stuetz M, Aro E-M, Adamska I, Spetea C. 2008. Towards understanding the functional difference between the two PsbO isoforms in Arabidopsis thaliana – insights from phenotypic analyses of psbo knockout mutantsPhotosynthesis Research 98 405–414 [DOI] [PubMed] [Google Scholar]
- Makino A, Nakano H, Mae T. 1994. Effects of growth temperature on the responses of ribulose-1,5-biphosphate carboxylase, electron transport components, and sucrose synthesis enzymes to leaf nitrogen in rice, and their relationships to photosynthesis Plant Physiology 105 1231–1238 [DOI] [PMC free article] [PubMed] [Google Scholar]
- Maxwell K, Johnson GN. 2000. Chlorophyll fluorescence – a practical guide Journal of Experimental Botany 51 659–668 [DOI] [PubMed] [Google Scholar]
- Mayfield SP, Bennoun P, Rochaix JD. 1987a. Expression of the nuclear encoded OEE1 protein is required for oxygen evolution and stability of photosystem II particles in Chlamydomonas reinhardtii The EMBO Journal 6 313–318 [DOI] [PMC free article] [PubMed] [Google Scholar]
- Mayfield SP, Rahire M, Frank G, Zuber H, Rochaix JD. 1987b. Expression of the nuclear gene encoding oxygen-evolving enhancer protein 2 is required for high-levels of photosynthetic oxygen evolution in Chlamydomonas reinhardtii Proceedings of the National Academy of Sciences, USA 84 749–753 [DOI] [PMC free article] [PubMed] [Google Scholar]
- Minai L, Wostrikoff K, Wollman F-A, Choquet Y. 2006. Chloroplast biogenesis of photosystem II cores involves a series of assembly-controlled steps that regulate translation The Plant Cell 18 159–175 [DOI] [PMC free article] [PubMed] [Google Scholar]
- Murakami R, Ifuku K, Takabayashi A, Shikanai T, Endo T, Sato F. 2002. Characterization of an Arabidopsis thaliana mutant with impaired psbO, one of two genes encoding extrinsic 33-kDa proteins in photosystem IIThe Plant Cell 523 138–142 [DOI] [PubMed] [Google Scholar]
- Murakami R, Ifuku K, Takabayashi A, Shikanai T, Endo T, Sato F. 2005. Functional dissection of two Arabidopsis PsbO proteinsFEBS Journal 272 2165–2175 [DOI] [PubMed] [Google Scholar]
- Murashige T, Skoog F. 1962. A revised medium for rapid growth and bioassays with tobacco tissue cultures Physiologia Plantarium 15 473–497 [Google Scholar]
- Murata N, Takahashi S, Nishiyama Y, Allakhverdiev SI. 2007. Photoinhibition of photosystem II under environmental stress Biochimica et Biophysica Acta – Bioenergetics 1767 414–421 [DOI] [PubMed] [Google Scholar]
- Ögren E, Evans JR. 1993. Photosynthetic light-response curves. I. The influence of CO2 partial pressure and leaf inversion Planta 189 182–190 [Google Scholar]
- Oguchi R, Douwstra P, Fujita T, Chow WS, Terashima I. 2011. Intra-leaf gradients of photoinhibition induced by different color lights: implications for the dual mechanisms of photoinhibition and for the application of conventional chlorophyll fluorometers New Phytologist 191 146–159 [DOI] [PubMed] [Google Scholar]
- Ohad I, Kyle DJ, Arntzen CJ. 1984. Membrane protein damage and repair: removal and replacement of inactivated 32-kilodalton polypeptides in chloroplast membranes Journal of Cell Biology 99 481–485 [DOI] [PMC free article] [PubMed] [Google Scholar]
- Oxborough K, Baker NR. 1997a. An instrument capable of imaging chlorophyll a fluorescence from intact leaves at very low irradiance and at cellular and subcellular levels of organization Plant, Cell and Environment 20 1473–1483 [Google Scholar]
- Oxborough K, Baker NR. 1997b. Resolving chlorophyll a fluorescence images of photosynthetic efficiency into photochemical and non-photochemical components – calculation of qP and Fv’/Fm’ without measuring Fo’ Photosynthesis Research 54 135–142 [Google Scholar]
- Pengelly JJL, Sirault XRR, Tazoe Y, Evans JR, Furbank RT, von Caemmerer S. 2010. Growth of the C4 dicot Flaveria bidentis: photosynthetic acclimation to low light through shifts in leaf anatomy and biochemistry Journal of Experimental Botany 61 4109–4122 [DOI] [PMC free article] [PubMed] [Google Scholar]
- Pfannschmidt T, Nilsson A, Allen JF. 1999. Photosynthetic control of chloroplast gene expression Nature 397 625–628 [Google Scholar]
- Porra RJ, Thompson WA, Kriedemann PE. 1989. Determination of accurate coefficients and simultaneous equations for assaying chlorophylls a and b extracted with four different solvents: verification of the chlororophyll standards by atomic absorption spectroscopy Biochimica et Biophysica Acta 975 384–394 [Google Scholar]
- Price GD, von Caemmerer S, Evans JR, Siebke K, Anderson JM, Badger MR. 1998. Photosynthesis is strongly reduced by antisense suppression of chloroplastic cytochrome bf complex in transgenic tobacco Australian Journal of Plant Physiology 25 445–452 [Google Scholar]
- Price GD, Yu JW, von Caemmerer S, Evans JR, Chow WS, Anderson JM, Hurry V, Badger MR. 1995. Chloroplast cytochrome b6/f and ATP synthase complexes in tobacco: transformation with antisense RNA against nuclear-encoded transcripts for the Rieske FeS and ATPδ polypeptides Australian Journal of Plant Physiology 22 285–297 [Google Scholar]
- Raines C. 2003. The Calvin cycle revisited Photosynthesis Research 75 1–10 [DOI] [PubMed] [Google Scholar]
- Rott M, Martins NdF, Thiele W, Lein W, Bock R, Kramer DM, Schöttler MA. 2011. ATP synthase repression in tobacco restricts photosynthetic electron transport, CO2 assimilation, and plant growth by overacidification of the thylakoid lumen The Plant Cell 23 304–321 [DOI] [PMC free article] [PubMed] [Google Scholar]
- Ruuska SA, Andrews TJ, Badger MR, Hudson GS, Laisk A, Price GD, von Caemmerer S. 1998. The interplay between limiting processes in C3 photosynthesis studied by rapid-response gas exchange using transgenic tobacco impaired in photosynthesis Australian Journal of Plant Physiology 25 859–870 [Google Scholar]
- Ruuska SA, Andrews TJ, Badger MR, Price GD, von Caemmerer S. 2000. The role of chloroplast electron transport and metabolites in modulating rubisco activity in tobacco. Insights from transgenic plants with reduced amounts of cytochrome b/f complex or glyceraldehyde 3-phosphate dehydrogenase Plant Physiology 122 491–504 [DOI] [PMC free article] [PubMed] [Google Scholar]
- Satoh K. 1996. Introduction to the photosystem II reaction centre–Isolation and biochemical and biophysical characterisation. In: Ort DR, Yocum CF, ed.tors, Oxygenic photosynthesis: the light reactions Dordrecht: Kluwer Academic, pp 193–211 [Google Scholar]
- Shimizu M, Kato H, Ogawa T, Kurachi A, Nakagawa Y, Kobayashi H. 2010. Sigma factor phosphorylation in the photosynthetic control of photosystem stoichiometry Proceedings of the National Academy of Sciences, USA 107 10760–10764 [DOI] [PMC free article] [PubMed] [Google Scholar]
- Stirling CM, Rodrigo VH, Emberru J. 1993. Chilling and photosynthetic productivity of field grown maize (Zea mays); changes in the parameters of the light-response curve, canopy leaf CO2 assimilation rate and crop radiation-use efficiency Photosynthesis Research 38 125–133 [DOI] [PubMed] [Google Scholar]
- Stockhaus J, Höfer M, Renger G, Westhoff P, Wydrzynski T, Willmitzer L. 1990. Anti-sense RNA efficiently inhibits formation of the 10 kd polypeptide of photosystem II in transgenic potato plants: analysis of the role of the 10 kd protein The EMBO Journal 9 3013–3021 [DOI] [PMC free article] [PubMed] [Google Scholar]
- Sundby C, McCaffery S, Anderson JM. 1993. Turnover of the photosystem II D1 protein in higher plants under photoinhibitory and nonphotoinhibitory irradiance Journal of Biological Chemistry 268 25476–25482 [PubMed] [Google Scholar]
- Takahashi S, Badger MR. 2011. Photoprotection in plants: a new light on photosystem II damage Trends in Plant Science 16 53–60 [DOI] [PubMed] [Google Scholar]
- Takahashi S, Murata N. 2008. How do environmental stresses accelerate photoinhibition? Trends in Plant Science 13 178–182 [DOI] [PubMed] [Google Scholar]
- Terashima I, Evans JR. 1988. Effects of light and nitrogen nutrition on the organization of the photosynthetic apparatus in spinach Plant and Cell Physiology 29 143–155 [DOI] [PubMed] [Google Scholar]
- Tyystjärvi E. 2008. Photoinhibition of photosystem II and photodamage of the oxygen evolving manganese cluster Coordination Chemistry Reviews 252 361–376 [Google Scholar]
- van Gorkom H, Schelvis J. 1993. Kok’s oxygen clock: what makes it tick? The structure of P680 and consequences of its oxidizing power Photosynthesis Research 38 297–301 [DOI] [PubMed] [Google Scholar]
- von Caemmerer S. Biochemical models of leaf photosynthesis. Melbourne: CSIRO Publishing; 2000. [Google Scholar]
- von Caemmerer S, Farquhar GD. 1981. Some relationships between the biochemistry of photosynthesis and the gas-exchange of leaves Planta 153 376–387 [DOI] [PubMed] [Google Scholar]
- Wollman F-A, Minai L, Nechushtai R. 1999. The biogenesis and assembly of photosynthetic proteins in thylakoid membranes Biochimica et Biophysica Acta – Bioenergetics 1411 21–85 [DOI] [PubMed] [Google Scholar]
- Yamashita A, Nijo N, Pospisil P, Morita N, Takenaka D, Aminaka R, Yamamoto Y. 2008. Quality control of photosystem II – reactive oxygen species are responsible for the damage to photosystem II under moderate heat stress Journal of Biological Chemistry 283 28380–28391 [DOI] [PMC free article] [PubMed] [Google Scholar]
- Yamori W, Evans JR, Von Caemmerer S. 2010. Effects of growth and measurement light intensities on temperature dependence of CO2 assimilation rate in tobacco leaves Plant, Cell and Environment 33 332–343 [DOI] [PubMed] [Google Scholar]
- Yamori W, Nagai T, Makino A. 2011a. The rate-limiting step for CO2 assimilation at different temperatures is influenced by the leaf nitrogen content in several C3 crop species Plant, Cell and Environment 34 764–777 [DOI] [PubMed] [Google Scholar]
- Yamori W, Noguchi K, Kashino Y, Terashima I. 2008. The role of electron transport in determining the temperature dependence of the photosynthetic rate in spinach leaves grown at contrasting temperatures Plant and Cell Physiology 49 583–591 [DOI] [PubMed] [Google Scholar]
- Yamori W, Noguchi K, Terashima I. 2005. Temperature acclimation of photosynthesis in spinach leaves: analysis of photosynthetic components and temperature dependencies of photosynthetic partial reactions Plant, Cell and Environment 28 536–547 [Google Scholar]
- Yamori W, Takahashi S, Makino A, Price GD, Badger MR, von Caemmerer S. 2011b. The roles of ATP synthase and the cytochrome b6/f complexes in limiting chloroplast electron transport and determining photosynthetic capacity Plant Physiology 155 9569–62 [DOI] [PMC free article] [PubMed] [Google Scholar]
- Yi X, McChargue M, Laborde S, Frankel LK, Bricker TM. 2005. The manganese-stabilizing protein is required for photosystem II assembly/stability and photoautotrophy in higher plants Journal of Biological Chemistry 280 16170–16174 [DOI] [PubMed] [Google Scholar]
Associated Data
This section collects any data citations, data availability statements, or supplementary materials included in this article.


