Abstract
Aberrant regulation of growth signaling is a hallmark of cancer development that often occurs through the constitutive activation of growth factor receptors or their downstream effectors. Using validation-based insertional mutagenesis (VBIM), we identified family with sequence similarity 83, member B (FAM83B), based on its ability to substitute for RAS in the transformation of immortalized human mammary epithelial cells (HMECs). We found that FAM83B coprecipitated with a downstream effector of RAS, CRAF. Binding of FAM83B with CRAF disrupted CRAF/14-3-3 interactions and increased CRAF membrane localization, resulting in elevated MAPK and mammalian target of rapamycin (mTOR) signaling. Ablation of FAM83B inhibited the proliferation and malignant phenotype of tumor-derived cells or RAS-transformed HMECs, implicating FAM83B as a key intermediary in EGFR/RAS/MAPK signaling. Analysis of human tumor specimens revealed that FAM83B expression was significantly elevated in cancer and was associated with specific cancer subtypes, increased tumor grade, and decreased overall survival. Cumulatively, these results suggest that FAM83B is an oncogene and potentially represents a new target for therapeutic intervention.
Introduction
The discovery of targets suitable for the development of specific and effective anticancer therapies remains one of the principal challenges facing cancer research. The identification of genes involved in tumorigenesis is essential for devising new targeted therapeutics and can be greatly facilitated by phenotypic-based forward genetic screens for mutations contributing to malignant transformation in human cell models. We recently created a validation-based insertional mutagenesis (VBIM) strategy that expands the application of reversible promoter insertion to nearly any type of mammalian cell (1). The VBIM strategy uses the unique transcriptomes of different human epithelial cell types and provides opportunities for the identification of tissue-specific oncogenes and tumor suppressors. The VBIM lentiviruses alter the unique transcriptome of the model system by introducing promoters into the genome, resulting in dominant genetic alterations that increase the expression of sequences neighboring the insertion sites. By using Cre recombinase–mediated excision of the VBIM promoter, one can revert the VBIM-specific mutants and distinguish them from spontaneous mutants, allowing spontaneous mutants to be eliminated from further study.
We have used the VBIM strategy to identify family with sequence similarity 83, member B (FAM83B), as a putative oncogene capable of promoting the transformation of immortalized human mammary epithelial cells (HMECs). We demonstrated that elevated FAM83B expression stimulated aberrant activation of MAPK signaling by altering binding of regulatory 14-3-3 proteins to CRAF and increasing CRAF membrane localization. In addition to driving cellular transformation, FAM83B mRNA was significantly elevated in many human tumor tissues. Ablation of FAM83B from breast cancer cells with elevated EGFR or HMECs transformed by activated RAS inhibited their proliferation, anchorage-independent growth (AIG), and tumorigenicity. Our discovery of FAM83B as an important intermediary in aberrant EGFR/RAS signaling suggests an avenue in the pursuit of novel therapeutics that can specifically suppress growth signaling in cancer cells.
Results
A forward genetic screen identifies FAM83B as a driver of AIG in HMECs.
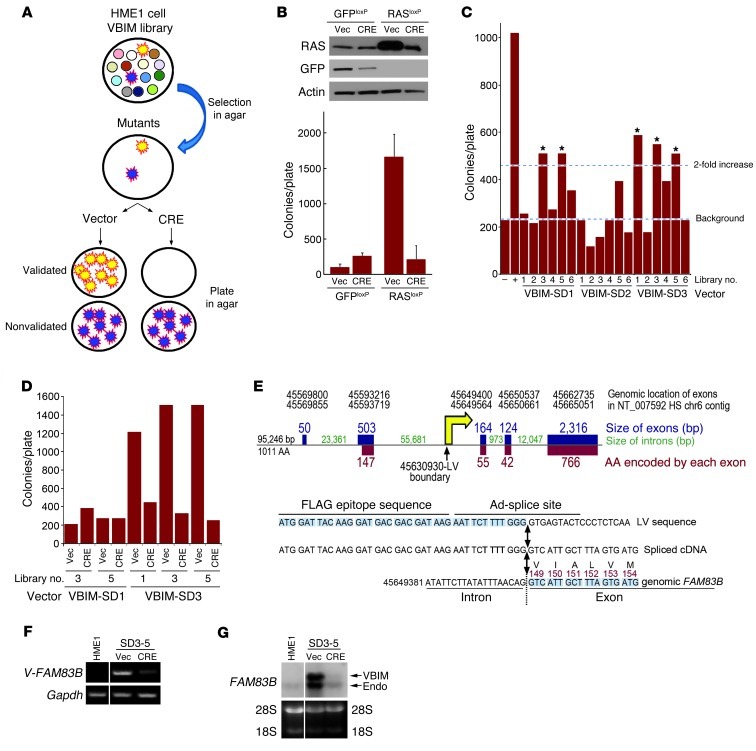
To identify genes capable of driving HMEC transformation, we performed a VBIM forward genetic screen using immortalized human mammary epithelial (HME1) cells (Figure 1A). A single genetic alteration, such as constitutive cyclin D1 or constitutive activation of RAS, promoted AIG of HME1 cells (Figure 1B and ref. 2). Our strategy involved the creation of multiple HME1 cell libraries in which each cell within the library had a different VBIM insertion event, resulting in a unique genetic alteration. Each library was expanded and plated into soft agar to select for rare mutants capable of AIG, a hallmark of transformed cells. Subsequently, mutant cells were recovered from agar and infected with a retrovirus encoding Cre recombinase to remove the VBIM mutagenic promoter. Those mutants that lost the ability to grow in an anchorage-independent manner were considered validated, promoter-dependent mutants worthy of further study. Those that showed no decrease in AIG after promoter excision were considered promoter-independent mutants and were not analyzed further (Figure 1A). The ability of cells to undergo phenotypic reversion was first examined using RAS-infected HME1 cells. RAS expression alone resulted in significant AIG, which could be reversed after recovery of the colonies from soft agar and expression of Cre recombinase to excise the promoter and cDNA (Figure 1B). After establishing the feasibility of reversion by Cre recombinase, we performed a VBIM screen to identify novel genes capable of substituting for RAS and inducing AIG.
Figure 1. A forward genetic screen identifies FAM83B as a driver of AIG in HMECs.
(A) VBIM strategy. (B) HME1 cells were infected with retroviruses encoding GFPloxP and RASloxP and analyzed for AIG. Cells were recovered from agar and infected with a retrovirus encoding CRE recombinase (CRE) or a control retrovirus (Vec) and analyzed for AIG. (C) The screen was conducted using 10,000 cells per well and 6 wells for each of the 3 VBIM viruses. The initial 10,000 cells were expanded to 200,000 cells and analyzed for AIG. The 5 libraries with more than twice as many colonies as the GFP control are denoted by asterisks. Cells expressing GFP (–) or RAS (+) alone served as the negative and positive controls, respectively. (D) 5 pools were recovered from agar, infected with a retrovirus encoding CRE or control vector, and analyzed for AIG. (E) VBIM integration site in FAM83B. The number of nucleotides comprising each of the 5 exons of FAM83B is shown in blue. The number of nucleotides comprising each intron is shown in green. The number of amino acids encoded by each exon is shown in red. The yellow arrow denotes the VBIM insertion site within intron 2. (F) RT-PCR was performed on RNA from SD3-5 cells using a primer targeting the 5′ region of the VBIM-driven mRNA and a 3′ FAM83B-specific primer. (G) Northern analysis of FAM83B expression in parental HME1 cells and SD3-5 cells infected with a retrovirus encoding CRE or control vector. Lanes in F and G were run on the same gel but were noncontiguous (white lines).
We conducted a VBIM screen consisting of 6 libraries for each of the 3 VBIM lentiviruses, representing 3 different splice-donor reading frames (SD1, SD2, and SD3) (1). After VBIM infection, each of the 18 cell libraries was expanded, plated into soft agar, and assessed for AIG. 5 libraries had more than twice as many colonies as the GFP control (Figure 1C). To test the promoter dependence of these mutants, they were recovered as individual colonies or as pools of colonies, infected with a retrovirus encoding Cre recombinase or control retrovirus, and plated into soft agar to test for phenotypic reversion. The successful validation of cells from libraries SD3-1 and SD3-5 is shown in Figure 1D (recovered pools of colonies) and Supplemental Figure 1A (individual colonies; supplemental material available online with this article; doi: 10.1172/JCI60517DS1). The additional 3 pools either did not revert, or failed to continue as a manageable culture, and were not further analyzed. The failure of some pools to revert highlights the superior efficiency of the VBIM approach, since nonvalidated mutants were likely to be caused by an unidentified spontaneous genetic alteration that would be extremely difficult to analyze further.
The VBIM insertion sites were identified from the SD3-1 and SD3-5 mutants using inverse PCR (1). The promoter insertion in the SD3-1 mutant mapped to the second intron of the gene SLC30A7; however, expression of either full-length SLC30A7 or the VBIM-driven SLC30A7 truncation in naive HME1 cells failed to confirm that it alone could promote AIG, and therefore no additional work was performed (Supplemental Figure 1, B and C). The promoter insertion in the SD3-5 mutant was mapped to the first intron of the uncharacterized gene FAM83B (Figure 1E). Using a primer targeting the 5′ region of the VBIM-driven mRNA and a 3′ FAM83B-specific primer, we confirmed via RT-PCR the expression of the VBIM-FAM83B fusion transcript and its loss after Cre-mediated promoter excision (Figure 1F). VBIM-mediated expression of FAM83B was also confirmed by Northern analysis (Figure 1G), and the VBIM-driven mRNA was cloned and sequenced. Based on the orientation of the CMV promoter relative to the FAM83B coding region, a truncated FAM83B protein lacking the first 148 amino acids of the 1,011–amino acid protein was expected (Figure 1E).
FAM83B drives AIG in naive HME1 cells and is elevated in human cancer specimens.
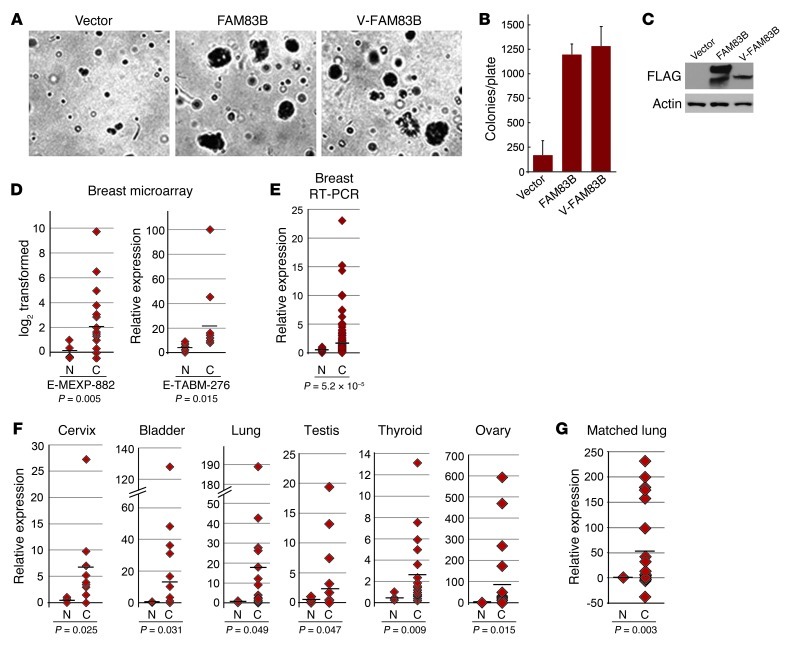
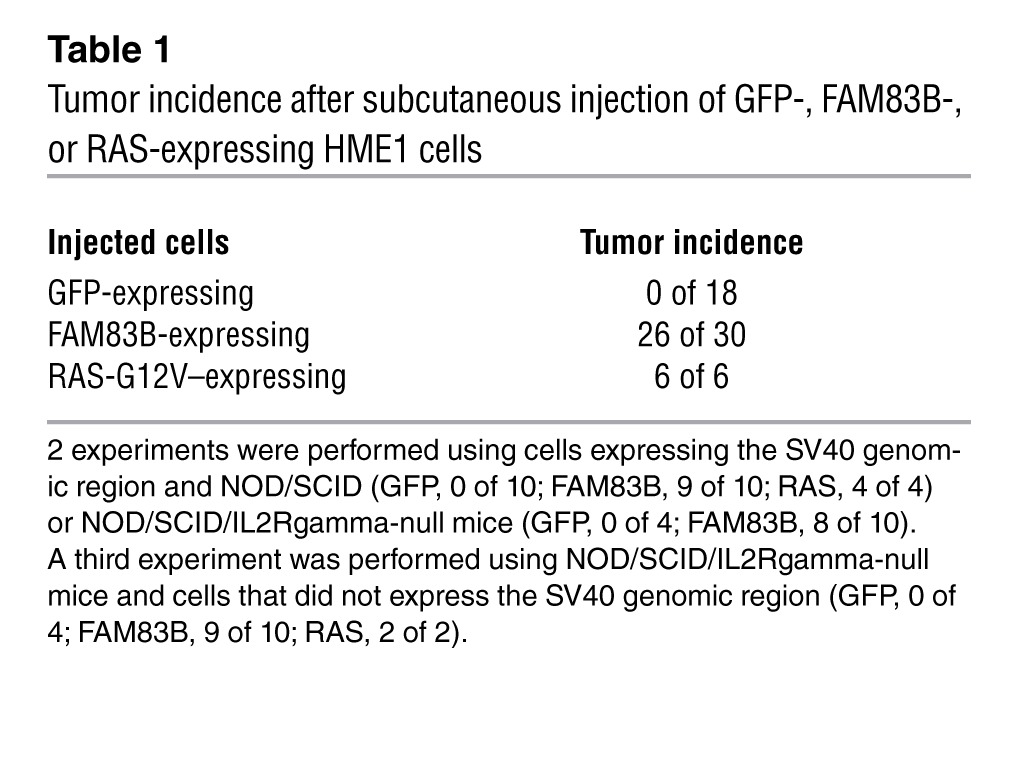
To ensure the AIG observed in the SD3-5 mutant during the original screen was caused specifically by FAM83B, the cDNAs encoding full-length FAM83B and truncated VBIM-FAM83B proteins were cloned and expressed in naive HME1 cells. Both FAM83B proteins promoted AIG (Figure 2, A–C), confirming the results obtained with the original SD3-5 mutant. In addition, FAM83B-expressing HME1 cells formed tumors in immunodeficient mice (Table 1), confirming its function as a transforming oncogene. Using public microarray data, we found a significant elevation of FAM83B mRNA expression in breast cancer specimens (Figure 2D and refs. 3, 4). Additional analysis of FAM83B in human tumors was performed using real-time PCR confirming that FAM83B mRNA expression was elevated relative to the normal associated tissue in a number of cancers, including breast, lung, ovary, cervical, testis, thyroid, bladder, and lymphoid cancers (Figure 2, E and F, and Supplemental Table 1). Furthermore, analysis of FAM83B expression in matched normal lung tissue and lung tumors confirmed that FAM83B expression was significantly elevated in lung tumor specimens relative to normal lung tissue (Figure 2G). Finally, elevated expression of FAM83B was observed (a) in specific cancer subtypes, (b) with increased tumor grade, and (c) with decreased overall survival (Supplemental Table 1). Taken together, our data demonstrate that FAM83B drove HMEC transformation and that FAM83B mRNA was elevated in a sizeable fraction of human cancers and may prove to be a suitable prognostic marker.
Figure 2. FAM83B drives AIG in HME1 cells and is elevated in human cancer specimens.
(A and B) HME1 cells were infected with a retrovirus encoding full-length FAM83B, VBIM-FAM83B, or a control retrovirus and analyzed for AIG. Original magnification, ×10. (C) Western analysis for FAM83B expression. (D) Microarray data sets E-MEXP-882 (4 normal, 18 cancerous) and E-TABM-276 (4 normal, 13 cancerous), acquired from Array Express, were used to examine transcriptional changes between normal (N) and cancerous (C) human breast tissues. (E and F) Origene TissueScan Cancer Panels (48-well breast cancer panels and a 384-well multi-cancer survey panel) were analyzed by real-time PCR for FAM83B. Shown is relative FAM83B expression for specimens that had a statistically significant difference between cancerous and associated normal tissues. n = 2 (normal bladder), 3 (normal thyroid and normal ovary), 4 (normal lung and normal cervix), 6 (normal testis), 9 (cancerous cervix), 16 (normal breast), 18 (cancerous thyroid), 19 (cancerous lung and cancerous testis), 21 (cancerous ovary), 22 (cancerous bladder), 191 (cancerous breast). (G) Relative expression of FAM83B in a panel of matched lung cancer and associated normal lung tissues. Each normal tissue was set equal to 1.
Table 1.
Tumor incidence after subcutaneous injection of GFP-, FAM83B-, or RAS-expressing HME1 cells
Inhibition of FAM83B suppresses the growth of breast cancer cells.
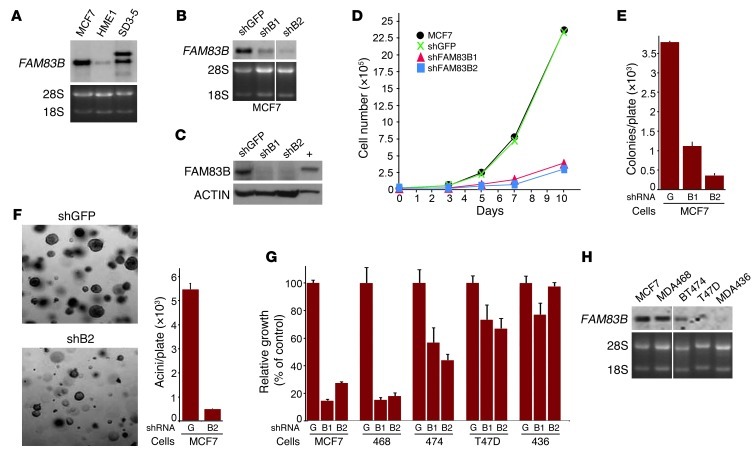
In 2 independent NCI-60 microarray data sets, MCF7 breast carcinoma cells had elevated FAM83B mRNA levels. Northern analysis confirmed that FAM83B levels were similar in MCF7 and SD3-5 mutant cells, and both were substantially higher than in HME1 cells (Figure 3A). To further substantiate that FAM83B expression is a critical mediator of transformation, we examined whether its ablation would alter MCF7 proliferation and colony formation. 4 shRNAs targeting FAM83B (shRNA1–shRNA4) or a control shRNA (GFP) were delivered to MCF7 cells by lentiviral infection, and the efficiency of knockdown was examined by Northern and Western analysis (Figure 3, B and C, and Supplemental Figure 2). Cells expressing the FAM83B shRNAs were plated and grown for various times, and cell number was determined (Figure 3D and Supplemental Figure 2). Whereas parental MCF7 and shGFP-expressing cells grew similarly, the growth of cells expressing FAM83B shRNAs was significantly inhibited, by 84%–87%, at the 10-day time point (Figure 3D). Also, MCF7 AIG and growth in laminin-rich basement membrane (lrBM) was inhibited by 70%–90% when FAM83B expression was suppressed by shRNA (Figure 3, E and F).
Figure 3. Inhibition of FAM83B suppresses breast cancer cell growth.
(A) Northern analysis of FAM83B expression was performed using RNA from MCF7, HME1, and SD3-5 mutant cells. (B–D) MCF7 cells were infected with lentiviruses encoding a shRNA targeting GFP or 2 different shRNAs targeting FAM83B (B1 and B2). (B) Northern analysis. (C) Western analysis, performed using a rabbit polyclonal FAM83B antibody. (D) Cells were plated and grown for 3, 5, 7, or 10 days, and the cell number was determined. (E) Ablation of FAM83B by shRNA inhibited MCF7 AIG compared with control cells expressing a shRNA targeting GFP. (F) MCF7 cells expressing a shRNA targeting GFP or FAM83B were grown as 3D cultures in lrBM. Images were taken, and acini number was determined. Original magnification, ×10. (G) MCF7, MDA468, BT474, T47D, and MDA436 cells were infected with shRNA targeting GFP or FAM83B, and cell number was assessed. (H) Northern analysis of breast cancer cells for FAM83B. All experiments were performed in triplicate, and mean ± SD are shown. Lanes in B and H were run on the same gel but were noncontiguous (white lines).
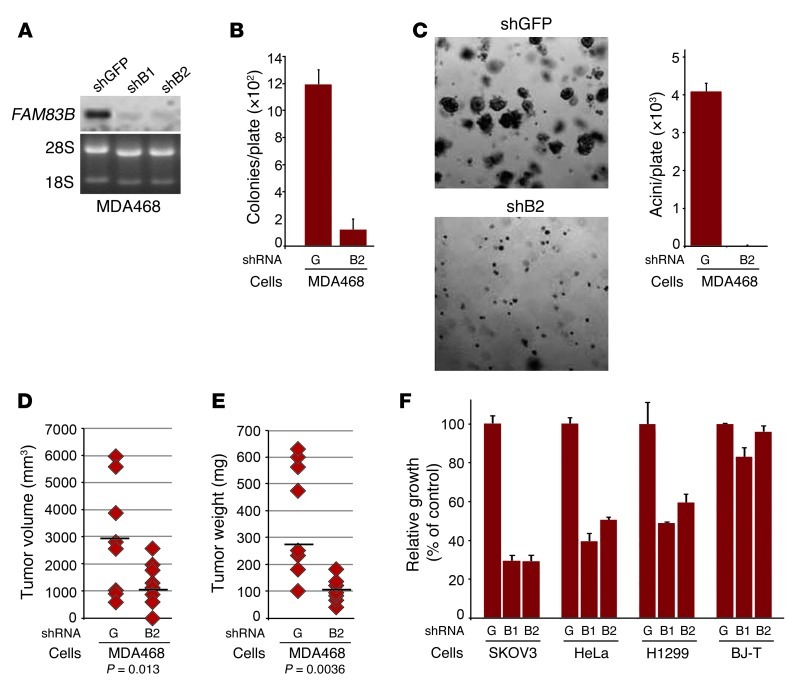
Analysis of additional breast cancer cell lines identified MDA468 cells as equally dependent on FAM83B expression for growth, whereas other cell lines were either moderately affected (BT474 and T47D) or unaffected (MDA436) by FAM83B knockdown (Figure 3G). Notably, the inhibitory effect of the FAM83B shRNAs correlated with the level of FAM83B expressed in the parental cancer cell lines (Figure 3H). Further analysis of MDA468 cells demonstrated that ablation of FAM83B resulted in strong inhibition of AIG, growth in lrBM, and tumorigenicity (both tumor volume and tumor weight; P = 0.013 and P = 0.0036, respectively) compared with control cells (Figure 4, A–E). Furthermore, ablation of FAM83B from lung, ovarian, and cervical cancer cells (H1299, SKOV3, and HeLa), which were derived from tumor tissues with significant elevation of FAM83B mRNA (Figure 2F), also resulted in growth inhibition (Figure 4F). In contrast, normal human fibroblasts, which lack detectable levels of FAM83B, were unaffected by the FAM83B shRNAs. These data demonstrate that tumor-derived cells had dependence for sustained FAM83B expression to maintain their growth and tumorigenicity, further supporting the potential of targeting FAM83B for therapeutic intervention.
Figure 4. Inhibition of FAM83B suppresses the tumorigenicity and growth of cancer cells.
(A) Northern analysis of FAM83B expression in MDA468 cells. (B and C) Ablation of FAM83B by shRNA inhibited MDA468 AIG and acini formation in lrBM. Original magnification, ×10. (D and E) MDA468 cells were infected with shRNAs targeting GFP (G) or FAM83B (B2) and injected subcutaneously into immunocompromised mice to assess tumor formation; both tumor volume and tumor size are shown. (F) Ablation of FAM83B in ovarian, cervical, and lung cancer cell lines inhibited their growth. SKOV3, HeLa, and H1299 cancer cell lines and normal diploid BJ fibroblasts expressing hTERT (BJ-T) were infected with lentiviruses encoding shRNA targeting GFP or FAM83B, and cell number was assessed 8 days after plating. All experiments were performed in triplicate, and mean ± SD are shown.
The DUF1669 of FAM83B is responsible for AIG in HME1 cells.
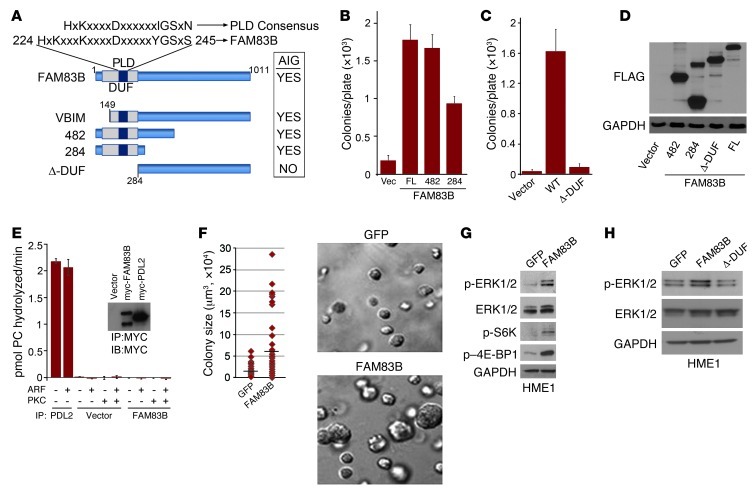
The FAM83B gene was originally annotated as a RefSeq gene (chromosome 6 open reading frame 143) and included as a member of a hypothetical protein family, FAM83, based on the presence of a conserved aminoterminal domain of unknown function (DUF1669) among FAM83 members. FAM83B protein expression has been confirmed in various human cell lines using mass spectrometry (Supplemental Figure 3). DUF1669 is the only predicted functional domain within FAM83B and has been annotated as containing a putative phospholipase D–like (PLD-like) motif. However, the motif in FAM83B (HxKxxxKxxxD) varies from the highly conserved consensus sequence of conventional PLDs (HxKxxxxD; ref. 5 and Figure 5A). Importantly, the putative PLD-like motif present in FAM83B lacks conservation at a critical histidine residue that is present in all bona fide PLD enzymes for catalytic activity (5). To determine whether DUF1669, which comprises amino acids 1–283, is the critical functional domain within FAM83B responsible for its transforming activity, we tested whether expression of FAM83B proteins encoding amino acids 1–284 and 1–482 promoted AIG in HME1 cells. The expression of both truncated proteins promoted HME-1 AIG (Figure 5, B and D). Expression of a FAM83B protein encoding amino acids 284–1,011 (FAM83B–Δ-DUF) failed to promote AIG (Figure 5, C and D). Together, these observations implicate DUF1669 as the critical domain necessary for FAM83B-mediated transformation.
Figure 5. FAM83B and transformation.
(A) Schematic of the FAM83B protein, denoting the domain of unknown function 1669 (DUF1669), the putative PLD-like motif compared with a consensus PLD motif, and the deletion mutants analyzed here. Summary of the FAM83B constructs that drive HMEC AIG. (B and C) The DUF1669 drives AIG. HME1 cells expressing full-length (FL; also denoted WT) FAM83B or FAM83B deletion mutants encoding amino acids 1–482 and 1–284 (denoted 482 and 284, respectively) were assessed for AIG. (D) Immunoblot analysis of FLAG and GAPDH in HME1 cells expressing vector, FAM83B-284, FAM83B-482, the deletion of the DUF1669 (1–283 amino acids), and full-length FAM83B. (E) FAM83B lacks conventional PLD activity. HEK293-TREx cells were transfected with an expression plasmid encoding myc-tagged FAM83B or vector 48 hours prior to cell lysis and immunoprecipitation with a myc-specific antibody. Protein-G agarose-bound myc-FAM83B was assayed for phosphatidylcholine hydrolysis in the presence of known PLD1 activators ARF GTPase and PKC. Myc immunoprecipitates from vector or myc-PLD2–transfected cells served as negative and positive controls, respectively. The graph is a representative figure from the HEK293 immunoprecipitations (n = 3 experiments). (F) HME1 cells expressing GFP or FAM83B were grown as 3D cultures in lrBM. Images were taken, and colony size was determined using MetaMorph image quantitation software. Original magnification, ×10. (G) FAM83B expression activated MAPK and mTOR signaling. Immunoblot analysis of phospho-ERK1/2, phospho-S6K, phospho–4E-BP1, ERK1/2, and GAPDH in HME1 cells expressing GFP or FAM83B. (H) Immunoblot analysis of phospho-ERK1/2, ERK1/2, and GAPDH in HME1 cells expressing GFP, full-length FAM83B, or FAM83B–Δ-DUF.
Phospholipase D (PLD) activity results in the hydrolysis of phosphatidylcholine into phosphatidic acid (PA) and choline (6, 7). Since FAM83B contains a PLD-like motif within the DUF1669, we sought to determine whether FAM83B itself might have conventional PLD catalytic activity. In a PLD exogenous assay (8), neither recombinant FAM83B or FAM83B immunoprecipitated from human cells conferred hydrolysis of phosphatidylcholine, even in the presence of ARF GTPase and PKC, which are established activators of PLD1 (Figure 5E). In addition, FAM83B was unable to directly modulate PLD1 activity in an in vitro assay (Supplemental Figure 4). Since we could not detect FAM83B-mediated PLD activity in exogenous PLD assays, we concluded that FAM83B does not have conventional PLD catalytic activity.
Elevated FAM83B expression stimulates aberrant activation of MAPK and mTOR signaling and confers resistance to EGFR-TKIs.
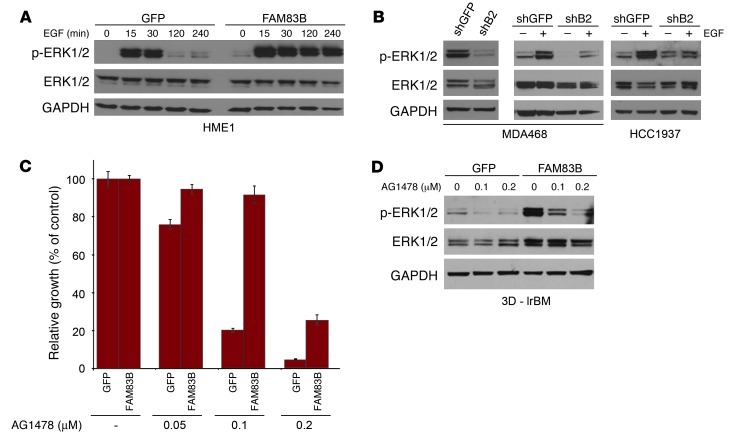
Since FAM83B was able to substitute for RAS in our forward genetic screen, we next examined whether downstream effectors of RAS such as AKT/mTOR and MAPK had altered activities in FAM83B-expressing cells. HME1 cells expressing GFP or FAM83B were grown in lrBM, colony size was measured, and Western analysis was performed (Figure 5, F and G). FAM83B expression resulted in increased acini size, elevation of basal ERK1/2 phosphorylation, and mTOR activation, as measured by S6K and 4E-BP1 phosphorylation. In addition, the truncated VBIM-FAM83B protein activated ERK1/2 as efficiently as full-length FAM83B, while the FAM83B–Δ-DUF protein failed to activate ERK1/2 (Supplemental Figure 5 and Figure 5H), implicating DUF1669 as the critical domain necessary for increased ERK1/2 phosphorylation by FAM83B. To assess the role of FAM83B in growth factor–mediated MAPK signaling, GFP- or FAM83B-expressing cells were deprived of growth factors, stimulated with EGF, and analyzed at various times after stimulation. Elevated FAM83B expression prolonged EGF-stimulated ERK1/2 phosphorylation compared with control cells (Figure 6A). Conversely, ablation of FAM83B from MDA468 cells resulted in diminished basal and EGF-stimulated ERK1/2 phosphorylation (Figure 6B). A similar inhibition of EGF-stimulated ERK1/2 phosphorylation was observed in HCC1937 cells, another EGF-dependent breast cancer cell line (Figure 6B). HCC1937 cells had elevated FAM83B mRNA levels and were also growth inhibited after FAM83B ablation (Supplemental Figure 6). The observed decrease in ERK1/2 phosphorylation was only observed in cancer cell lines that were dependent on FAM83B expression for growth. MDA436 and T47D breast cancer cells were not growth inhibited by FAM83B ablation, and no decrease in ERK1/2 phosphorylation was observed compared with control cells (Figure 3G and Supplemental Figure 7).
Figure 6. EGFR signaling is dependent on FAM83B expression.
(A) HME1 cells expressing GFP or FAM83B were grown in the absence of mammary epithelial growth supplement for 24 hours and then treated with 10 ng/ml EGF for 15, 30, 120, and 240 minutes. Immunoblot analysis of phospho-ERK1/2, ERK1/2, and GAPDH was performed. (B) Immunoblot analysis of phospho-ERK1/2, ERK1/2, and GAPDH was performed on extracts from MDA468 cells expressing a shRNA targeting GFP or FAM83B (shB2). MDA468 and HCC1937 cells expressing a shRNA targeting GFP or FAM83B were serum starved for 48 hours and then treated with EGF for 20 minutes. Immunoblot analysis of phospho-ERK1/2, ERK1/2, and GAPDH was performed. (C) FAM83B conferred decreased sensitivity to EGFR inhibition. HME1 cells expressing GFP or FAM83B were treated with EGFR inhibitor AG1478 at 50, 100, and 200 nM, and cell number was quantified 5 days later. (D) HME1 cells expressing GFP or FAM83B were grown as 3D cultures in lrBM in the presence and absence of AG1478 (100 and 200 nM) for 10 days. Immunoblot analysis of phospho-ERK1/2, ERK1/2, and GAPDH was performed.
Given the important role of elevated FAM83B expression in both basal and EGFR-mediated MAPK signaling, we next examined whether elevated expression of FAM83B could confer resistance to EGFR–tyrosine kinase inhibitors (EGFR-TKIs). Interestingly, Lee et al. have identified another FAM83 member, FAM83A, based on its ability to confer resistance to EGFR-TKIs in a forward genetics cDNA library screen (9). Similar to their findings, we found that FAM83B-expressing cells had sustained ERK1/2 phosphorylation and enhanced proliferation in the presence of EGFR-TKIs (AG1478, erlotinib, and CL387785) compared with control cells (Figure 6, C and D, and Supplemental Figure 8). In addition, FAM83B-expressing cells also grew significantly better than control cells after growth factor withdrawal (Supplemental Figure 9). Taken together, our results suggest that tumors with elevated FAM83B have acquired self-sufficient growth signaling and decreased sensitivity to EGFR-TKIs due to hyperactivated MAPK signaling.
FAM83B-mediated transformation requires CRAF and mTOR signaling.
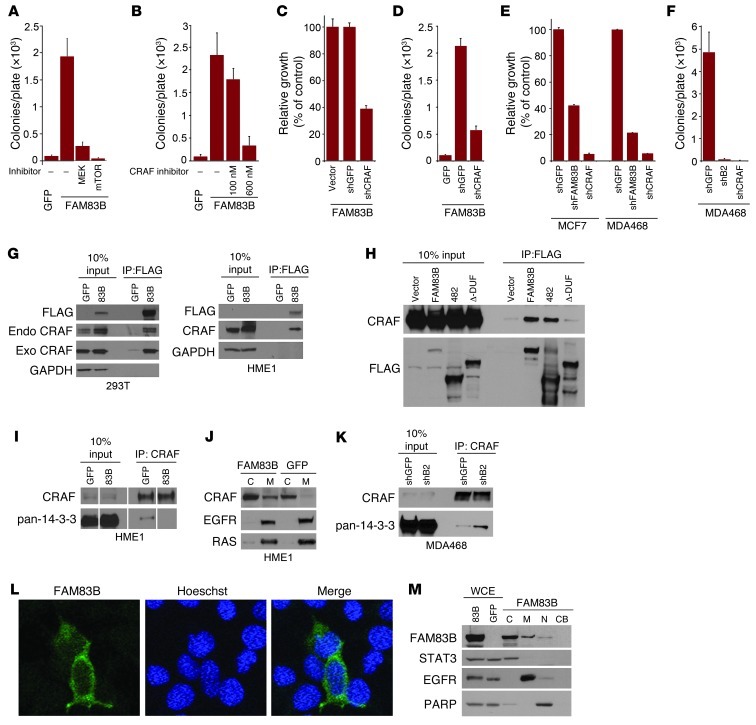
Given that MAPK and mTOR signaling were activated after FAM83B expression, we next examined whether inhibition of either pathway prevented FAM83B-mediated transformation. First, we treated FAM83B-expressing HME1 cells with inhibitors of MEK (U0126), mTOR (rapamycin), or CRAF (RAF kinase inhibitor I) and observed a strong inhibition of FAM83-mediated AIG (Figure 7, A and B). Similarly, the growth of MCF7 and MDA468 cancer cell lines, which are sensitive to FAM83B ablation, were also suppressed by CRAF, MEK, or mTOR inhibitors (Supplemental Figure 10). Rapamycin and other mTOR inhibitors are known to induce feedback activation of ERK1/2 and AKT signaling (10). Interestingly, we observed an increase in ERK activation and a suppression of AKT activation in FAM83B-expressing cells after rapamycin treatment compared with control cells (Supplemental Figure 11). This observation may indicate that FAM83B regulates the MAPK and PI3K-AKT pathways independently; however, additional studies will be necessary to define the role of FAM83B in the regulation of PI3K-AKT signaling.
Figure 7. FAM83B-mediated transformation requires CRAF and mTOR signaling.
(A and B) FAM83B-expressing HME1 cells were treated with U0126 (1.5 μM), rapamycin (11 nM), or RAF kinase inhibitor I (100 and 600 nM) and assessed for AIG. (C and D) HME1 cells expressing FAM83B were infected with lentiviruses encoding shRNA targeting GFP or CRAF and assessed for growth and AIG. (E) MCF7 and MDA468 cells expressing shRNA targeting GFP, CRAF, or FAM83B were assessed for growth. (F) MDA468 cells expressing shRNA targeting GFP, CRAF, or FAM83B were assessed for AIG. (G) 293T cells were transfected with expression constructs encoding CRAF, GFP, and FAM83B, and immunoprecipitation was performed. Immunoprecipitation was also performed on lysates from HME1 cells stably expressing GFP or FAM83B. (H) 293T cells were transfected with expression constructs encoding CRAF, GFP, full-length FAM83B, FAM83B-482, and FAM83B-ΔDUF1669, and immunoprecipitation was performed. (I) Immunoprecipitation was performed on lysates from HME1 cells stably expressing GFP or FAM83B. (J) Cytoplasmic (C) and membrane (M) fractions from HME1 cells expressing GFP or FAM83B were analyzed by Western blotting. (K) Immunoprecipitation was performed on lysates from MDA468 cells expressing shRNA targeting GFP or FAM83B. (L) Immunofluorescence using confocal microscopy was performed in 293T cells transfected with GFP or FAM83B. Original magnification, ×63. (M) Whole cell extract (WCE), cytoplasmic (C), membrane (M), nuclear (N), and chromatin-bound (CB) fractions from 293T cells expressing GFP or FAM83B were analyzed by Western blotting. All experiments were performed in triplicate, and mean ± SD are shown. Lanes in I were run on the same gel but were noncontiguous (white lines).
Next, we inhibited CRAF expression in FAM83B-expressing HME1 cells, MCF7 cells, and MDA468 cells using a CRAF-specific shRNA (Supplemental Figure 12). Again, the proliferation and AIG of FAM83B-expressing HME1 cells were strongly suppressed after ablation of CRAF (Figure 7, C and D), consistent with the results obtained using inhibitors. In addition, MDA468 and MCF7 proliferation and AIG were suppressed equally by FAM83B or CRAF ablation (Figure 7, E and F). Together, these data demonstrate that the pathways implicated in FAM83B-mediated transformation of HME1 cells are also essential for the transformed phenotype of breast tumor cell lines with elevated FAM83B expression.
To define the mechanism by which FAM83B activates MAPK signaling, we examined whether CRAF coprecipitated with FAM83B. Both exogenous and endogenous CRAF efficiently coprecipitated with FAM83B in 2 cellular models (Figure 7G). Next, we examined whether the DUF1669 of FAM83B was able to coprecipitate with CRAF. Both FAM83B-482 and full-length FAM83B coprecipitated with CRAF, whereas FAM83B–Δ-DUF was unable to coprecipitate with CRAF (Figure 7H). Therefore, DUF1669 was required for CRAF binding, AIG, and the increased phosphorylation of ERK1/2 compared with control cells (Figure 5, B, C, and H, and Figure 7H). Regulation of CRAF kinase activity involves the binding of 14-3-3 proteins, which maintain CRAF in an inactive conformation in the cytoplasm (11, 12). Displacement of 14-3-3 proteins allows CRAF translocation to the plasma membrane and subsequent activation of its kinase activity, resulting in the phosphorylation and activation of downstream MAPK proteins MEK and ERK (11, 12). We hypothesized that elevated FAM83B expression and the resulting increase in FAM83B/CRAF complexes would disrupt CRAF/14-3-3 interactions and increase the localization of CRAF to the membrane.
To test this, we immunoprecipitated CRAF from control or FAM83B-expressing HME1 cells and examined the amount of coprecipitated 14-3-3 proteins by Western analysis using a pan–14-3-3 antibody. Indeed, significantly less 14-3-3 protein was coprecipitated with CRAF (Figure 7I). In addition, we observed a significant increase in the amount of membrane-localized CRAF in FAM83B-expressing cells compared with control cells (Figure 7J). Together, our data suggest that the increased levels of FAM83B observed in many cancers results in the displacement of inhibitory 14-3-3 proteins from CRAF, increased localization of CRAF to the membrane, and activation of MAPK (13) — and, consequently, mTOR (14) — signaling. Conversely, ablation of FAM83B expression from MDA468 cells resulted in increased CRAF/14-3-3 binding, which is consistent with the decreased proliferation, AIG, tumorigenicity, and MAPK signaling described above (Figure 4, A–E, Figure 6B, and Figure 7K). Using confocal microscopy and cellular fractionation, we determined that FAM83B was localized primarily in the cytoplasmic and membrane fractions, similar to CRAF (Figure 7, L and M). Our results suggest that the therapeutic targeting of FAM83B may restore the inhibitory function of the 14-3-3 proteins and suppress MAPK activation and ultimately tumor growth.
Although our data are strongly supportive of a critical role for MAPK signaling in FAM83B-induced transformation, we cannot rule out that the transforming activity of FAM83B is due to the activation of additional pathways. In fact, Lee et al. demonstrated that FAM83A can activate both MAPK and PI3K-AKT signaling (9). Upon analysis of GFP- and FAM83B-expressing cells stimulated with EGF, we also noted prolonged AKT and EGFR phosphorylation, similar to our observation of MAPK signaling (Supplemental Figure 13). The regulation of EGFR and PI3K-AKT signaling by FAM83A and FAM83B is currently under investigation. Importantly, RAS activity was unchanged by FAM83B expression, as determined by analysis of RAS-GTP levels in FAM83B-expressing cells (Supplemental Figure 14). In addition, MDA468 breast cancer cells infected with lentiviruses encoding shRNA targeting GFP or FAM83B had no difference in the amount of active RAS-GTP (Supplemental Figure 15), which indicates that FAM83B is not directly altering RAS activity.
RAS-mediated transformation requires FAM83B expression.
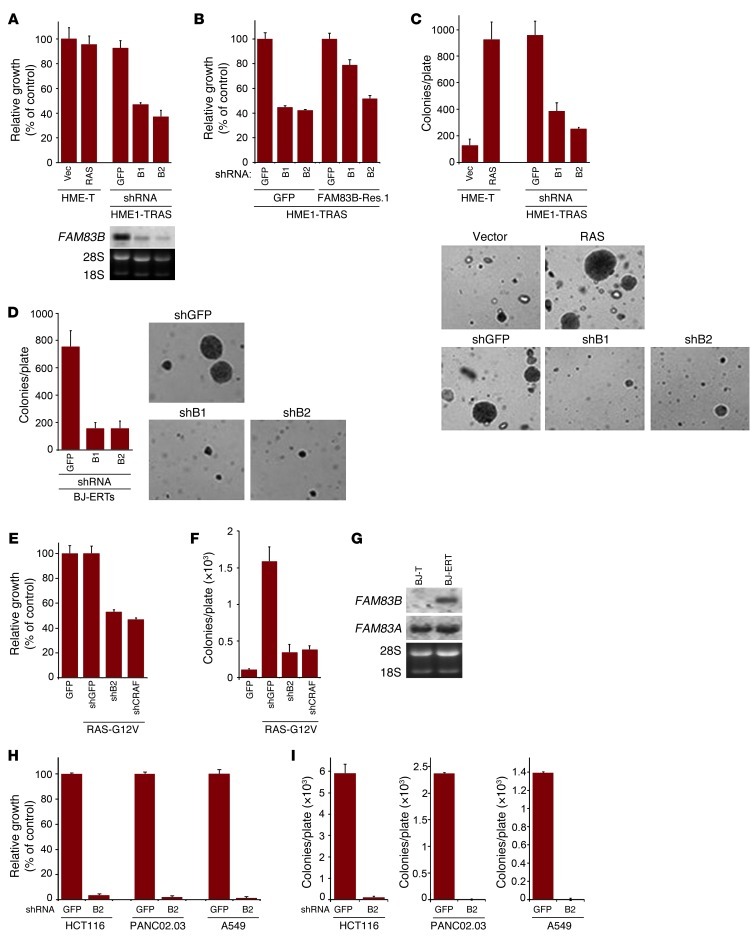
Since CRAF is a critical downstream effector of RAS (15), we hypothesized that FAM83B-mediated CRAF activation is important during RAS-dependent transformation. To test this hypothesis, 2 RAS-dependent transformation models were used. In HME1 cells transformed by RAS (Figure 1B and ref. 16) and BJ fibroblasts transformed by adenoviral E1A, RAS, hTERT, and shp53 (BJ-ERT cells), ablation of FAM83B resulted in a significant decrease in cell number and AIG (Figure 8, A–D). The ectopic expression of a FAM83B cDNA containing synonymous mutations that make it resistant to FAM83B shRNA1 reversed the shRNA-mediated growth inhibition (Figure 8B), confirming FAM83B as the critical target of the shRNA. Again, ablation of CRAF also suppressed RAS-mediated transformation similar to FAM83B ablation (Figure 8, E and F, and Supplemental Figure 12). Interestingly, we observed specific elevation of FAM83B mRNA in BJ-ERT cells compared with control BJ fibroblasts expressing hTERT alone (Figure 8G). Given that the untransformed BJ fibroblasts have undetectable levels of FAM83B expression, our data implicate the induced expression of FAM83B as a key requirement for the transformed phenotype in this fibroblast model. We next examined whether cancer cell lines harboring mutant RAS were also dependent on sustained FAM83B expression. HCT116 (colon), A549 (lung), and PANC02.03 (pancreatic) cells were infected with lentiviruses encoding shRNA targeting GFP or FAM83B. In all 3 cell lines, expression of a shRNA targeting FAM83B resulted in decreased FAM83B expression, growth, and AIG compared with control cells expressing a shRNA targeting GFP (Supplemental Figure 16 and Figure 8, H and I). Taken together, our data suggest that tumors harboring constitutive RAS signaling or hyperactive EGFR signaling may be treated by therapeutically targeting FAM83B.
Figure 8. RAS-mediated transformation requires FAM83B expression.
(A) HME1 cells expressing SV40 Large T (HME1-T) were infected with a retrovirus encoding RAS, or a control (vector; Vec). The RAS-expressing HME1-T cells (HME1-TRAS) were subsequently infected with lentiviruses encoding shRNA targeting FAM83B (denoted B1 and B2) or GFP. The cells were plated for 5 days, and growth was assessed. Northern analysis confirmed the knockdown of FAM83B mRNA relative to the control shRNA. (B) HME1-TRAS cells expressing either GFP or FAM83B-Res.1 (resistant to shRNA1) were infected with lentiviruses encoding shRNA targeting FAM83B or GFP, and growth was assessed. (C) HME1-T cells expressing vector, RAS alone, or RAS together with shRNAs targeting FAM83B or GFP were assessed for AIG. Original magnification, ×10. (D) BJ-ERT cells were infected with a lentivirus expressing a shRNA targeting p53. These cells were subsequently infected with lentiviruses encoding control or FAM83B shRNA and assessed for AIG. Original magnification, ×10. (E) HME1 cells expressing RAS were infected with lentiviruses encoding shRNA targeting GFP, FAM83B, or CRAF. The cells were plated for 5 days, and growth was assessed. (F) HME1 cells expressing RAS were infected with lentiviruses encoding shRNA targeting GFP, FAM83B, or CRAF and assessed for AIG. (G) Northern analysis of FAM83A and FAM83B in BJ fibroblasts expressing hTERT alone (BJ-T) or together with adenoviral E1A and RAS (BJ-ERT). (H and I) HCT116 (colon), PANC02.03 (pancreatic), and A549 (lung) cancer cells were infected with lentiviruses encoding shRNA targeting GFP or FAM83B and assessed for growth and AIG.
Discussion
We have used a phenotypic forward genetic approach, VBIM, to identify a putative oncogene that was able to drive the transformation of immortalized HMECs and was substantially elevated in a sizeable fraction of human cancers. Furthermore, analysis of tumor microarray datasets demonstrated elevated expression of FAM83B (a) in specific cancer subtypes, (b) with increased tumor grade, and (c) with decreased overall survival (Supplemental Table 1). For example, the increased expression of FAM83B was significantly associated with estrogen receptor– (ER-) and progesterone receptor–negative (PR-negative) breast tumors, with higher grade and poor outcome. The lack of ER and PR expression is a key property that is used to define the highly aggressive basal or triple-negative breast cancer subtypes, which are less responsive to standard systemic chemotherapies. Further analysis of FAM83B protein expression in large sets of cancer specimens is an important next step in confirming its role as a novel human oncogene, but this will involve the development of antibodies suitable for immunohistochemistry. Given the data presented here, we suggest that our discovery of FAM83B as an intermediary in MAPK signaling may provide the basis for the development of novel therapeutics for these aggressive cancers, which have traditionally been difficult to treat.
Importantly, while we describe the discovery of FAM83B and the mechanism of FAM83B-mediated MAPK activation here, there are 7 additional FAM83 members classified as a protein family (FAM83) based solely on the presence of the highly conserved DUF1669. While all FAM83 members share conservation in the N-terminal DUF1669, they vary greatly in size and lack any significant homology beyond this domain. Interestingly, FAM83A has been identified as a lung cancer biomarker, reported to be elevated in approximately 70% of lung adenocarcinomas (17). In addition, FAM83A is overexpressed in breast cancer, is associated with poor prognosis, activates MAPK and PI3K-AKT signaling, and confers decreased sensitivity to EGFR-TKIs (9). Analysis of publically available microarray data revealed that many of the FAM83 members were also overexpressed in cancer. While it is tempting to speculate that the conserved DUF1669 present in FAM83 members confers oncogenic potential to each, additional studies will be needed to define whether each of the FAM83 members can be classified as oncogenes.
Although therapies targeting CRAF/MAPK and mTOR signaling have been proposed for cancer treatment, inhibiting CRAF and mTOR directly may be limited by the small therapeutic window between normal and cancer cells. Rather, the identification of proteins that are differentially expressed between normal and cancer cells and participate in the activation of CRAF/MAPK would be exciting potential targets that, if inhibited, could selectively kill tumor cells and extend the life of patients. FAM83B may serve as such a target, since it was significantly elevated in many cancers relative to normal tissues and involved in EGFR-mediated signaling and RAS-mediated transformation. In addition to the role of FAM83B in MAPK activation, we also observed enhanced EGFR and PI3K-AKT activation in FAM83B-expressing cells. These data suggest that FAM83B may participate in yet-unidentified signaling pathways and that CRAF-MAPK signaling alone may not be sufficient for FAM83B-mediated transformation. For example, mass spectrometry data implicate numerous kinases in the phosphorylation and potential regulation of FAM83B, including EGFR, MET, PDK, AKT, RSK, and PKC. Identifying whether these kinases contribute to FAM83B-mediated transformation will be a key area of future research.
The potential involvement of FAM83B in additional signaling pathways may enhance our ability to target FAM83B therapeutically. Our data demonstrate that ablation of FAM83B from tumor-derived breast cancer cells increased the interaction between CRAF and regulatory 14-3-3 proteins, resulting in diminished basal and EGF-stimulated MAPK signaling that was sufficient to decrease proliferation and tumorigenicity in vivo. Moreover, we suggest that the level of FAM83B expressed in tumor cells may influence the sensitivity to EGFR-TKI treatment. Approximately 30% of breast cancers overexpress EGFR, which correlates with loss of estrogen responsiveness and poor prognosis (18), yet TKIs have thus far had low clinical value for breast cancer patients (19). Given the requirement for FAM83B as an activator of CRAF/MAPK in EGFR and RAS signaling, the levels of FAM83B and FAM83A (9) may be important to consider when determining which patients receive TKI treatment. Furthermore, although RAS point mutations are infrequent in breast cancer (less than 5%), they are far more common in other cancers (50% of colon and thyroid cancers; 90% of pancreatic cancers). However, much like the poor performance of TKIs, the potential of farnesyltransferase inhibitors (FTIs) to target RAS has not been realized (20). Our observation that cancer cells harboring mutant RAS were sensitive to FAM83B ablation lays the foundation for future studies aimed at identifying novel therapies capable of targeting FAM83B.
Methods
Materials.
The subcellular protein fractionation kit was purchased from Thermo Scientific, and the standard protocol was used. EGF was obtained from Sigma-Aldrich; AG1478, RAF kinase inhibitor I, U0126, CL387785, and rapamycin were purchased from Calbiochem; and Matrigel was purchased from BD Biosciences. Erlotinib was purchased from Selleck Chemical. The RAS activation assay was obtained from Upstate, and the standard protocol was used.
Retroviral constructs.
pBabe-puro-cRAF-22W (Addgene plasmid no. 12593) was provided by C.J. Der (University of North Carolina at Chapel Hill, Chapel Hill, North Carolina, USA). pcDNA5/TO-myc-PLD1 and pcDNA5/TO-myc-PLD2 (21) was subcloned into pLNCX2 (Clontech). The lentiviral vectors encoding GFPloxP (WPXL; Addgene plasmid no. 12257) were provided by D. Trono (University of Geneva, Geneva, Switzerland). Ras-V12 was cloned into the BamHI site of WPXL to create RASloxP. The pBabe-puro-Cre was provided by K. Wagner (University of Nebraska Medical Center, Omaha, Nebraska, USA); LNCX2-SV40 Large T was provided by A. Gudkov (Roswell Park Cancer Institute, Buffalo, New York, USA); and pBabe-puro-hTERT, LNCX2-E1a, and LVTHM-shp53 were described previously (22). The FAM83B cDNA (BC112275) was amplified by PCR using primers 5′-CGCGGATCCATGGACTACAAGGACGACGATGACAAGGTGAGACCTCATCAATCTTTCC-3′ and 5′-CCATCGATGTTACAAAGACTGTCCACAATTTTCTTT-3′, which introduced a FLAG tag epitope, and was subsequently cloned into the retroviral vector pLPCX (Clontech). The FAM83B cDNA (BC112275) was subcloned into pcDNA5/TO with an N-terminal myc epitope tag (Invitrogen). The VBIM-FAM83B cDNA was amplified by PCR using RNA isolated from mutant SD3-5 cells and 2 primers (5′-CGCGGATCCCCACAAGGAGACGACCTTCCGG-3′ and 5′-AATATTCCTGAGACGCTGAACTGAACAACC-3′). The VBIM-FAM83B PCR fragment was cloned into LPCX-FLAG-FAM83B using BglII and XhoI. The cDNA for SLC30A7 (BC064692) was PCR amplified using 2 primers, 5′-CGCGGATCCATGGACTACAAGGACGACGATGACAAGGTGTTGCCCCTGTCCATCAAAGAC-3′ and 5′-CCATCGATAAAGCTGGGTACAATGTTTTGG-3′, which introduced an N-terminal FLAG epitope tag, and was subsequently cloned into pLPCX. The VBIM-SLC30A7 cDNA was amplified by PCR using RNA isolated from mutant SD3-1 cells and 2 primers, 5′-CGCGGATCCCCACAAGGAGACGACCTTCCGG-3′ and 5′-CCATCGATAAAGCTGGGTACAATGTTTTGG-3′, and was cloned into pLPCX. All cDNA plasmids were acquired from Open Biosystems, and sequence was verified after PCR.
To create FAM83B truncation mutants, the FAM83B cDNA (BC112275) was amplified by PCR using the primers below, cloned into the pCMV-FLAG2 vector (Sigma-Aldrich), and then subcloned into LPCX. LPCX-FLAG-FAM83B-284 was created using primers 5′-CGCGGATCCATGGACTACAAGGACGACGATGACAAGGTGAGACCTCATCAATCTTTCC-3′ and 5′-CCATCGACTATGCTGATTCTTCCTGAGCAAA-3′; LPCX-FLAG-FAM83B-482 was created using primers 5′-CGCGGATCCATGGACTACAAGGACGACGATGACAAGGTGAGACCTCATCAATCTTTCC-3′ and 5′-CCATCGATCTAGGTTGGCATTCGTTGTTGCAA-3′; LPCX-FLAG-FAM83B–Δ-DUF plasmid was created using primers 5′-CGCGGATCCATGGACTACAAGGACGACGATGACAAGTCATTTGCTCAGGAAGAATCAGCA-3′ and 5′-CCATCGATGTTACAAAGACTGTCCACAATTTTCTTT-3′; LPCX-FLAG-FAM83B-Res. 1, resistant to shRNA B1 (TRCN0000128129), was created using primers 5′-CTGATGATTCCTGTGACGACACGTTGTCTTCAGGGACCTACTGGC-3′ and 5′-GCCAGTAGGTCCCTGAAGACAACGTGTCGTCACAGGAATCATCAG-3′.
Virus production and infection.
Retroviruses were produced as described previously (23). Briefly, retroviral vectors were transfected into Phoenix-Ampho cells together with a packaging plasmid encoding the MLV-gag-pol and env genes. VBIM vector construction and use has been described in detail previously (1). Plasmids encoding shRNAs targeting FAM83A, FAM83B, FAM83D, PLD1, CRAF, or GFP in pLKO.1 were acquired from Open Biosystems and Sigma-Aldrich. Viruses were packaged in 293T cells using the second-generation packaging constructs pCMV-dR8.74 and pMD2G (gifts from D. Trono, University of Geneva, Geneva, Switzerland). Supernatants containing virus were collected at 24 and 48 hours and supplemented with 4 μg/ml polybrene before being frozen in aliquots or used to infect cells for 6–24 hours.
Inverse PCR.
Inverse PCR was performed as described previously (1). Genomic DNA from the mutants was isolated using the Blood and Cell Culture DNA kit (Qiagen). 10 μg genomic DNA was digested with EcoRI and MfeI overnight at 37°C, and 2 μg of this DNA was then ligated with T4 DNA ligase overnight. The reaction products were purified using a Qiagen MinElute PCR purification kit, and one-half of the purified reaction mixture was used for the first PCR reaction, using primers no. 2 (5′-CCAGAGTCACACAACAGACG-3′) and 3 (5′-GTAAGACCACCGCACAGC-3′) in a 50-μl reaction volume, with a Phusion PCR kit (NEB). A second PCR reaction was performed using 0.5 μl of the first PCR reaction mixture, with primers no. 1 (5′-CCAGAGAGACCCAGTACAAGC-3′) and 4 (5′-GATCTTCAGACCTGGAGGAG-3′). PCR products were separated by agarose gel electrophoresis, excised from the gel, and cloned into the pCR8/GW/TOPOTA vector (Invitrogen). DNA sequencing was performed, and the insertion site was identified using bioinformatics from NCBI.
Cell lines and culture conditions.
hTERT-HME1 cells (Clontech) were grown in a humidified atmosphere containing 5% CO2 at 37°C in Medium 171 with mammary epithelial growth supplement (Cascade Biologics), 50 U/ml penicillin, and 50 μg/ml streptomycin sulfate (US Biochemical Corp.), as described previously (24). Cancer cell lines (MCF7, MDA468, MDA436, T47D, BT474, HeLa, H1299, 293T, HCC1937, HCT116, and SKVO3) and normal diploid BJ fibroblasts were grown in a humidified atmosphere containing 5% CO2 in DMEM (with glucose and l-glutamine; Invitrogen) with 5% fetal bovine serum, 50 U/ml penicillin, 50 μg/ml streptomycin sulfate (US Biochemical Corp.). Cancer cell lines A549 and PANC02.03 (obtained from M.-S. Sy, Case Western Reserve University, Cleveland, Ohio, USA) were grown in a humidified atmosphere containing 5% CO2 in RPMI (with l-glutamine; Invitrogen) with 10% fetal bovine serum.
Soft agar assays.
For hTERT-HME1 cells, 1 × 10⁵ cells were suspended in 0.6% type VII agarose (Sigma-Aldrich) and plated onto a bottom layer of 1.2% agar in a 60-mm plate in triplicate, as described previously (2). The medium was changed every 3 days until cells were analyzed after 3 weeks. To quantify colonies, each plate was scanned using an automated multipanel scanning microscope, and the digital images were analyzed using MetaMorph image quantification software. For MCF7, MDA468, HCT116, A549, PANC02.03, and BJ cells, 2 × 10⁵ cells were plated per 60-mm dish, and medium was changed every 3 days until cells were analyzed after 3 weeks. U0126 (1.5 μM), RAF kinase inhibitor I (553008; 100 and 600 nM), and rapamycin (11 nM) were obtained from Calbiochem and added to the medium during feedings for indicated experiments.
Subcutaneous tumorigenicity assays.
NOD/SCID mice were bred and maintained under defined conditions at the Athymic Animal and Xenograft Core facility at Case Western Reserve University, Case Comprehensive Cancer Center, an accredited facility that acts in compliance with NIH guidelines and provides veterinary care by several full-time veterinary personnel. NOD/SCID-IL2Rgamma-null mice were obtained from Jackson Laboratories. MDA468 cancer cells (2 × 10⁶) and HMECs (4 × 10⁶) were suspended in a 1:1 mixture of media and matrigel (BD Biosciences) and injected subcutaneously into mice (6–8 weeks of age) that were sublethally irradiated with 300 rad 4 hours prior to injection. Tumor volume was calculated with the formula 4/3πr3, and Student’s t tests were performed. HME1 cells expressing GFP, RAS-V12, and FAM83B were infected with a retrovirus encoding SV40 Large T genomic to increase the efficiency of tumor take in immunocompromised mice (25). FAM83B-expressing HME1 cells formed tumors when transplanted subcutaneously into immunocompromised mice with a latency of 12 weeks; RAS-V12–expressing HME cells severed as a positive control for tumor formation.
Immunoprecipitation and Western analysis.
Immunoprecipitation experiments were carried out as previously described (26), with exceptions as noted. FAM83B and CRAF were immunoprecipitated using anti-FLAG (M2) affinity gel (Sigma-Aldrich), from both FAM83B-expressing HME1 cells and 293T cells transfected with pBabe-puro-c-RAF-22W (4 μg) and LPCX-FLAG-FAM83B (4 μg), using Lipofectamine 2000 (Invitrogen). CRAF was immunoprecipitated from HME1 cells expressing FAM83B or MDA468 cells expressing a shRNA targeting FAM83B using anti-CRAF conjugated to agarose beads. Whole-cell extracts were prepared by incubating cell pellets in lysis buffer containing 50 mmol/l Tris (pH 8.0), 150 mmol/l NaCl, 1.0% NP40, 10 μg/ml aprotinin, 100 μg/ml phenylmethane sulfonyl fluoride, 5 μg/ml leupeptin, 5 μg/ml pepstatin, and 1 mmol/l NaVO4. Cell extracts containing equal quantities of proteins, determined by the Bradford method, were separated by SDS-PAGE (8%–12.5% acrylamide) and transferred to polyvinylidene difluoride membranes (Millipore). Antibodies to HA (F-7), MYC (9E10), RAF (C12), pan 14-3-3 (H8), PARP (F-2), and EGFR (1005) were from Santa Cruz Biotechnology; antibodies to β-actin (pan Ab-5) were from Neomarkers; antibodies to glyceraldehyde-3-phosphate dehydrogenase were from Calbiochem; antibodies to FLAG (M2) were from Sigma-Aldrich; antibodies for ERK1/2, phospho-ERK1/2 (Thr202/Tyr204), phospho-S6K (Thr389), phospho-EGFR (Tyr1068), EGFR, phospho-AKT (Ser473), AKT, c-RAF, STAT3, and phospho–4E-BP1 (Ser65) were from Cell Signaling; and antibodies to RAS (RAS10) were from Millipore. FAM83B antibodies were generated against recombinant FAM83B protein (Covance). Primary antibodies were detected with goat anti-mouse or goat anti-rabbit conjugated to horseradish peroxidase (Hoffman-La Roche), using enhanced chemiluminescence (Perkin-Elmer).
Relative growth assay.
hTERT-HME1, MCF7, MDA468, BT474, T47D, MDA436, BJ, H1299, SKOV3, HCC1937, HCT116, PANC02.03, A549, and HeLa cells were plated in triplicate at 20,000 cells/well, and cell number was determined on a Beckman Coulter counter. The EGFR inhibitor AG1478 (0.05, 0.1, and 0.2 μM), CL387785 (0.01 and 0.1 μM), erlotinib (0.2 and 0.4 μM), RAF kinase inhibitor I (2, 4, 8, and 16 μM), U0126 (0.4, 0.8, 1.6, and 3.2 μM), or rapamycin (0.04, 0.4, 1, and 2 nM) was added to indicated experiments.
Confocal microscopy.
Immunofluorescence analysis was performed on 293T cells transfected with plasmids encoding GFP or FAM83B. Cells were fixed in 4% paraformaldehyde in PBS for 20 minutes, washed with PBS, and permeabilized in 1% Triton X-100 in PBS for 60 minutes. Slides were blocked with 5% donkey serum in PBS-Tween and incubated with anti-FLAG (M2) conjugated to FITC (Sigma-Aldrich); nuclei were stained by Hoechst stain (Sigma-Aldrich); and slides were mounted with nonfading gel-mount prior to visualization on a Zeiss multiphoton microscope. Confocal images were obtained using a ×63 oil immersion objective. All phase-contrast images were obtained with a ×10 objective using a Leica DMI6000 microscope.
RNA isolation and Northern analysis.
Total RNA was isolated using Qiagen RNeasy miniprep kit (Qiagen). 10–20 μg total RNA was fractionated in a 1% agarose/formaldehyde gel and transferred to a Hybond-XL membrane (Amersham Biosciences) as described previously (27). The RNAs were crosslinked to the membrane by using a UV crosslinker before hybridization. [32P]-dCTP (Perkin Elmer) was used to generate 32P-labeled cDNA fragments of FAM83A, FAM83B, and GAPDH using the Megaprime DNA labeling system (Amersham Biosciences). The membrane was prehybridized for 6 hours with 5× saline-sodium phosphate-EDTA (75 mmol/l NaCl, 50 mmol/l NaH2PO4, and 4 mmol/l EDTA) plus 2% SDS and 100 μg/ml single-stranded DNA at 65°C. After the addition of specific probes, hybridization took place for 24 hours at 65°C. The membranes were washed 3 times with 2× saline-sodium phosphate-EDTA plus 0.1% SDS. Transfers were normalized for loading by comparing the intensities of the 18S and 28S rRNA bands or the GAPDH mRNA levels on the same membranes.
Real-time quantitative PCR and statistical analysis.
TissueScan Cancer Survey Panel 384—I, composed of 381 tissues covering 17 different cancers (Origene); Lung Cancer Panel IV; or Breast Cancer Panels 1, 2, 3, and 4 were subjected to real-time quantitative PCR analysis. RNA was analyzed for FAM83B and actin expression using an Applied Biosystems GeneAMP PCR System 9700 and Applied Biosystems assay Hs00289694_m1. Analysis was performed at the Gene Expression Array Core Facility of the Comprehensive Cancer Center of Case Western Reserve University. The Ct for FAM83B was determined in the 381 specimens within 40 cycles of PCR, or was set equal to 40 if it remained undetected by the 40th cycle. ΔCt was calculated by subtracting the FAM83B gene Ct from the actin Ct for each sample. ΔΔCt was calculated relative to a normal adrenal specimen, and the relative fold change of the samples was determined using the formula =IF(ΔΔCt>0,POWER[2,ΔΔCt]*–1, POWER[2,ABS{ΔΔCt}]). The relative expression within each normal/cancer subtype was calculated by dividing each specimen’s value by the value of the normal tissue with the highest expression within the subtype, such that its value became 1.0. The mean of the normal and cancer specimens was determined, and P values were calculated using unpaired Welch’s t test. The relative expression of the normal and cancer specimens that were significantly different is plotted together in the figures.
Exogenous PLD assays.
Exogenous PLD assays were performed as previously described (8). Samples were generated in triplicate in multiple independent experiments.
Microarray data.
Datasets were acquired from Array Express (accession nos. E-MEXP-882 and E-TABM-276; http://www.ebi.ac.uk/microarray-as/ae/).
Statistics.
Results are expressed as mean ± SD; horizontal bars in scatter graphs denote medians. n is indicated in the figures and/or legends. Paired 2-tailed Student’s t test was used on all animal studies. Welch’s t test was used for comparison of different groups in all relative expression data between normal and cancer specimens. P values of 0.05 or less were considered significant.
Study approval.
All animal experiments were reviewed and approved by the Institutional Animal Care and Use Committee of Case Western Reserve University School of Medicine (Cleveland, Ohio, USA) and were conducted according to the committee’s guidelines.
Supplementary Material
Acknowledgments
We are grateful to Chase Foy for technical help, members of the Jackson and Stark laboratories for helpful discussions, and the core facilities provided by the Case Comprehensive Cancer Center (P30 CA43703; Athymic Animal and Xenograft Core Facility; Gene Expression and Genotyping Core Facility; Cytometry & Imaging Microscopy Core Facility; Radiation Resources Core Facility). This work was supported by the NIH (R01CA138421 to M.W. Jackson; T32CA059366 to R. Cipriano), the Department of Defense Breast Cancer Research Program (BC095847 and BC074072 to M.W. Jackson), and the McDonnell Foundation (to H.A. Brown).
Footnotes
Conflict of interest: The authors have declared that no conflict of interest exists.
Citation for this article: J Clin Invest. 2012;122(9):3197–3210. doi:10.1172/JCI60517.
See the related Commentary beginning on page 3048.
References
- 1.Lu T, et al. Validation-based insertional mutagenesis identifies lysine demethylase FBXL11 as a negative regulator of NFkappaB. Proc Natl Acad Sci U S A. 2009;106(38):16339–16344. doi: 10.1073/pnas.0908560106. [DOI] [PMC free article] [PubMed] [Google Scholar]
- 2.Kan CE, Patton JT, Stark GR, Jackson MW. p53-mediated growth suppression in response to Nutlin-3 in cyclin D1 transformed cells occurs independently of p21. Cancer Res. 2007;67(20):9862–9868. doi: 10.1158/0008-5472.CAN-07-0259. [DOI] [PubMed] [Google Scholar]
- 3.Cheng AS, et al. Epithelial progeny of estrogen-exposed breast progenitor cells display a cancer-like methylome. Cancer Res. 2008;68(6):1786–1796. doi: 10.1158/0008-5472.CAN-07-5547. [DOI] [PMC free article] [PubMed] [Google Scholar]
- 4.Novak P, et al. Epigenetic inactivation of the HOXA gene cluster in breast cancer. Cancer Res. 2006;66(22):10664–10670. doi: 10.1158/0008-5472.CAN-06-2761. [DOI] [PubMed] [Google Scholar]
- 5.Xie Z, Ho WT, Exton JH. Association of N- and C-terminal domains of phospholipase D is required for catalytic activity. J Biol Chem. 1998;273(52):34679–34682. doi: 10.1074/jbc.273.52.34679. [DOI] [PubMed] [Google Scholar]
- 6.Foster DA, Xu L. Phospholipase D in cell proliferation and cancer. Mol Cancer Res. 2003;1(11):789–800. [PubMed] [Google Scholar]
- 7.Shi M, Zheng Y, Garcia A, Xu L, Foster DA. Phospholipase D provides a survival signal in human cancer cells with activated H-Ras or K-Ras. Cancer Lett. 2007;258(2):268–275. doi: 10.1016/j.canlet.2007.09.003. [DOI] [PMC free article] [PubMed] [Google Scholar]
- 8.Brown HA, Henage LG, Preininger AM, Xiang Y, Exton JH. Biochemical analysis of phospholipase D. Methods Enzymol. 2007;434:49–87. doi: 10.1016/S0076-6879(07)34004-4. [DOI] [PubMed] [Google Scholar]
- 9.Lee S-Y, et al. FAM83A confers EGFR-TKI resistance in breast cancer cells and in mice. J Clin Invest. 2012;122(9):3211–3220. doi: 10.1172/JCI60498. [DOI] [PMC free article] [PubMed] [Google Scholar]
- 10.Carracedo A, et al. Inhibition of mTORC1 leads to MAPK pathway activation through a PI3K-dependent feedback loop in human cancer. J Clin Invest. 2008;118(9):3065–3074. doi: 10.1172/JCI34739. [DOI] [PMC free article] [PubMed] [Google Scholar]
- 11.Molzan M, et al. Impaired binding of 14-3-3 to C-RAF in Noonan syndrome suggests new approaches in diseases with increased Ras signaling. Mol Cell Biol. 2010;30(19):4698–4711. doi: 10.1128/MCB.01636-09. [DOI] [PMC free article] [PubMed] [Google Scholar]
- 12.Wellbrock C, Karasarides M, Marais R. The RAF proteins take centre stage. Nat Rev Mol Cell Biol. 2004;5(11):875–885. doi: 10.1038/nrm1498. [DOI] [PubMed] [Google Scholar]
- 13.Kyriakis JM, et al. Raf-1 activates MAP kinase-kinase. Nature. 1992;358(6385):417–421. doi: 10.1038/358417a0. [DOI] [PubMed] [Google Scholar]
- 14.Ma L, Chen Z, Erdjument-Bromage H, Tempst P, Pandolfi PP. Phosphorylation and functional inactivation of TSC2 by Erk implications for tuberous sclerosis and cancer pathogenesis. Cell. 2005;121(2):179–193. doi: 10.1016/j.cell.2005.02.031. [DOI] [PubMed] [Google Scholar]
- 15.Zhang XF, et al. Normal and oncogenic p21ras proteins bind to the amino-terminal regulatory domain of c-Raf-1. Nature. 1993;364(6435):308–313. doi: 10.1038/364308a0. [DOI] [PubMed] [Google Scholar]
- 16.Westbrook TF, et al. A genetic screen for candidate tumor suppressors identifies REST. Cell. 2005;121(6):837–848. doi: 10.1016/j.cell.2005.03.033. [DOI] [PubMed] [Google Scholar]
- 17.Li Y, et al. BJ-TSA-9, a novel human tumor-specific gene, has potential as a biomarker of lung cancer. Neoplasia. 2005;7(12):1073–1080. doi: 10.1593/neo.05406. [DOI] [PMC free article] [PubMed] [Google Scholar]
- 18.Toi M, Osaki A, Yamada H, Toge T. Epidermal growth factor receptor expression as a prognostic indicator in breast cancer. Eur J Cancer. 1991;27(8):977–980. doi: 10.1016/0277-5379(91)90262-c. [DOI] [PubMed] [Google Scholar]
- 19.Mundhenke C, Strauss A, Schem C. Significance of tyrosine kinase inhibitors in the treatment of metastatic breast cancer. Breast Care (Basel). 2009;4(6):373–378. doi: 10.1159/000261705. [DOI] [PMC free article] [PubMed] [Google Scholar]
- 20.Downward J. Targeting RAS signalling pathways in cancer therapy. Nat Rev Cancer. 2003;3(1):11–22. doi: 10.1038/nrc969. [DOI] [PubMed] [Google Scholar]
- 21.Scott SA, et al. Design of isoform-selective phospholipase D inhibitors that modulate cancer cell invasiveness. Nat Chem Biol. 2009;5(2):108–117. doi: 10.1038/nchembio.140. [DOI] [PMC free article] [PubMed] [Google Scholar]
- 22.Patton JT, Mayo LD, Singhi AD, Gudkov AV, Stark GR, Jackson MW. Levels of HdmX expression dictate the sensitivity of normal and transformed cells to Nutlin-3. Cancer Res. 2006;66(6):3169–3176. doi: 10.1158/0008-5472.CAN-05-3832. [DOI] [PubMed] [Google Scholar]
- 23.Cipriano R, Patton JT, Mayo LD, Jackson MW. Inactivation of p53 signaling by p73 or PTEN ablation results in a transformed phenotype that remains susceptible to Nutlin-3 mediated apoptosis. Cell Cycle. 2010;9(7):1373–1379. doi: 10.4161/cc.9.7.11193. [DOI] [PubMed] [Google Scholar]
- 24.Cipriano R, Kan CE, Graham J, Danielpour D, Stampfer M, Jackson MW. TGF-{beta} signaling engages an ATM-CHK2-p53-independent RAS-induced senescence and prevents malignant transformation in human mammary epithelial cells. Proc Natl Acad Sci U S A. 2011;108(21):8668–8673. doi: 10.1073/pnas.1015022108. [DOI] [PMC free article] [PubMed] [Google Scholar]
- 25.Elenbaas B, et al. Human breast cancer cells generated by oncogenic transformation of primary mammary epithelial cells. Genes Dev. 2001;15(1):50–65. doi: 10.1101/gad.828901. [DOI] [PMC free article] [PubMed] [Google Scholar]
- 26.Jackson MW, Berberich SJ. MdmX protects p53 from Mdm2-mediated degradation. Mol Cell Biol. 2000;20(3):1001–1007. doi: 10.1128/MCB.20.3.1001-1007.2000. [DOI] [PMC free article] [PubMed] [Google Scholar]
- 27.Jackson MW, et al. Limited role of N-terminal phosphoserine residues in the activation of transcription by p53. Oncogene. 2004;23(25):4477–4487. doi: 10.1038/sj.onc.1207575. [DOI] [PubMed] [Google Scholar]
Associated Data
This section collects any data citations, data availability statements, or supplementary materials included in this article.


