

Abstract
Chemotactic cytokines (chemokines) can help regulate tumor cell invasion and metastasis. Here, we show that chemokine 25 (CCL25) and its cognate receptor chemokine receptor 9 (CCR9) inhibit colorectal cancer (CRC) invasion and metastasis. We found that CCR9 protein expression levels were highest in colon adenomas and progressively decreased in invasive and metastatic CRCs. CCR9 was expressed in both primary tumor cell cultures and colon-cancer-initiating cell (CCIC) lines derived from early-stage CRCs but not from metastatic CRC. CCL25 stimulated cell proliferation by activating AKT signaling. In vivo, systemically injected CCR9+ early-stage CCICs led to the formation of orthotopic gastrointestinal xenograft tumors. Blocking CCR9 signaling inhibited CRC tumor formation in the native gastrointestinal CCL25+ microenvironment, while increasing extraintestinal tumor incidence. NOTCH signaling, which promotes CRC metastasis, increased extraintestinal tumor frequency by stimulating CCR9 proteasomal degradation. Overall, these data indicate that CCL25 and CCR9 regulate CRC progression and invasion and further demonstrate an appropriate in vivo experimental system to study CRC progression in the native colon microenvironment.
Introduction
Colorectal cancer (CRC) is a leading cause of cancer death worldwide. CRC progresses through multiple distinct stages in its evolution. Morphologically, inappropriate proliferation and antiapoptosis cause formation of adenomas, which evolve into preinvasive carcinoma in situ. Then, preinvasive CRCs acquire the ability to invade through the submucosa and muscularis, metastasize, and survive outside the colon microenvironment niche (1–3). Mechanistically, mutations activating WNT signaling in transformed colon cancer cells are an early event (4–6). Subsequently, mutations in KRAS, TGFBR1, BRAF, TP53, DNA mismatch repair genes, FBXW7, NOTCH, PI3 kinase, and other signaling pathways accumulate to promote CRC tumor progression to invasive and metastatic disease (7–11). As 5-year survival for early-stage CRC is approximately 90% compared with 15% for metastatic CRC, understanding in great detail the mechanisms that regulate the transition from indolent (adenomas and carcinoma in situ) to locally invasive early clinical stage (stage I/II) and metastatic later stage (stage III/IV) CRC is critical to improving patient outcomes (12).
Chemotactic cytokines (chemokines) are a family of secreted ligands that play important roles in regulating lymphocyte intracellular and intercellular signaling, antiapoptosis, and trafficking among different organs, such as bone marrow and intestinal mucosa (13). The G protein–coupled chemokine receptor 9 (CCR9) and its ligand chemokine 25 (CCL25) comprise a signaling axis that is particularly important for the small intestine and colon. Small intestine and colon epithelial cells produce CCL25 (14–17). This attracts circulating CCR9+ T cells to intravasate into the gut toward the CCL25 source. CCL25 binding promotes CCR9 Gβγ interaction with PI3 kinase, which initiates a downstream cascade activating AKT kinase. AKT phosphorylates several targets, including GSK3B, promoting T cell proliferation, antiapoptosis, and mucosal immunity (14, 15, 18–20). In addition to producing CCL25, small intestine and colon epithelial cells also express CCR9. Small intestinal epithelial cell CCR9 increases local immune response, while colonic epithelial cell CCR9 reduces inflammation, possibly by acting as a CCL25 “sink” (15). Furthermore, melanoma and ovarian, breast, and prostate adenocarcinomas express CCR9 (21–25). This is proposed to play a role in tumor cell antiapoptosis and proliferation. Overall, these findings show that CCL25/CCR9 plays a variety of important roles in different cell types, including several cancers.
Here, we reveal what we believe to be a novel role for CCR9 to inhibit CRC invasion and metastasis. Compared with normal colon mucosa, CCR9 is upregulated in adenomas and preinvasive CRCs. In contrast, CCR9 expression is subsequently downregulated in invasive and metastatic CRCs. Because the commonly used CRC cell lines we tested were CCR9–, we searched for new cell culture models and found that both primary CRC cell cultures and colon-cancer-initiating cell (CCIC) lines made from early-stage tumors were CCR9+. In vivo, systemically injected CCR9+ early-stage CCICs spontaneously formed orthotopic colon and small intestinal xenografts, which we believe has never been observed with any previous CRC cell line, while commonly used CRC cell lines and CCR9– CCICs formed only extraintestinal tumors. Blocking the CCR9/CCL25 axis inhibits CCIC intestine/colon tumor formation while increasing extraintestinal tumor multiplicity. Finally, we show that NOTCH signaling, which stimulates CRC invasion and metastasis, promoted CCR9 proteasomal degradation, inhibited CCL25-dependent AKT signaling, and increased extraintestinal CRC tumors. Overall, these data provide insights into the mechanism by which CCR9/CCL25 promotes colon-localized, early-stage CRC growth, while inhibiting invasion and metastasis, and its suppression by NOTCH signaling in late-stage CRC and provide what we believe to be a novel in vivo model system to study CRC tumor progression in the native colon microenvironment.
Results
CCR9 is upregulated in preinvasive CRC and downregulated in invasive and metastatic CRC.
To understand the expression pattern of CCR9 in CRC, we immunostained representative sections from patient tumors. Cases varied in clinical stage from adenoma to carcinoma in situ (Tis) to transmural involvement (T4). CCR9 staining intensity was scored for normal crypt epithelium and neoplastic tissue from each involved layer of the colon wall (Figure 1). Consistent with previous studies, CCR9 was expressed in normal colonocytes essentially throughout the entire crypt. To quantify CCR9 staining intensity, we used a histopathology scoring system ranging from 0 to 3. Normal colon epithelium had a mean staining intensity of 1.60 ± 0.04 (n = 55). CCR9 staining in adenomatous foci was significantly increased (2.26 ± 0.06; n = 46) compared with that in normal tissue. In contrast, staining intensity progressively decreased in carcinoma in situ (2.03 ± 0.08; n = 19) and in carcinomas that invaded the submucosa (1.47 ± 0.06; n = 44) and muscle wall (1.13 ± 0.08; n = 42; all P < 0.001) (Figure 1, A–I). Additionally, we quantified CCR9 expression in primary CRC culture by FACS. Consistently, high percentages (~90%) of early-stage (I/II) primary CRC cells were CCR9+, while much lower percentages of late-stage (III/IV) invasive or metastatic CRCs (~10%) were CCR9+ (Figure 1J). Overall, CCR9 levels were highest in noninvasive tumors (adenomas and in situ carcinomas) and were progressively downregulated in submucosal invasive, muscle invasive, and metastatic CRC tumors, consistent with a potential role for CCR9 to suppress invasion and metastasis.
Figure 1. CCR9 is expressed in early-stage CRC and early-stage CCICs.

(B) CCR9 protein in normal colon epithelium, (A and C) preinvasive, (D and E) invasive, and (F and G) liver metastatic CRCs is shown by immunohistochemistry with anti-human CCR9 and developed by DAB (brown). The dotted line in E indicates the boundary between normal epithelium (CCR9+) and invasive CRC (CCR9–). The box in D is shown at higher magnification in E . (H) Negative control with control IgG. Scale bars: 100 μm. (A, D, and F); 50 μm (E, G, and H); 10 μm (B and C). (I) CCR9 expression levels by immunohistochemistry scoring. Error bars indicate SEM. *P < 0.001, **P < 0.01, compared with normal colon. (J) FACS quantification of membrane and cytoplasmic CCR9+ cells in early- or late-stage primary CRCs. Gates are set for high CCR9+ signal intensity. Numbers indicate the percentage of CCR9+ cells (left) and CCR9– cells (right). (K) Western blot of CCR9 protein levels in common CRC lines (RKO, SW480, LoVo), 3 early-stage CCIC lines (stage I/II), and 2 late-stage CCIC lines (stage III/IV). β-Actin is used as loading control. Lymphoma cells were used as a positive control for CCR9. (L) FACS quantification of cell surface membrane CCR9+ cells in common CRC lines (HCT116 as representative), early-stage CCICs, and late-stage CCICs (early-stage CCIC1 and late-stage CCIC1, as representative). Numbers indicate the percentage of CCR9+ cells.
To understand the role of CCR9 in CRC, we tested several commonly used CRC cell lines (HCT116, RKO, SW480, and LoVo) and found very low or undetectable CCR9 protein levels (Figure 1, K and L). In contrast, we found that several CCIC lines (Supplemental Table 2) derived from patients with early-stage, colon-localized (American Joint Committee on Cancer [AJCC] stage I/II) CRC (26, 27) generally had robust CCR9 protein expression. In contrast, CCIC lines (Supplemental Table 2) derived from patients with later stage (III/IV) CRC, whose tumors had spread beyond the colorectum, had much lower CCR9 expression. This suggested that CCIC lines derived from patients with early-stage, colon-localized CRC might be a useful system for mechanistic studies of CCR9. Additionally, while only correlative, these data are consistent with immunohistochemistry that indicated that CCR9 protein levels were more closely associated with earlier stage CRC tumors that had less invasive and metastatic potential compared with later stage tumors with poorer prognosis.
Stage I/II CCICs form orthotopic xenograft CRC tumors in the colon and small intestine.
CCL25 produced by small intestine and colon epithelial cells attracts circulating CCR9+ T lymphocytes (28). To understand the in vivo role of CCR9 in CRC, we injected CCIC lines systemically into the tail veins of immunodeficient mice (NOG mice). 73.3% of mice injected with early-stage CCICs became moribund and developed an average of 3.7 tumors in intestines and colons at a mean of 8.55 weeks after inoculation (Table 1). Of mice that developed gastrointestinal (GI) tumors, 69% had tumors in both small intestine and colon, 19% had tumors only in colon, and 12% had tumors only in small intestine (Figure 2H). No upper GI or rectal tumors were seen. Many of these tumors caused intestinal obstructions and pneumatosis coli (gas in the intestine from bacterial stasis and dysmotility secondary to obstruction) (Figure 2, A and B), pathologies often seen in patients with obstructing primary CRC adenocarcinomas. Evaluation of other organs showed that 35.6% of mice developed an average of 126 extraintestinal tumor foci, mostly in lungs, and all were in mice that also carried intestine/colon tumors. In contrast, mice injected with CCICs derived from later stage tumors or commonly used CRC cell lines, SW480 or LoVo, only formed tumors outside the small intestine and colon (Figure 2, H and I). Similar to CCIC dermal xenografts and the vast majority of human primary and metastatic CRC tumors, CCIC colon/intestine and extra-GI tumors had adenocarcinoma morphology, containing distorted crypt-like structures (Figure 2, D–F).
Table 1.
CCICs and common CRC lines form orthotopic xenograft tumors in mouse intestine and colon and other sites
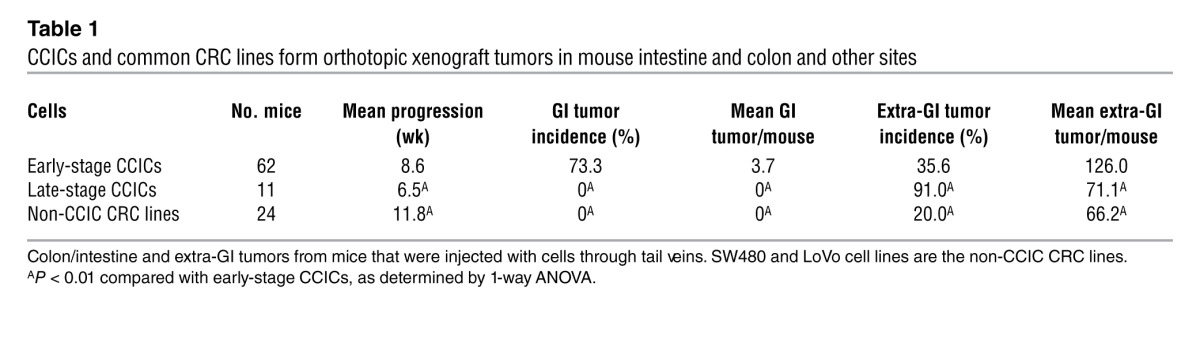
Figure 2. Early-stage CCICs form orthotopic xenograft tumors in mouse intestine and colon and other sites.

(A) Postmortem analysis of NOD/SCID mice with tail vein–injected CCICs (original magnification, ×4). Arrows indicate CCIC tumors in lung (white spots; top part of photo) and intestine (bottom part of photo). Small bowel is distended and inflamed. (B) Close-up image of mouse abdomen showing (a) distended small intestine loop proximal to CCIC tumor obstruction with adhesion (indicated by arrows) to adjacent (non-obstructed and grossly normal) small intestine loop and (b) Pneumatosis intestinalis from bacterial stasis in right colon proximal to another CCIC obstruction (original magnification, ×4). (C) High-power light microscopy close-up image of CCIC jejunal adenocarcinoma. Scale bars: 0.5 mm. (D) Multiple CCIC tumors with histopathology in small intestine, (E and F) colon, and (G) lung. Arrow denotes adenocarcinomas in D–G. Scale bars: 100 μm. (H) Xenograft tumor incidence by site of implantation in mice injected with CCICs or CRC cell lines. *P < 0.01, **P < 0.001, compared with non-CCIC. Error bars indicate SEM.
Mice injected with either early- or late-stage CCICs also became moribund at significantly earlier times after inoculation compared with mice injected with commonly used CRC cell lines (P < 0.001) (Supplemental Figure 1; supplemental material available online with this article; doi: 10.1172/JCI62110DS1). The colon/intestine tumors that we observed could have arisen directly from early-stage CCICs or indirectly by stimulating endogenous mouse intestinal tumorigenesis. We systemically injected and tracked early-stage CCICs carrying the PGK promoter driving constitutive expression of an EGFP reporter. First, we tested whether these tumors contained human DNA. PCR using 2 different human centromeric repeat sequences from genomic DNA isolated from intestine/colon tumors showed that they contain human DNA (Figure 3A). Next, we examined the lower GI tracts of mice carrying early-stage CCIC colon/intestine tumors for EGFP fluorescence. This revealed that GI tumors consist of EGFP+ cells (Figure 3, B–D), indicating that the colon/intestine tumors were formed by early-stage CCICs in mouse hosts. As anticipated, the intestine and colon sites in which tumors formed expressed CCL25, while sites of outside of GI tract (extra-GI) tumors, such as the lung, did not have detectable levels (Figure 3, F and G). Interestingly, early-stage GI CCIC tumors were CCR9+ whereas extra-GI tumors were CCR9– (Figure 3E).
Figure 3. CCIC colon and intestinal tumors consist of human cells and are CCR9 positive.

(A) PCR of human centromeric repeat sequences from DNA extracted from CCICs (positive control) and CCIC-injected mouse tails, intestines, and lung tissues and of a control (no DNA negative control). (B) Maestro GFP imaging system images of intestinal tumor of PGK-EGFP–expressing CCICs. Scale bars: 0.5 cm. (C) Light microscopy close-up images of EGFP+ CCIC tumor in B. Scale bars: 0.5 mm. (D) Anti-GFP immunofluorescence imaging of a CCIC intestinal tumor, with adenocarcinoma morphology. Inset shows H&E staining of the same intestinal tumor as control. Arrows indicated EGFP+ cells. M, mucosa. Scale bars: 100 μm. (E) CCR9 immunofluorescence of CCIC intestinal and lung tumors. CCR9 protein was detected by anti-human CCR9 antibody (green), and nuclei were stained with DAPI (blue). Scale bars: 50 μm. (F) CCL25 immunofluorescence in mouse intestine and lung. CCL25 expression was detected by anti-mouse CCL25 antibody (red), and nuclei were stained with DAPI (blue). Scale bars: 100 μm. (G) Anti-CCL25 antibody Western blot showing CCL25 expression in mouse intestine but not lung. β-Actin was used as loading control.
Stage I/II primary CRC cultures and CCICs show CCL25-dependent chemotaxis.
To understand the role of the CCR9/CCL25 axis in primary CRC cells, we cultured tumor cells directly from patient tumors (Supplemental Table 1). Cells were sorted for expression of the CRC marker carcinoembryonic antigen (CEA) and plated in Boyden chambers. Consistently, more primary early-stage CRC-cultured cells migrated toward the chamber compartment containing recombinant CCL25 than the compartment containing mock control (P < 0.001) (Figure 4, A and B), while this pattern was not observed in SW480 cells. Migrated primary early-stage CRC cells were double immunopositive for CEA and CCR9 (Figure 4C). Similarly, consistent with our in vivo xenograft studies, more early-stage CCICs migrated in vitro toward a chamber containing CCL25 compared with those that migrated toward a chamber containing a mock control, while this activity overall was much lower for experiments with late-stage CCICs (Figure 4, D–F). Altogether, these data show that both CCR9+ early-stage CRC cells and CCICs functionally chemotax toward CCL25.
Figure 4. CCL25-dependent chemotaxis in early-stage primary CRC and CCICs.

(A) Boyden chamber assay of 7 early-stage primary CRCs in the upper chambers chemotaxis to the lower chambers containing CCL25. CCL25 absence is indicated by “–”; CCL25 presence is indicated by “+”. Error bars indicate SEM. *P < 0.0001, compared with matched (–) cells by 1-way ANOVA (n = 4). SW480 was used as a negative control. (B) Crystal violet staining of early-stage primary CRC cells migrating into the chamber with CCL25 (bottom) or mock (top). Scale bar: 50 μm. (C) CEA (red) and CCR9 (green) immunofluorescence of early-stage primary CRC cells that migrated to the chamber with CCL25 (DAPI [blue]). Scale bar: 10 μm. IgG was used as negative control. (D) Crystal violet staining of Transwell chambers with early-stage CCIC1 or late-stage CCIC1 (as representatives) that have migrated to CCL25 or PBS (mock). Scale bar: 50 μm. (E) CCR9 (green) immunofluorescence of early-stage CCICs that migrated to the CCL25-containing chamber (DAPI [blue]). Control IgG was used as negative control. Scale bar: 10 μm. (F) Percentage of early- or late-stage CCICs that migrated to CCL25 or mock (PBS) in Transwell assay. **P < 0.001.
Inhibiting the CCR9/CCL25 axis reduces CCIC colon/intestine tumor formation.
To test the role of CCR9 in CCIC orthotopic colon/intestine xenograft formation, we performed cell sorting for CCR9 and systemically injected CCR9+ or CCR9– early-stage CCICs (Supplemental Figure 5A). Mice injected with CCR9+ CCICs had a high incidence of colon/intestine tumors (both sites produce CCL25), whereas mice injected with CCR9– CCICs had low incidence (P < 0.001) (Table 2). The mean number of colon/intestine tumors in mice injected with CCR9+ CCICs was also significantly higher than that in mice injected with CCR9– CCICs. At the same time, the incidence and mean number of tumors outside the colon/intestine were significantly higher in mice injected with CCR9– CCICs than in mice injected with CCR9+ CCICs (Table 2).
Table 2.
CCR9/CCL25 is required for CCIC colon/intestine tumor formation
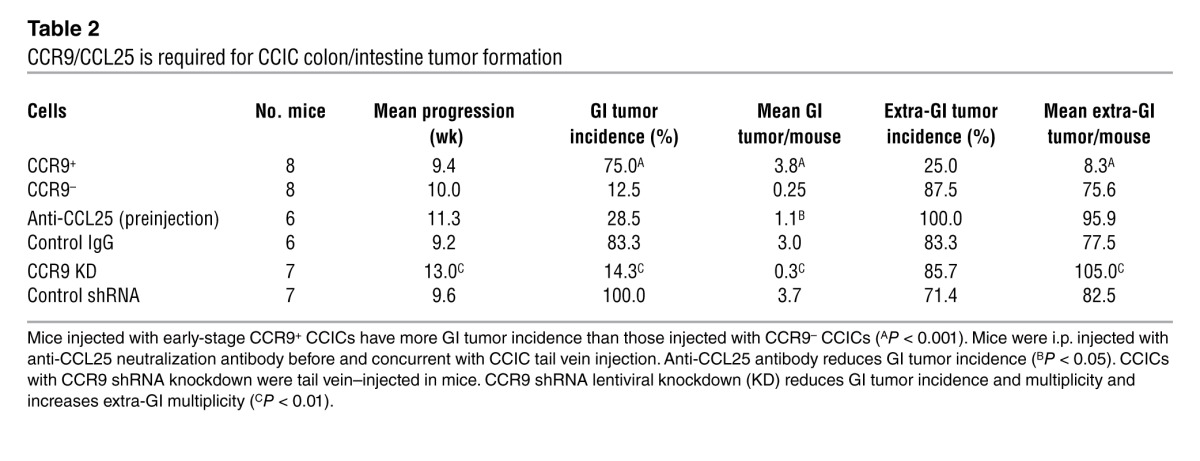
To confirm the role of CCR9/CCL25, we used anti-CCL25 antibodies to inhibit bioavailable intestinal CCL25. Pretreating mice with anti-CCL25 antibodies before and concurrent with early-stage CCIC injection reduced colon/intestine tumor multiplicity (Supplemental Figure 5A). Anti-CCL25 antibody treatment also caused a trend toward reduced colon/intestine tumor incidence and increased extra-GI incidence and multiplicity, although these differences were not statistically significant (Table 2). Additionally, we used CCR9 shRNA knockdown in CCICs. Mice injected with CCR9 shRNA knockdown CCICs had lower incidence and mean number of colon/intestine tumors and higher mean extraintestinal tumors compared with those in mice injected with CCICs expressing a control shRNA (Table 2 and Supplemental Figure 2B). The overall survival of mice injected with anti-CCL25 antibodies or CCR9 shRNA knockdown CCICs was also significantly longer compared with that of controls (Table 2 and Supplemental Figure 2C).
The CCR9/CCL25 axis regulates CCIC metastasis out of the GI tract.
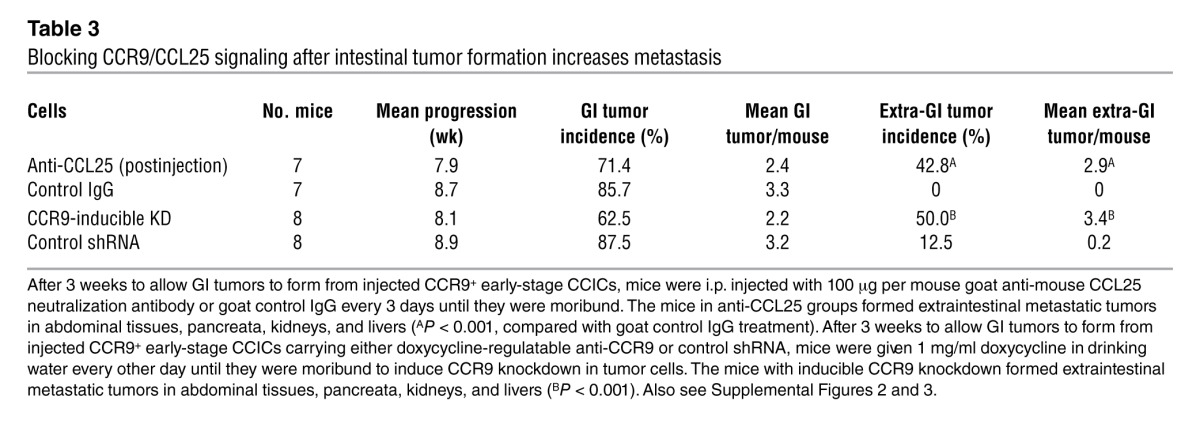
To understand whether CCR9/CCL25 regulates CCIC metastasis out of the GI tract, we performed 3 sets of experiments involving antagonism of CCL25/CCR9 signaling after GI tumor initiation. First, we injected mice with CCR9+ CCICs, waited 3 weeks for colon/intestinal tumors to form, and then treated mice with anti-CCL25 antibodies. This significantly increased both the incidence and multiplicity of CCIC extra-GI tumors (Table 3, Supplemental Figure 3D, Supplemental Figure 4, and Supplemental Figure 5B). Second, we injected mice with CCR9+ CCICs with doxycycline-inducible expression of anti-CCR9 or control shRNA. Approximately 3 weeks after injection, we administered doxycycline to induce CCR9 knockdown. This also significantly increased extra-GI CCIC tumor incidence and multiplicity (Table 3, Supplemental Figure 3, Supplemental Figure 4, and Supplemental Figure 5B). Third, we created HCT116 sublines (which are CCR9–) that stably express CCR9 (HCT116CCR9+ cells) and used IVIS imaging to monitor the sites of tumor formation after tail vein injection. While HCT116 cells formed extra-GI tumors, in contrast HCT116CCR9+ cells formed GI tumors in addition to extra-GI tumors. Interestingly, stable expression of CCR9 also reduced the overall burden of extra-GI tumors, as quantified by IVIS photon counting (Supplemental Figure 6 and Supplemental Methods). Altogether, these studies are consistent with CCL25/CCR9 antagonism causing CCICs in the intestine and colon to migrate outside the GI microenvironment and form additional extra-GI tumors.
Table 3.
Blocking CCR9/CCL25 signaling after intestinal tumor formation increases metastasis
CD26 and SNAIL (also known as SNAL1) are associated with CRC migration and metastasis (29–31). To understand whether they could play a role in CCIC migration extra-GI, we used shRNA to knockdown expression of CD26 or SNAIL by approximately 70% (Supplemental Figure 2A). However, neither of these gene knockdowns affected colon/intestine or extra-GI CCIC tumor formation or survival of mice systemically injected with CCICs (Supplemental Figure 2, B and C).
CCR9/CCL25 stimulates AKT signaling and cell proliferation in stage I/II CRC primary culture and CCICs.
Our hematogenous xenograft studies show that CCR9+ early-stage CCICs formed colon/intestinal tumors, while CCR9– cells formed extra-GI tumors. To understand the signaling mechanisms regulated by CCL25/CCR9, we performed gene expression profiling of FACS-sorted CCR9+ and CCR9– early-stage CCICs (both treated with CCL25) with the WaferGen Human Oncology Panel Chip. Mapping all known interactions among differentially expressed genes to the Ingenuity Pathway Analysis (IPA) mammalian interaction database revealed a network of CCR9/CCL25-upregulated oncogenic transcriptional regulators associated with cell proliferation, including FOS, FOSL1, JUN, EGR1, and ETS1 (P = 9.86 × 10⁻¹²), directly downstream of the AKT and NOTCH signaling pathways (Figure 5A). To test whether CCL25/CCR9 regulates AKT signaling in CRC, we treated early-stage primary CRC or CCICs with CCL25 and assayed for phospho-Ser473 AKT, a biomarker of activated AKT signaling. CCL25 treatment increased the number of phospho-Ser473+ and Thr308 CCICs (Figure 5, B–D), consistent with activation of AKT signaling.
Figure 5. CCR9/CCL25 increases AKT signaling in early-stage CRC primary culture cells and CCICs.

(A) IPA direct interaction network of differentially expressed genes between CCR9– and CCR9+ early-stage CCICs with signaling proteins known to be involved in the CCR9/CCL25 pathway (see SmartChip RT-PCR procedures and functional analysis). The solid lines correspond with all direct interactions in the IPA database. The dashed lines represent indirect interactions. Genes either with a log2 fold upregulation (red nodes) or downregulation (green nodes) are integrated in the signaling network. Blue lines correspond to direct interactions in NOTCH, AKT, and GSK-3β signaling pathways. (B) Levels of phosphorylated AKT (Ser473 and Thr308) and GSK-3β, which are increased by incubation with 0.5 or 1.0 μg/ml CCL25 for 30 minutes in early-stage CCICs, as shown by Western blot. β-Actin was used as loading control. (C) Levels of phospho-AKT (Ser473) in early-stage primary CRC-cultured cells and early-stage CCIC1 after 30 minutes of 0.5 μg/ml CCL25 treatment. The imaging analysis software Ariol SL-50 was used to evaluate immunofluorescence signals of cells (–) or CCL25 (+). *P < 0.001, compared with control by 1-way ANOVA. Error bars indicate SEM. (D) Phospho-AKT (Ser473) in early-stage primary CRC-cultured cells after treatment with 0.5 μg/ml CCL25 for 30 minutes as detected by immunofluorescence (green). Scale bar: 10 μm.
NOTCH signaling downregulates CCL25/CCR9 AKT signaling and chemotaxis.
NOTCH signaling plays an important role in both normal intestine and CCICs. NOTCH signaling is activated by JAGGED 1 (JAG1) and delta-like ligand binding to NOTCH receptors. This activates multiple proteolytic cleavage events (32, 33), after which the NOTCH receptor intracellular domain (NICD) is released and translocates to the nucleus. NICD interacts with the DNA-binding protein RBPJκ, which recruits coactivators and stimulates expression of NOTCH target genes, including HES family genes (32). Recently, an important new role for NOTCH signaling in promoting CRC invasion and metastasis was demonstrated (11, 34). Because CCR9/CCL25 is associated with early-stage, colon-localized CRCs, we compared NOTCH signaling levels in FACS-sorted CCR9+ and CCR9– early-stage CCICs treated with CCL25. Levels of NICD and HES1, biomarkers of active NOTCH signaling, were substantially higher in CCR9– CCICs compared with those in CCR9+ CCICs (Supplemental Figure 8A). Confirming these data, we FACS-sorted CCICs expressing EGFP under the control of a NOTCH responsive promoter containing multiple RBPJ binding sites (GFP-NOTCH) (Supplemental Figure 7A). GFP-NOTCH high early-stage CCICs had lower levels of CCR9 and phospho-AKT (and higher levels of NICD and HES1) than GFP-NOTCH low cells (Supplemental Figure 8B). Next, we treated stage I/II CCICs with a high concentration of JAG1. JAG1 treatment increased CCIC NICD, HES1, and the number of GFP-NOTCH+ cells (Supplemental Figure 7C and Supplemental Figure 8B). JAG1 also downregulated CCR9 protein levels (Supplemental Figure 8C), consistent with a role for NOTCH as an upstream regulator of CCR9/CCL25 in CRC. To understand the mechanism of CCR9 downregulation by NOTCH signaling, we analyzed CCR9 mRNA and (cotreated with the proteasomal inhibitor PS-341) protein levels. CCR9 mRNA levels in 2 CCIC lines did not change in response to NOTCH activation, as measured by qPCR. In contrast, when cells were cotreated with the proteasomal inhibitor PS-341, CCR9 protein levels increased (Figure 6, A and B). Overall, these data are consistent with a mechanism whereby NOTCH lowers CCR9 protein levels by increasing its proteasomal degradation. Functionally, we found that JAG1 inhibited CCL25-induced AKT phosphorylation and that coincubation of CCICs with JAG1 inhibited CCIC chemotaxis toward CCL25 (Figure 6, C and D). Similarly, in a migration assay, addition of CCL25 to the upper chamber inhibited migration to 5% serum in the lower chamber, and coincubation with JAG1 antagonized migration stimulated by CCL25 (Supplemental Figure 8, D and E). We did observe that addition of CCL25 downregulated NOTCH2 receptor levels. However, CCL25 did not downregulate NOTCH signaling, as assayed by NICD and HES1 protein levels (data not shown). Therefore, these data are consistent with NOTCH acting upstream of CCR9/CCL25 to inhibit AKT and migration, but this interaction is not reciprocal.
Figure 6. NOTCH downregulates CCR9/CCL25 axis signaling in early-stage CCICs and increases extra-GI tumor formation.

(A) CCR9 mRNA levels in CCR9+ cells of early-stage CCIC1 and CCIC2 in response to JAG1-induced NOTCH activation using quantitative PCR. HES1 was used as positive control. **P < 0.001. (B) CCR9 protein levels in CCR9+ early-stage CCIC1 and CCIC2 cotreated with or without proteasome inhibitor (100 nM PS341, 4 hours before harvest), in response to JAG1-induced NOTCH activation using Western blot. HES1 was used as positive control. Lanes were run on the same gel but were noncontiguous (white lines). (C) Pretreatment of CCIC with 5 μg/ml JAG1 peptide for 8 hours suppresses CCL25-dependent chemotaxis in Boyden chamber assay. *P < 0.0001, compared with control by 1-way ANOVA; **P < 0.001, compared with CCL25 alone (n = 3). Error bars indicate SEM. (D) Pretreatment of CCR9+ CCICs with 2 μg/ml JAG1 peptide for 8 hours suppresses CCR9 protein, and CCL25 induces phospho-AKT (Ser473) levels, with essentially no change in total AKT levels. Western blot analysis used anti-human CCR9, phospho-AKT, total AKT (AKT1, AKT2, AKT3), NICD, and HES1 antibodies. β-Actin was used as a loading control. (E) CCICs carrying GFP-NOTCH reporter were sorted into NOTCH high and low subpopulations by FACS and injected into tail veins of NOD/SCID mice. NOTCH high CCICs form more extra-GI tumors, while NOTCH low CCICs form more GI tumors. Error bars indicate SEM. **P < 0.01, *P < 0.05, compared with each other. Also see Supplemental Figures 6 and 7.
NOTCH signaling promotes CCIC tumor formation outside of the colon and intestine.
Our in vitro studies are consistent with the NOTCH pathway acting upstream of CCR9/CCL25 to inhibit its function. To understand the in vivo role of NOTCH on the CCR9/CCL25 axis in CCICs, we used CCICs expressing a GFP-NOTCH reporter. We FACS sorted these CCICs into GFP-NOTCH high and low cell populations (referred to herein as GFP-NOTCH high and GFP-NOTCH low, respectively), and injected cells systemically into the tail veins of immunodeficient mice. Consistent with the role of NOTCH to promote CRC invasion and metastasis (11), GFP-NOTCH high CCICs formed significantly more tumors outside the colon/intestine than GFP-NOTCH low CCICs (Figure 6E and Supplemental Figure 7C). Conversely, GFP-NOTCH high CCICs formed significantly fewer intestine/colon tumors than GFP-NOTCH low CCICs. Overall, these data are consistent with an in vivo role for NOTCH signaling to inhibit CCR9/CCL25 signaling in CCICs and promote invasion, metastasis, and tumor formation at sites extra-GI.
Discussion
Chemokines regulate antiapoptosis, migration, recruitment of tumor-associated cells, metastasis, and trafficking for many cancers (13). The CCR9/CCL25 axis specifically regulates gut mucosal immunity. CCL25 is produced by small intestine and colon epithelia, which recruits circulating CCR9+ T and dendritic cells to the gut, increases AKT signaling, and prevents T lymphocyte apoptosis (14–17). Here, we demonstrate an unexpected role for GI epithelium-produced CCL25 to suppress CRC invasion and metastasis. The great majority of colonocytes express both CCR9 and CCL25 (15). Compared with that in normal human colon, CCR9 is upregulated in adenomas and early-stage CRC but downregulated in invasive and metastatic CRC (Figure 1). Early-stage CRCs have better prognosis and less metastatic potential than late-stage tumors. Both early-stage primary tumor cells and CCICs demonstrate CCL25-dependent upregulation of AKT signaling, chemotaxis, and proliferation (Figure 4). In patients with CRC, AKT signaling (particularly in tumors carrying PIK3CA mutations) is associated with a good prognosis and is inversely correlated with later stages (35). Conversely, NOTCH signaling is associated with CRC invasion and metastasis (refs. 11, 34, and Figure 6). Overall, our data are consistent with a model (Supplemental Figure 9) whereby preinvasive (adenoma and carcinoma in situ) CRC cells upregulate CCR9 levels. Paracrine CCL25 produced by surrounding colon epithelium stimulates proliferation and antiapoptosis signaling that contributes to increased tumor size and likely superficial tumor spread along mucosal margins. This is accomplished mechanistically through upregulating AKT signaling and a downstream network of oncogenic transcription factors that promote proliferation. As tumors progress, some cells upregulate NOTCH signaling. During this transition, upregulation of NOTCH signaling drives proliferation, taking over for CCL25/CCR9 signaling. This causes an “invasive switch” that stimulates CCR9 proteasomal degradation, inhibits CCR9/CCL25 signaling, and promotes NOTCH-driven invasion and ultimately metastasis (34). Consistent with this model, NOTCH signaling is higher in CCR9– CCICs compared with that in CCR9+ CCICs. Consequently, late-stage invasive and metastatic CRC tumors do not express CCR9, as there is no proliferative advantage if CCL25 is absent from the microenvironment of metastatic sites. Overall, our data provide insights into the regulation of CRC tumor progression by the CCL25/CCR9 mechanism and the evolution of preinvasive to invasive and metastatic CRC cells. Our data also suggest that CCR9 may be a useful prognostic marker to distinguish indolent from invasive and metastatic CRC.
Which NOTCH ligands are most important for stimulating CCR9 downregulation? Because there are multiple roles for NOTCH signaling in CRC, including roles in tumorigenesis, progression, chemoresistance, and angiogenesis, and because there are 5 canonical NOTCH ligands and additional noncanonical NOTCH ligands (e.g., DLKs) that influence signaling levels in addition to posttranslational modification of these ligands by glycosyltransferases (e.g., POFUT1) that affects their ability to bind to different NOTCH receptors (11, 32, 36–47), the answer is complex. The multiple roles of NOTCH signaling in normal colon homeostasis, different CRC mechanisms, and the large diversity of possible ligands make the association of individual ligands with NOTCH-driven CRC progression difficult both to study and interpret using in situ hybridization or immunohistochemistry. However, it is important to note that previous studies have shown that the NOTCH ligand DLL4 is upregulated in vascular endothelial cells located within CRCs but not in endothelium adjacent to normal mucosa (44). Furthermore, in addition to expression of JAG1, JAG2, DLL1, and DLL4 ligands by normal colon epithelial cells, some CRC cells themselves express NOTCH ligands such as JAG1 or DLK1 and are able to stimulate paracrine signaling (48, 49). Therefore, while the overall situation is complex because of the multiple roles of NOTCH signaling in CRC, it is most likely that DLL4, JAG1, and possibly DLK1, play the most important roles in CCR9 downregulation.
The chemokine receptor CXCR4 plays an important role in the homing and retention of hematopoietic stem cells within the bone marrow microenvironment (50). Targeted disruption of CXCR4 signaling results in rapid mobilization of hematopoietic stem cells into the peripheral circulation (51–55). The finding that downregulation of CCL25/CCR9 signaling can increase CRC migration out of the intestine/colon is therefore analogous to the situation with CXCL12/CXCR4 and hematopoietic stem cells (50). Furthermore, because CXCL12 (also called SDF1A) is implicated in metastasis of multiple tumor types (with more than 700 citations in Medline on this topic), including CRC, we tested extra-GI CCIC tumors and found that they can express CXCR4 at high levels (Supplemental Figure 10). Overall, these findings are consistent with a potential CRC chemokine-driven “metastatic switch” during tumor progression. In future studies it will be important to evaluate this potential metastasis mechanism. Experimental approaches could include carefully designed experiments tracking colon cancer cell CCR9 and CXCR4 cell surface membrane protein levels in CCICs and other mouse models of stochastic colon cancer metastasis (56), for example by FACS, to see whether expression of these specific chemokine receptors is mutually exclusive and whether CXCR4 correlates with NOTCH signaling upregulation (11). Alternatively, new techniques using dual wavelength luciferase reporter genes driven by the CCR9 or CXCR4 promoters, respectively, could be monitored in vivo in surgical models of colon cancer metastasis (57). Another approach would be to use dual immunofluorescence for CCR9 and CXCR4 to screen tissue microarray biospecimens from both early- and late-stage CRCs to evaluate for mutual exclusivity of their expression in tumor progression. Overall, these experiments could create a strong rationale for repurposing existing CXCL12/CXCR4 antagonists that are used for hematopoietic stem cell mobilization for clinical trials to inhibit CRC metastasis.
The commonly used CRC cell lines we tested expressed little or no CCR9. When injected systemically in mice, some lines could form tumors extra-GI. However, to our knowledge, no spontaneous orthotopic colon/intestine tumor formation has ever been previously reported with any CRC cell line. Precisely why these commonly used cell lines do not express CCR9 is unknown. We speculate that this may reflect their long-term in vitro culture in the absence of CCL25.
Since our in vivo orthotopic CRC tumor formation system models the transition directly from GI-localized neoplasms to metastatic carcinomas, the CCIC lines described here have the potential to be a useful model to identify important “driver” mutations, epigenetic changes, and signaling pathways that regulate preinvasive to invasive and metastatic CRC progression, with less confounding by the high background “passenger” mutation rates seen in advanced CRC tumors.
Functional CCR9 which is responsive to CCL25 is expressed by multiple tumor types, including prostate, ovarian, breast, and pancreatic adenocarcinomas and melanomas (21–24, 58). The role of CCR9 in these types of cancer is unclear. One possibility is that a driving force is the upregulation of AKT signaling and cell proliferation. Because some chemokine receptors bind multiple ligands, we speculate that additional CCR9 ligands may exist that play a role in these tumor types. Alternatively, CCR9 could cause constitutive activity even in the absence of ligand in these tumors (perhaps from somatic activating mutations), or paracrine CCL25 could be produced by infiltrating lymphocytes. Future experiments in these other tumors will be required to understand the precise role of CCR9 in these contexts outside of the intestine and colon.
Methods
Histology and immunohistochemistry.
Representative sections of specimens from patients with CRC were immunostained for CCR9 using a 1:150 dilution of anti-human CCR9 (Abcam, no. ab38564) with antigen retrieval and peroxidase-based detection. Cases varied in clinical stage from in situ carcinomas to transmural involvement. For each case, CCR9 staining intensity was assessed (range 0–3) for normal crypt epithelium and neoplastic tissue from each involved layer of the colon wall using double blank scoring method. Intensity ± SEM is shown (see Figure 1, A–G).
Cell culture.
AJCC clinical stage I/II (referred to here as early) and stage III/IV (late) CCIC lines were generated using the colon cancer stem cell culture conditions of Vermeulen et al. (59), with several modifications as previously described by our laboratory (27). Briefly, fresh primary and metastatic tumor biospecimens from patients with CRC were extensively washed with PBS, minced, and incubated at 37°C with collagenase. Cells were then strained through a 40-μm filter and cultured as “colonospheres” (59). Colonospheres were cultured in ultra-low-attachment flasks in DMEM/F12 containing nonessential amino acids, penicillin (500 U/ml), streptomycin (500 mg/ml), amphotericin B (1.25 mg/ml), and heparin (4 μg/ml; all from Sigma-Aldrich). Modifications from the methods described in ref. 59 included increased concentrations of epidermal growth factor (40 ng/ml) and basic fibroblast growth factor (20 ng/ml) and the addition of B27 supplement (Invitrogen). Cells were incubated at 37°C and 5% CO2. Cells were cloned as single cells, expanded, and frozen in DMSO. With these conditions, clonal cultured colonospheres were considered to be CCICs based on the following criteria: (a) more than 50% FACS-positive status for CD44, CD133, and ALDH1 (tested individually) (26), (b) ability of cells (1:1,000–1:10,000) to form subcutaneous xenografts in NOG mice, (c) capable of serial self-renewal in subcutaneous xenografts assays, and (d) ability to form subcutaneous xenograft tumors with adenocarcinoma histomorphology. Additionally, CCICs were also noted to express LGR5, NOTCH1 and NOTCH2 receptors, JAG1, DLL4, and nuclear β-catenin (consistent with expression of WNT target genes such as CD44 and LGR5). CCR9/ALDH1 coexpressing cells were also observed (data not shown).
Primary CRC culture.
Primary CRC culture used the method of collagenase/dispase enzyme digestion with slight modification, as previously described (60, 61). Fresh samples of CRC were collected in DMEM/F12 supplemented with 10% FBS and 2% penicillin/streptomycin, immediately after patients had operative resection. Tissue was dissected free of fat and blood clots and rinsed 5 times with PBS supplemented with 2% penicillin/streptomycin. Then, tissue was minced into approximately 1-mm fragments and digested in DMEM/F12 containing collagenase type XI (150 U/ml, Sigma-Aldrich), dispase neutral protease (40 μg/ml, Roche Applied Science), and 1% FBS, stirring at 37°C for 30 minutes. After centrifugation, cells were resuspended in the CCIC culture medium containing 5% FBS and 1% penicillin/streptomycin and cultured in the ultra-low-attachment flashes for a short time (1–2 passages); then the cell culture was shifted into complete CCIC medium without FBS. FACS with ESA was used to purify CRC, and cells within 5 passages were used for the following experiments.
CCR9-constitutive and -inducible knockdown and SNAIL or CD26 knockdown in CCICs and NOTCH reporter CCICs.
The lentiviral vector pEco-CMV-H1-shRNA-GFP, encoding a shRNA sequence (CCR9, 5′-CTTGTACTGGCTCGTGTTCAT; SNAIL, 5′-GAGCTGCAGGACTCTATCCA; CD26, 5′-CATTCCTACACAGCTTCATAT), was used for CCR9, SNAIL, or CD26 expression knockdown, and the lentiviral vectors pEco-CMV-H1-GFP (GenTarget Inc.) and pEco-CMV-H1-scrambled-shRNA-GFP served as controls. To generate the lentiviral vectors, the above plasmids were transfected into HEK293T cells with the gene target lentivirus packaging mix (GenTarget Inc.) according to the manufacturer’s protocol. For CCR9 tetracycline-inducible knockdown, the same shRNA sequence against the CCR9 gene was inserted into pLenti-H1-shRNA-RSV (GFP-Puro) vector (GenTarget Inc.) and packaged into lentivirus particles, as in previous procedure, which were used together with another TetR expression lentivirus (RFP-Bsd) (GenTarget Inc.) to infect CCICs. After antibiotic selection and GFP/RFP dual FACS purification, the CCR9 shRNA knockdown could be induced by 1 μg/ml (in vitro) or 1 mg/ml (in vivo) doxycycline. NOTCH signaling reporter CCICs were generated by infecting CCICs with pCignalLenti RBP-Jk Reporter (GFP) ready lentivirus (SA Biosciences Inc.). After infecting CCIC lines with these lentiviral vectors, stable knockdown clones were obtained through antibiotic selection of blasticidin (Invitrogen). The efficiency of the CCR9, SNAIL, or CD26 knockdown in CCICs was verified by Western blotting, and efficiency of NOTCH signaling reporter was tested by 2 μg/ml JAGGED 1 (62–64) (AnaSpec) treatment following by GFP-FACS sorting.
CCIC xenograft tumor formation in colon/intestine and other organs.
0.5 × 10⁶ to 1 × 10⁶ CCICs or common CRC cells were injected into 6- to 8-week-old NOD/SCID mice (The Jackson Laboratory) by tail vein injection. Tumor incidence was monitored 2 to 3 times weekly. When mice became moribund, they were sacrificed immediately, necropsy was performed, and tumors were harvested using a dissecting microscope. For ex vivo GFP imaging of tumor tissues, lentiviral infection by the pEco-CMV-GFP vector was used to generate CCIC lines that stably express GFP and were maintained in puromycin selection. 106 of these fluorescent CCICs were systemically injected as described above. Intestinal tissues harvested at the time of sacrifice were analyzed for GFP expression with Cri Maestro Imaging Systems (Cambridge Research & Instrumentation Inc.).
For the CCR9 study, native CCICs; CCICs with CCR9, SNAIL, or CD26 knockdown (or commonly used CRC cell lines, such as HCT116, etc., as indicated in the legend for Supplemental Figures 1 and 2); and CCR9+ CCICs with CCR9-inducible knockdown were intravenously injected into the 6- to 8-week-old NOD/SCID mice by tail vein. Mice that became moribund were sacrificed immediately, whereas the rest were closely monitored for 16 weeks before sacrifice. To test whether CCL25 antibody could inhibit the CCL25-CCR9 GI homing mechanism in vivo, a dose of 100 μg goat anti-mouse CCL25 neutralization antibody (R&D Systems, catalog no. AF-481-NA) was i.p. administrated to each mouse twice (the same dose and schedule as used in ref. 65). As a negative control, a dose of 100 μg goat IgG (R&D Systems) was administered to each mouse in the control group. Then, 1 × 10⁶ CCICs were injected into the mice 8 hours after or with the injection of the antibody. To test whether extra-GI metastasis is induced by CCR9/CCL25 signaling blockade, CCL25 neutralization antibody at the same dose was i.p. administrated to each mouse every 3 days or 1 mg/ml doxycycline in drinking water was given to mice every other day, starting from the fourth week after CCIC inoculation until mice became moribund.
Genomic DNA extraction and semiquantitative PCR.
Genomic DNA from CCIC culture, lung and intestinal adenomas, normal tissues, or mouse tails was extracted using a tissue DNA Extraction Kit (Qiagen). Semiquantitative PCR was performed, followed by DNA gel electrophoresis. Human centromeric repeat loci were used as markers to detect human cells in harvested mouse tissues. Primer sequence pairs used are as follows: (a) 5′-GAGTGCACATTCAGACAAGACCC-3′ and 5′-CCATTAGAGAGCTTTCCTCATTGC-3′ or (b) 5′-CGTGTGTTTTTGGTTACTTCTCCCC-3′ and 5′-CTTAGCCATTGCCCATTGATGGA-3′.
Quantitative real-time PCR.
Total RNA from cells was extracted by using the RNeasy Kit (Qiagen). 2 μg of total RNA was reverse-transcribed into cDNA by using the RT First-Strand Kit (SA Biosciences), and RNA levels, normalized to GAPDH as the comparative Ct (comparative Ct = Ct [target] – Ct [control]), were analyzed by the iCycler (Bio-Rad). Primer pairs used are as follows: (a) GAPDH, 5′-ACAGTCAGCCGCATCTTCTT-3′ and 5′-AATGAAGGGGTCATTGATGG-3′; (b) HES, 15′-ACGACACCGGATAAACCAAA-3′ and 5′-CGGAGGTGCTTCACTGTCAT-3′; (c) CCR9, 5′-CACAGACTTCACAAGCCCTA-3 and 5′-GTACAAGGGTGGGAGGAAAT-3′.
Transwell migration assay.
Transwell Boyden chambers (BD Pharmingen) of 8-μm-pore size were used to evaluate primary CRC cell and CCIC migration in vitro. Primary CRC cells or CCICs were seeded at a density of 5 × 10⁵ per well into the upper chamber. CCIC culture medium, as described above, with 100 ng/ml recombinant mouse CCL25 protein (R&D Systems) or 5% FBS was loaded into the lower chamber. Chambers of cells were incubated in 37°C and 5% CO2 conditions for 8 to 12 hours. At the time of harvest, cells remaining inside the upper chambers were removed, while cells attached to the lower surface of the membrane were fixed and stained with hexamethylpararosaniline chloride (crystal violet) (Sigma-Aldrich) or immunofluorescence stained with anti-CCR9 or CEA antibodies, followed by imaging analyses.
SmartChip RT-PCR procedures and functional analysis.
Early-stage CCICs were FACS sorted into CCR9+ and CCR9– subpopulations. Twenty-four hours afterward, cells were treated with 100 ng/ml human CCL25 for 30 minutes. RNA was extracted from both populations using the PureLink RNA Mini Kit (Invitrogen) and analyzed using the SmartChip Real-Time PCR System (WaferGen Biosystems). Briefly, cDNA was prepared using 1 μg of total RNA per sample per manufacturer’s recommendation. A PCR cocktail containing SYBR Green I Dye (Qiagen) and the equivalent of 1,000 ng of starting RNA for each sample was loaded onto the SmartChip Human Oncology V2 Panel (containing 1,296 unique real-time PCR reactions in quadruplicate for a total of 5,184 reactions per sample). The volume was 100 nl, with an equivalent of 96 pg of RNA loaded per reaction. Forty cycles of real-time PCR were performed on the SmartChip Cycler, collecting both raw Ct and Tm of each gene and samples for data analysis. We assessed the quality of our data for amplification, Tm curves, and Ct and Tm variability to remove any outlier data. We normalized to the mean of the quadruplicate PCRs, and delta-delta Ct calculations were used to determine fold change in expression. Genes either with a log2 fold change by a factor of greater than 1.8 (that correlates to ~3.3 fold or higher) or expressed in only 1 sample with a minimum raw Ct value of 24.99 were deemed significantly differentially expressed between CCR9– and CCR9+ early-stage CCICs. The complex biological processes that differentiate between CCR9– and CCR9+ CCICs were examined in the context of biomolecular networks. The interaction network shown in Figure 5 was generated with IPA, a web-delivered application used to discover, visualize, and explore relevant networks ( http://www.ingenuity.com/). Gene symbol identifiers and log2 fold changes of differentially expressed genes were uploaded to IPA, each identifier was mapped to its corresponding gene object in the IPA Knowledge Base, and direct interactions were only queried between these gene objects. The direct interaction network of differentially expressed genes between CCR9– and CCR9+ CCICs was manually integrated with signaling proteins known to be involved in the CCR9/CCL25 pathway.
Statistics.
All experiments were done with 4 to 8 samples per group, unless otherwise indicated, and all results were derived from at least 5 independent experiments. Values are expressed as mean ± SEM. For Student’s t test, a 2-tailed test was used. A P value less than 0.05 was considered significant. Statistical calculations were performed with the Statistical Package for the Social Sciences version 11.5 software (SPSS Inc.) or GraphPad. The statistical test used for each figure or table panel is indicated in the legends.
Study approval.
All primary CRC tissues in this study were taken from stage I–IV CRCs collected by the Weill Cornell Colon Cancer Biobank, and protocols for human studies were approved by the Institutional Review Board of Weill Cornell Medical College. All animal protocols in this study were approved by the Institutional Animal Welfare and Use Committee of Weill Cornell Medical College.
Supplementary Material
Acknowledgments
We thank other members of the Lipkin laboratory and Marian Waterman, Kambiz Afrasiabi, and Wenhong Shen for helpful discussions. This work was supported by R01 CA098626, R21 CA122937, R01 GM095990, NSF 1106153, NSF 2011131053, the HRH Prince Alwaleed Bin Talal Bin Abdulaziz Alsaud Institute for Computational Biomedicine, the Coffrin Center for Biomedical Information at Weill Cornell Medical College, and a generous donation by Matthew Bell.
Footnotes
Conflict of interest: The authors have declared that no conflict of interest exists.
Citation for this article: J Clin Invest. 2012;122(9):3184–3196. doi:10.1172/JCI62110.
References
- 1.Bozic I, et al. Accumulation of driver and passenger mutations during tumor progression. Proc Natl Acad Sci U S A. 2010;107(43):18545–18550. doi: 10.1073/pnas.1010978107. [DOI] [PMC free article] [PubMed] [Google Scholar]
- 2.Jones S, et al. Comparative lesion sequencing provides insights into tumor evolution. Proc Natl Acad Sci U S A. 2008;105(11):4283–4288. doi: 10.1073/pnas.0712345105. [DOI] [PMC free article] [PubMed] [Google Scholar]
- 3.Johnston MD, Edwards CM, Bodmer WF, Maini PK, Chapman SJ. Mathematical modeling of cell population dynamics in the colonic crypt and in colorectal cancer. Proc Natl Acad Sci U S A. 2007;104(10):4008–4013. doi: 10.1073/pnas.0611179104. [DOI] [PMC free article] [PubMed] [Google Scholar]
- 4.Barker N, et al. Crypt stem cells as the cells-of-origin of intestinal cancer. Nature. 2009;457(7229):608–611. doi: 10.1038/nature07602. [DOI] [PubMed] [Google Scholar]
- 5.Halberg RB, et al. Tumorigenesis in the multiple intestinal neoplasia mouse: redundancy of negative regulators and specificity of modifiers. Proc Natl Acad Sci U S A. 2000;97(7):3461–3466. doi: 10.1073/pnas.050585597. [DOI] [PMC free article] [PubMed] [Google Scholar]
- 6.Fearon ER, Vogelstein B. A genetic model for colorectal tumorigenesis. Cell. 1990;61(5):759–767. doi: 10.1016/0092-8674(90)90186-I. [DOI] [PubMed] [Google Scholar]
- 7.Merlos-Suarez A, et al. The intestinal stem cell signature identifies colorectal cancer stem cells and predicts disease relapse. Cell Stem Cell. 2011;8(5):511–524. doi: 10.1016/j.stem.2011.02.020. [DOI] [PubMed] [Google Scholar]
- 8.Dylla SJ, et al. Colorectal cancer stem cells are enriched in xenogeneic tumors following chemotherapy. PLoS One. 2008;3(6):e2428. doi: 10.1371/journal.pone.0002428. [DOI] [PMC free article] [PubMed] [Google Scholar]
- 9.Ricci-Vitiani L, et al. Identification and expansion of human colon-cancer-initiating cells. Nature. 2007;445(7123):111–115. doi: 10.1038/nature05384. [DOI] [PubMed] [Google Scholar]
- 10.Emmink BL, et al. Differentiated human colorectal cancer cells protect tumor-initiating cells from irinotecan. Gastroenterology. 2011;141(1):269–278. doi: 10.1053/j.gastro.2011.03.052. [DOI] [PubMed] [Google Scholar]
- 11.Sonoshita M, et al. Suppression of colon cancer metastasis by Aes through inhibition of Notch signaling. Cancer Cell. 2011;19(1):125–137. doi: 10.1016/j.ccr.2010.11.008. [DOI] [PubMed] [Google Scholar]
- 12.Din FV, et al. Effect of aspirin and NSAIDs on risk and survival from colorectal cancer. Gut. 2010;59(12):1670–1679. doi: 10.1136/gut.2009.203000. [DOI] [PubMed] [Google Scholar]
- 13. Kabelitz D, Wesch D. Features and functions of gamma delta T lymphocytes: focus on chemokines and their receptors. Crit Rev Immunol. 2003. 2003; 23 5–6 339 370 10.1615/CritRevImmunol.v23.i56.10 [DOI] [PubMed] [Google Scholar]
- 14.Youn BS, Kim YJ, Mantel C, Yu KY, Broxmeyer HE. Blocking of c-FLIP(L)—independent cycloheximide-induced apoptosis or Fas-mediated apoptosis by the CC chemokine receptor 9/TECK interaction. Blood. 2001;98(4):925–933. doi: 10.1182/blood.V98.4.925. [DOI] [PubMed] [Google Scholar]
- 15.Wurbel MA, McIntire MG, Dwyer P, Fiebiger E. CCL25/CCR9 interactions regulate large intestinal inflammation in a murine model of acute colitis. PLoS One. 2011;6(1):e16442. doi: 10.1371/journal.pone.0016442. [DOI] [PMC free article] [PubMed] [Google Scholar]
- 16.LaPointe LC, et al. Map of differential transcript expression in the normal human large intestine. Physiol Genomics. 2008;33(1):50–64. doi: 10.1152/physiolgenomics.00185.2006. [DOI] [PubMed] [Google Scholar]
- 17.Li X, Madison BB, Zacharias W, Kolterud A, States D, Gumucio DL. Deconvoluting the intestine: molecular evidence for a major role of the mesenchyme in the modulation of signaling cross talk. Physiol Genomics. 2007;29(3):290–301. doi: 10.1152/physiolgenomics.00269.2006. [DOI] [PubMed] [Google Scholar]
- 18.Hart AL, Ng SC, Mann E, Al-Hassi HO, Bernardo D, Knight SC. Homing of immune cells: role in homeostasis and intestinal inflammation. Inflamm Bowel Dis. 2010;16(11):1969–1977. doi: 10.1002/ibd.21304. [DOI] [PubMed] [Google Scholar]
- 19.Shang L, et al. Expression of the chemokine binding protein M3 promotes marked changes in the accumulation of specific leukocytes subsets within the intestine. Gastroenterology. 2009;137(3):1006–1018. doi: 10.1053/j.gastro.2009.05.055. [DOI] [PMC free article] [PubMed] [Google Scholar]
- 20.Zaballos A, Gutierrez J, Varona R, Ardavin C, Marquez G. Cutting edge: identification of the orphan chemokine receptor GPR-9-6 as CCR9, the receptor for the chemokine TECK. J Immunol. 1999;162(10):5671–5675. [PubMed] [Google Scholar]
- 21.Amersi FF, et al. Activation of CCR9/CCL25 in cutaneous melanoma mediates preferential metastasis to the small intestine. Clin Cancer Res. 2008;14(3):638–645. doi: 10.1158/1078-0432.CCR-07-2025. [DOI] [PMC free article] [PubMed] [Google Scholar]
- 22.Johnson EL, et al. CCR9 interactions support ovarian cancer cell survival and resistance to cisplatin-induced apoptosis in a PI3K-dependent and FAK-independent fashion. J Ovarian Res. 2010;3:15. doi: 10.1186/1757-2215-3-15. [DOI] [PMC free article] [PubMed] [Google Scholar]
- 23.Johnson-Holiday C, et al. CCL25 mediates migration, invasion and matrix metalloproteinase expression by breast cancer cells in a CCR9-dependent fashion. Int J Oncol. 2011;38(5):1279–1285. doi: 10.3892/ijo.2011.953. [DOI] [PMC free article] [PubMed] [Google Scholar]
- 24.Sharma PK, Singh R, Novakovic KR, Eaton JW, Grizzle WE, Singh S. CCR9 mediates PI3K/AKT-dependent antiapoptotic signals in prostate cancer cells and inhibition of CCR9-CCL25 interaction enhances the cytotoxic effects of etoposide. Int J Cancer. 2010;127(9):2020–2030. doi: 10.1002/ijc.25219. [DOI] [PubMed] [Google Scholar]
- 25.Singh S, Singh UP, Stiles JK, Grizzle WE, Lillard JW., Jr Expression and functional role of CCR9 in prostate cancer cell migration and invasion. Clin Cancer Res. 2004;10(24):8743–8750. doi: 10.1158/1078-0432.CCR-04-0266. [DOI] [PubMed] [Google Scholar]
- 26.Sikandar S, Dizon D, Shen X, Li Z, Besterman J, Lipkin SM. The class I HDAC inhibitor MGCD0103 induces cell cycle arrest and apoptosis in colon cancer initiating cells by upregulating Dickkopf-1 and non-canonical Wnt signaling. Oncotarget. 2010;1(7):666–690. doi: 10.18632/oncotarget.194. [DOI] [PMC free article] [PubMed] [Google Scholar]
- 27.Sikandar SS, et al. NOTCH signaling is required for formation and self-renewal of tumor-initiating cells and for repression of secretory cell differentiation in colon cancer. Cancer Res. 2010;70(4):1469–1478. doi: 10.1158/0008-5472.CAN-09-2557. [DOI] [PMC free article] [PubMed] [Google Scholar]
- 28.Lira SA, et al. Conditional transgenic models to study chemokine biology. Methods Mol Biol. 2004;239:105–122. doi: 10.1385/1-59259-435-2:105. [DOI] [PubMed] [Google Scholar]
- 29.Pang R, et al. A subpopulation of CD26+ cancer stem cells with metastatic capacity in human colorectal cancer. Cell Stem Cell. 2010;6(6):603–615. doi: 10.1016/j.stem.2010.04.001. [DOI] [PubMed] [Google Scholar]
- 30.Pena C, et al. SNAI1 expression in colon cancer related with CDH1 and VDR downregulation in normal adjacent tissue. Oncogene. 2009;28(49):4375–4385. doi: 10.1038/onc.2009.285. [DOI] [PubMed] [Google Scholar]
- 31.Palmer HG, et al. The transcription factor SNAIL represses vitamin D receptor expression and responsiveness in human colon cancer. Nat Med. 2004;10(9):917–919. doi: 10.1038/nm1095. [DOI] [PubMed] [Google Scholar]
- 32.Kopan R, Ilagan MX. The canonical Notch signaling pathway: unfolding the activation mechanism. Cell. 2009;137(2):216–233. doi: 10.1016/j.cell.2009.03.045. [DOI] [PMC free article] [PubMed] [Google Scholar]
- 33.Harrison H, Farnie G, Brennan K, Clarke R. Breast cancer stem cells: something out of Notching? Cancer Res. 2010;70(22):8973–8976. doi: 10.1158/0008-5472.CAN-10-1559. [DOI] [PubMed] [Google Scholar]
- 34.Taketo MM. Reflections on the spread of metastasis to cancer prevention. Cancer Prev Res (Phila). 2011;4(3):324–328. doi: 10.1158/1940-6207.CAPR-11-0046. [DOI] [PubMed] [Google Scholar]
- 35.Baba Y, et al. Phosphorylated AKT expression is associated with PIK3CA mutation, low stage, and favorable outcome in 717 colorectal cancers. Cancer. 2011;117(7):1399–1408. doi: 10.1002/cncr.25630. [DOI] [PMC free article] [PubMed] [Google Scholar]
- 36.Yeung TM, Chia LA, Kosinski CM, Kuo CJ. Regulation of self-renewal and differentiation by the intestinal stem cell niche. Cell Mol Life Sci. 2011;68(15):2513–2523. doi: 10.1007/s00018-011-0687-5. [DOI] [PMC free article] [PubMed] [Google Scholar]
- 37.Fre S, et al. Epithelial morphogenesis and intestinal cancer: new insights in signaling mechanisms. Adv Cancer Res. 2008;100:85–111. doi: 10.1016/S0065-230X(08)00003-1. [DOI] [PubMed] [Google Scholar]
- 38.Riccio O, et al. Loss of intestinal crypt progenitor cells owing to inactivation of both Notch1 and Notch2 is accompanied by derepression of CDK inhibitors p27Kip1 and p57Kip2. EMBO Rep. 2008;9(4):377–383. doi: 10.1038/embor.2008.7. [DOI] [PMC free article] [PubMed] [Google Scholar]
- 39.Vooijs M, et al. Mapping the consequence of Notch1 proteolysis in vivo with NIP-CRE. Development. 2007;134(3):535–544. doi: 10.1242/dev.02733. [DOI] [PMC free article] [PubMed] [Google Scholar]
- 40.de Lau W, Barker N, Clevers H. WNT signaling in the normal intestine and colorectal cancer. Front Biosci. 2007;12:471–491. doi: 10.2741/2076. [DOI] [PubMed] [Google Scholar]
- 41.Meng RD, et al. gamma-Secretase inhibitors abrogate oxaliplatin-induced activation of the Notch-1 signaling pathway in colon cancer cells resulting in enhanced chemosensitivity. Cancer Res. 2009;69(2):573–582. doi: 10.1158/0008-5472.CAN-08-2088. [DOI] [PMC free article] [PubMed] [Google Scholar]
- 42.Steg AD, et al. Targeting the notch ligand JAGGED1 in both tumor cells and stroma in ovarian cancer. Clin Cancer Res. 2011;17(17):5674–5685. doi: 10.1158/1078-0432.CCR-11-0432. [DOI] [PMC free article] [PubMed] [Google Scholar]
- 43.Wu Y, et al. Therapeutic antibody targeting of individual Notch receptors. Nature. 2010;464(7291):1052–1057. doi: 10.1038/nature08878. [DOI] [PubMed] [Google Scholar]
- 44.Jubb AM, et al. Expression of delta-like ligand 4 (Dll4) and markers of hypoxia in colon cancer. Br J Cancer. 2009;101(10):1749–1757. doi: 10.1038/sj.bjc.6605368. [DOI] [PMC free article] [PubMed] [Google Scholar]
- 45.Ridgway J, et al. Inhibition of Dll4 signalling inhibits tumour growth by deregulating angiogenesis. Nature. 2006;444(7122):1083–1087. doi: 10.1038/nature05313. [DOI] [PubMed] [Google Scholar]
- 46.Wang T, Baron M, Trump D. An overview of Notch3 function in vascular smooth muscle cells. Prog Biophys Mol Biol. 2008;96(1–3):499–509. doi: 10.1016/j.pbiomolbio.2007.07.006. [DOI] [PubMed] [Google Scholar]
- 47.Vooijs M, Liu Z, Kopan R. Notch: architect, landscaper, and guardian of the intestine. Gastroenterology. 2011;141(2):448–459. doi: 10.1053/j.gastro.2011.06.003. [DOI] [PMC free article] [PubMed] [Google Scholar]
- 48.Guilmeau S, Flandez M, Mariadason JM, Augenlicht LH. Heterogeneity of Jagged1 expression in human and mouse intestinal tumors: implications for targeting Notch signaling. Oncogene. 2010;29(7):992–1002. doi: 10.1038/onc.2009.393. [DOI] [PubMed] [Google Scholar]
- 49.Yanai H, et al. Dlk-1, a cellourface antigen on foetal hepatic stem/progenitor cells, is expressed in hepatocellular, colon, pancreas and breast carcinomas at a high frequency. J Biochem. 2010;148(1):85–92. doi: 10.1093/jb/mvq034. [DOI] [PubMed] [Google Scholar]
- 50.Burger JA, Kipps TJ. CXCR4: a key receptor in the crosstalk between tumor cells and their microenvironment. Blood. 2006;107(5):1761–1767. doi: 10.1182/blood-2005-08-3182. [DOI] [PubMed] [Google Scholar]
- 51.Rettig MP, Ansstas G, DiPersio JF. Mobilization of hematopoietic stem and progenitor cells using inhibitors of CXCR4 and VLA-4. Leukemia. 2012;26(1):34–53. doi: 10.1038/leu.2011.197. [DOI] [PMC free article] [PubMed] [Google Scholar]
- 52.Rettig MP, Ramirez P, Nervi B, DiPersio JF. CXCR4 and mobilization of hematopoietic precursors. Methods Enzymol. 2009;460:57–90. doi: 10.1016/S0076-6879(09)05203-3. [DOI] [PubMed] [Google Scholar]
- 53.Uy GL, Rettig MP, Cashen AF. Plerixafor, a CXCR4 antagonist for the mobilization of hematopoietic stem cells. Expert Opin Biol Ther. 2008;8(11):1797–1804. doi: 10.1517/14712598.8.11.1797. [DOI] [PubMed] [Google Scholar]
- 54.Damon LE. Mobilization of hematopoietic stem cells into the peripheral blood. Expert Rev Hematol. 2009;2(6):717–733. doi: 10.1586/ehm.09.54. [DOI] [PubMed] [Google Scholar]
- 55.Peled A, Wald O, Burger J. Development of novel CXCR4-based therapeutics. Expert Opin Investig Drugs. 2012;21(3):341–353. doi: 10.1517/13543784.2012.656197. [DOI] [PubMed] [Google Scholar]
- 56.Hung KE, et al. Development of a mouse model for sporadic and metastatic colon tumors and its use in assessing drug treatment. Proc Natl Acad Sci U S A. 2010;107(4):1565–1570. doi: 10.1073/pnas.0908682107. [DOI] [PMC free article] [PubMed] [Google Scholar]
- 57.Wendt MK, Molter J, Flask CA, Schiemann WP. J Vis Exp. In vivo dual substrate bioluminescent imaging. p. 3245. 2011(56).pii: [DOI] [PMC free article] [PubMed] [Google Scholar]
- 58.Johnson EL, et al. CCL25-CCR9 interaction modulates ovarian cancer cell migration, metalloproteinase expression, and invasion. World J Surg Oncol. 2010;8:62. doi: 10.1186/1477-7819-8-62. [DOI] [PMC free article] [PubMed] [Google Scholar]
- 59.Vermeulen L, et al. Single-cell cloning of colon cancer stem cells reveals a multi-lineage differentiation capacity. Proc Natl Acad Sci U S A. 2008;105(36):13427–13432. doi: 10.1073/pnas.0805706105. [DOI] [PMC free article] [PubMed] [Google Scholar]
- 60.Pastor DM, et al. Primary cell lines: false representation or model system? a comparison of four human colorectal tumors and their coordinately established cell lines. Int J Clin Exp Med. 2010;3(1):69–83. [PMC free article] [PubMed] [Google Scholar]
- 61.Booth C, O’Shea JA. Culture of Epithelial Cells. 2002. Isolation and culture of intestinal epithelial cells. In: Freshney RI, Freshney MG, eds. pp. 303–335. 2nd ed. New York, New York, USA: John Wiley & Sons, Inc.; [Google Scholar]
- 62.Nickoloff BJ, Qin JZ, Chaturvedi V, Denning MF, Bonish B, Miele L. Jagged-1 mediated activation of notch signaling induces complete maturation of human keratinocytes through NF-kappaB and PPARgamma. Cell Death Differ. 2002;9(8):842–855. doi: 10.1038/sj.cdd.4401036. [DOI] [PubMed] [Google Scholar]
- 63.Weijzen S, et al. The Notch ligand Jagged-1 is able to induce maturation of monocyte-derived human dendritic cells. J Immunol. 2002;169(8):4273–4278. doi: 10.4049/jimmunol.169.8.4273. [DOI] [PubMed] [Google Scholar]
- 64.Ma XB, et al. Expression and role of Notch signalling in the regeneration of rat tracheal epithelium. Cell Prolif. 2009;42(1):15–28. doi: 10.1111/j.1365-2184.2008.00569.x. [DOI] [PMC free article] [PubMed] [Google Scholar]
- 65.Svensson M, et al. CCL25 mediates the localization of recently activated CD8alphabeta(+) lymphocytes to the small-intestinal mucosa. J Clin Invest. 2002;110(8):1113–1121. doi: 10.1172/JCI15988. [DOI] [PMC free article] [PubMed] [Google Scholar]
Associated Data
This section collects any data citations, data availability statements, or supplementary materials included in this article.