

Abstract
Amyotrophic lateral sclerosis (ALS) is a progressive disease associated with neuronal cell death that is thought to involve aberrant immune responses. Here we investigated the role of innate immunity in a mouse model of ALS. We found that inflammatory monocytes were activated and that their progressive recruitment to the spinal cord, but not brain, correlated with neuronal loss. We also found a decrease in resident microglia in the spinal cord with disease progression. Prior to disease onset, splenic Ly6Chi monocytes expressed a polarized macrophage phenotype (M1 signature), which included increased levels of chemokine receptor CCR2. As disease onset neared, microglia expressed increased CCL2 and other chemotaxis-associated molecules, which led to the recruitment of monocytes to the CNS by spinal cord–derived microglia. Treatment with anti-Ly6C mAb modulated the Ly6Chi monocyte cytokine profile, reduced monocyte recruitment to the spinal cord, diminished neuronal loss, and extended survival. In humans with ALS, the analogous monocytes (CD14+CD16–) exhibited an ALS-specific microRNA inflammatory signature similar to that observed in the ALS mouse model, linking the animal model and the human disease. Thus, the profile of monocytes in ALS patients may serve as a biomarker for disease stage or progression. Our results suggest that recruitment of inflammatory monocytes plays an important role in disease progression and that modulation of these cells is a potential therapeutic approach.
Introduction
ALS causes progressive weakness associated with degeneration of motor neurons. Mutations in more than 50 human genes cause diverse types of motor neuron pathology (1). Although ALS is not primarily considered an inflammatory or immune-mediated disease, immune mechanisms appear to play a role in pathogenesis of the disease. In both ALS patients and animal models, inflammatory responses are observed (2–8). Furthermore, non-neuronal cells such as microglia (9) and astrocytes (10) are activated during disease progression, and evidence suggests that they contribute to neuronal death. It has been reported that in the CNS, natural killer cells and peripheral T cells infiltrate the spinal cord (11). In addition, selective ablation of mutant SOD1 in astrocytes and microglial cells by conditional deletion (9) and neonatal wild-type bone marrow transplantation (6) increased motor neuron survival and lifespan. T cell deficiency has also been shown to lead to accelerated disease progression in SOD1 mice (3). In the peripheral nervous system, degeneration of peripheral motor axons is an early pathologic feature in ALS patients and mouse models and is preceded by the recruitment and activation of macrophages (5). Clinical trials of antiinflammatory agents in ALS have failed to show efficacy (e.g., minocycline, ref. 12; thalidomide, ref. 13; celecoxib, ref. 14; cyclophosphamide, refs. 15, 16). Nonetheless, none of these treatments were specifically targeted to the inflammatory pathways that are activated in ALS. Of note, a molecule targeting macrophage activation, NP001, is currently in phase II testing (Clinicaltrials.org NCT01091142) and may represent a more selective immunologic approach to the treatment of ALS.
It is known that the Ly6ChiCCR2+ monocyte subset participates in tissue damage and disease pathogenesis in other conditions, including the EAE model of MS (17) and both brain (18) and heart ischemia (19) and that these monocytes are recruited to the inflamed tissues by CCL2 (19–21). Several groups have documented increased levels of CCL2 in the CSF and spinal cord of ALS patients (7, 22). We investigated monocytes and resident microglial cells in the G93A transgenic SOD1 mouse model of ALS and the human analog of Ly6C monocyte subsets in human subjects with ALS.
Results
Reciprocal expression of CD39 and Ly6C in CNS-resident microglia and inflammatory monocytes.
One of the major challenges confronting the study of monocytes/macrophages and their role in CNS inflammation in neurodegenerative diseases such as ALS is the ability to distinguish infiltrating peripheral monocytes from resident microglia in the CNS (23). During the course of our investigation of immune markers on monocytes and microglia, we discovered that the expression of Ly6C and CD39 distinguishes non-overlapping populations of peripheral inflammatory monocytes and resident microglia in mice (Supplemental Figures 1 and 2; supplemental material available online with this article; doi: 10.1172/JCI62636DS1). Ly6Chi is a marker for recruited CCR2+ proinflammatory monocytes (20, 24, 25), and CD39 is present on a subset of regulatory T cells (26) and has been shown to be associated with microglia (27). We analyzed CD39 (ectonucleoside triphosphate diphosphohydrolase [Entpd1]) and Ly6C (Ly6c1) expression on microglia from naive adult mouse brains (perfused for removal of non-CNS cells) compared with other immune cells (Figure 1A) and organ-specific CD11b-sorted macrophages (Figure 1, B and C). As shown by real-time quantitative RT-PCR (qRT-PCR), Entpd1 and Ly6c1 identified reciprocal populations (Figure 1, B and C). These findings were confirmed by FACS analysis of CD11b-sorted cells from naive adult CNS, bone marrow, PBMCs, and spleen (Figure 1D). In naive animals, specificity for microglia as measured by flow cytometry was observed both with our anti-CD39 mAb (clone 5E12) and with commercially obtained anti-CD39 antibody (eBioscience, Supplemental Figure 2E). In inflammatory conditions such as EAE and glioblastoma mouse models, microglia sepcificity was only observed with our anti-CD39 mAb.
Figure 1. Reciprocal expression of CD39 and Ly6C in CNS-resident microglia and inflammatory monocytes.

(A) Real-time quantitative RT-PCR (qRT-PCR) of Endtp1 (CD39) relative expression in adult microglia (CD11b+CD45lo), alveolar macrophages (Alv Macs), neutrophils (Ly-6G+), T cells (CD3+), B cells (B220+), NK cells (NK1.1+), and regulatory T cells (CD4+CD25+Foxp3+) from naive adult C57BL/6J mice. (B) Endtp1 and (C) Ly6c1 (Ly6C) expression (qRT-PCR) in adult microglia and CD11b+ sorted cells from liver, heart, muscle, and kidney, and Ly6C– and Ly6C+ monocyte subsets sorted with 6C3 mAb from PBMCs, spleen, and bone marrow. Expression levels were normalized to Gapdh. (D) Flow cytometry histograms show MFI of surface expression of CD39 and Ly6C in organ-specific CD11b-gated cells compared with isotype control (IC) (open histograms) from naive B6 mice. The numbers show percentage of CD39+ cells (left panels) and Ly6Clo and Ly6Chi monocytes (right panels). Each histogram panel represents a pool of 3–5 mice. Results are representative of 2 independent experiments.
Activation of the chemotaxis pathway in CD39+ resident microglia in the spinal cord but not in the brain of SOD1 mice.
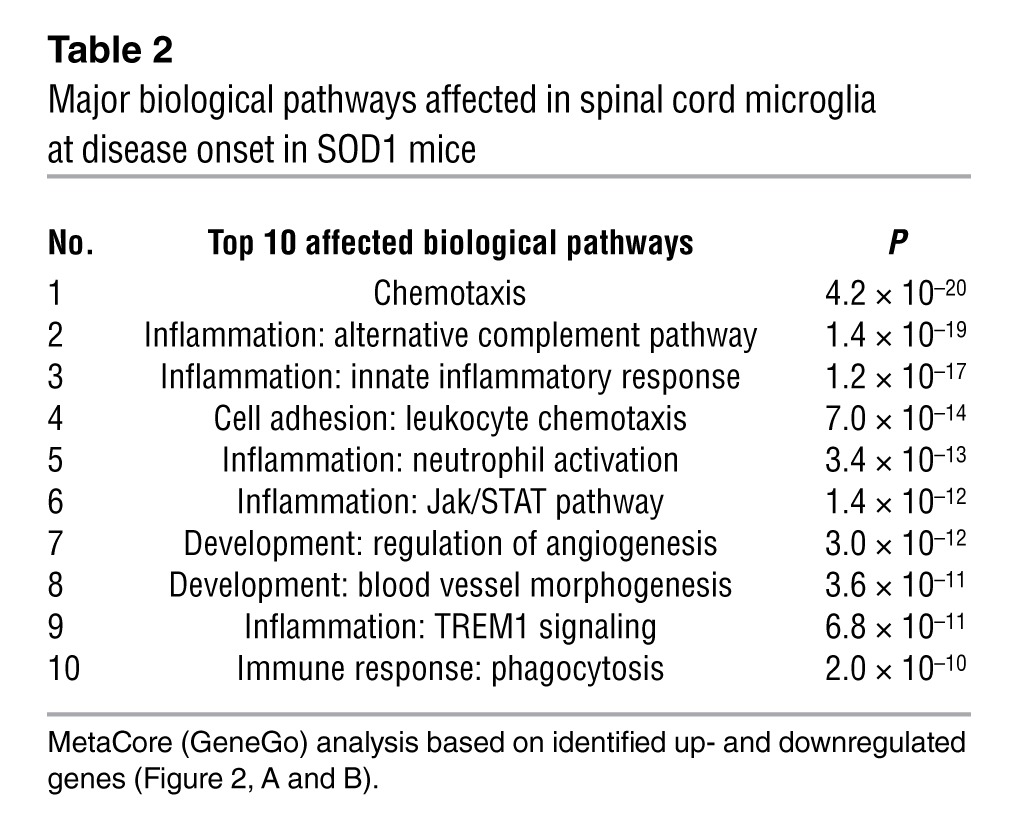
Our ability to distinguish infiltrating monocytes from resident microglia allowed us to perform expression profiling of CD11b+CD39+ microglia isolated from the spinal cord and brain of SOD1+ mice at different stages of disease. We used NanoString nCounter gene expression, which is more sensitive than microarrays, similar in accuracy to real-time PCR, and more scalable than real-time PCR or microarrays in terms of sample requirements (28–30). Importantly, it does not require conversion of mRNA to cDNA by reverse transcription or the amplification of the resulting cDNA by PCR (31) and allows expression analysis of up to 800 genes from as few as 3000 cells; it is thus perfectly suited for analysis of the limited number of cells infiltrating the CNS. Of 179 inflammation-related genes measured by quantitative nCounter, 20 were upregulated (Figure 2A) and 38 were downregulated relative to non-transgenic (non-Tg) mice in spinal cord CD39+ resident microglia (Figure 2B). Microglia had prominent expression of genes related to chemotaxis (e.g., Ccl2, Ccl3, Ccl4, Ccl5, Cxcr4, and Cxcl10). Tgfb1 and Tgfbr1 were among the downregulated genes. Biological network analysis (MetaCore, GeneGo Inc.) identified key transcription factors and target genes (Table 1) and activation of inflammatory pathways, with the chemotaxis pathway being the most significantly affected (Table 2). The expression of these genes was observed 1 month prior to symptom onset and was observed in the spinal cord, but not in the brain (Figure 2C).
Figure 2. Activation of the chemotaxis pathway in CD39+ resident microglia in the spinal cord but not the brain of SOD1 mice.

(A) Quantitative nCounter expression profiling of 179 inflammation-related genes was performed in spinal cord–derived CD39+ microglia from SOD1 mice and compared with non-Tg littermates at presymptomatic (60 days), onset (defined by body weight loss), and end stages. Heatmap shows genes with at least 2-fold-altered transcription levels. Each row of the heatmap represents an individual gene and each column an individual group in biological triplicate (n = 3 arrays for each group from pool of 4–5 mice at each time point). The relative abundance of transcripts is indicated by a color scale (red, high; green, median; blue, low). Bars show relative expression of significantly up- or downregulated genes in SOD1 mice from non-Tg littermates at each time point. Twenty significantly upregulated genes are shown in A, and 38 significantly downregulated genes are shown in B. Data for A and B represent mean ± SD. All shown genes were significantly affected (P < 0.05). The complete list of P values for each significantly affected gene is shown in Supplemental Table 1. Gene expression level was normalized against the geometric mean of 6 housekeeping genes (Cltc, Gapdh, Gusb, Hprt1, Pgk1, Tubb5). (C) Comparative analysis of significantly upregulated genes in CD39+ microglia from spinal cords of SOD1 mice at onset versus microglia isolated from the brain of the same mice.
Table 1.
Key transcription factors and target genes affected in spinal cord microglia at disease onset in SOD1 mice
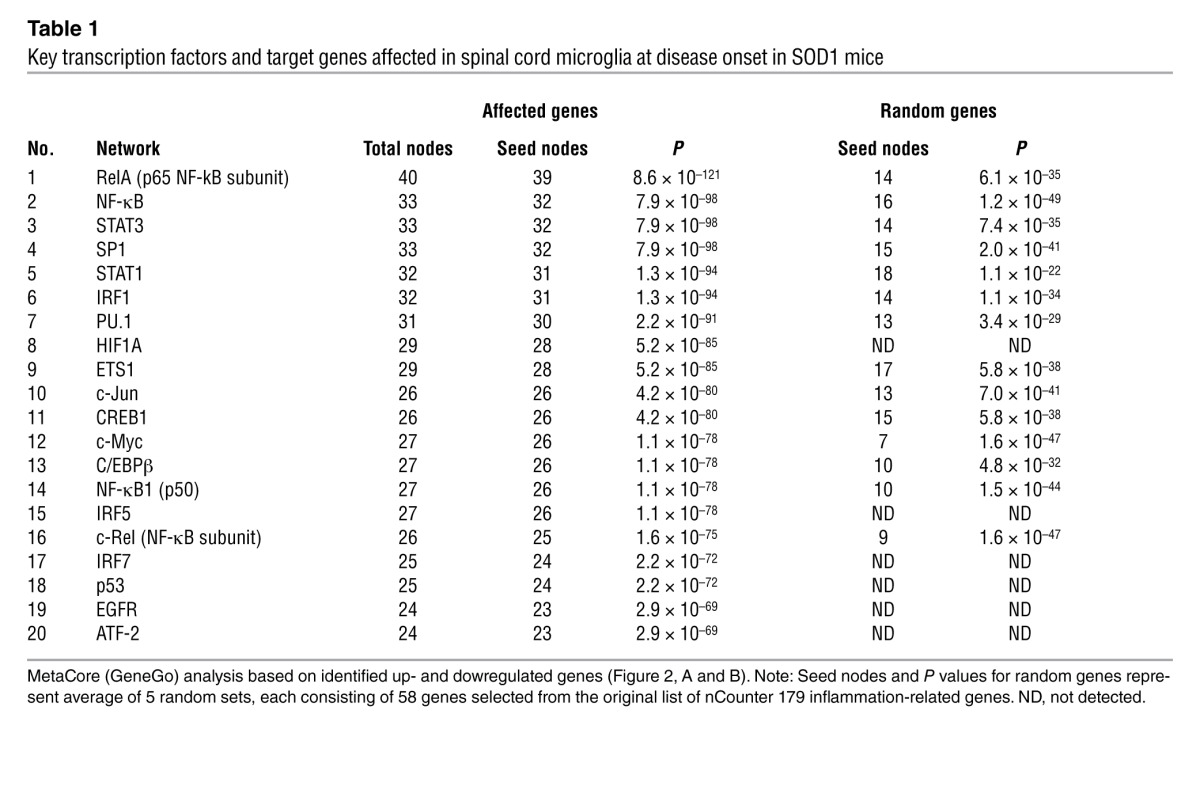
Table 2.
Major biological pathways affected in spinal cord microglia at disease onset in SOD1 mice
Ly6Chi monocytes in the spleen exhibit a proinflammatory profile 2 months prior to clinical disease onset and during disease progression in SOD1 mice.
We examined the gene expression profile of Ly6Chi monocytes isolated from the spleen of SOD1 mice at 1 and 2 months prior to clinical disease onset and during disease progression. We found a pronounced proinflammatory profile at all time points (Figure 3A). Of 179 inflammation-related genes measured by nCounter, 40 were upregulated relative to non-Tg mice. We also identified 7 genes that were downregulated in Ly6Chi cells, including the antiinflammatory cytokine Tgfb1 and Tgfbr1 (Figure 3B). Of note, we did not find differences in the inflammatory signature between non-Tg and SOD1WT mice in CD39+ spinal cord microglia or splenic Ly6Chi monocytes at onset and end-stage disease (data not shown).
Figure 3. Ly6Chi monocytes in the spleen exhibit a proinflammatory profile 2 months prior to clinical disease onset and during disease progression in SOD1 mice.

Quantitative nCounter expression profiling of 179 inflammation-related genes showing significantly (A) upregulated and (B) downregulated genes in splenic Ly6Chi monocytes compared with non-Tg littermates of the same mice analyzed in Figure 2 at presymptomatic (30 and 60 days of age), disease onset, and end stages. Data for A and B represent mean ± SD. All shown genes were significantly affected (P < 0.05). The complete list of P values for each significantly affected gene is shown in Supplemental Table 2. Gene expression level was normalized against the geometric mean of 6 housekeeping genes (Cltc, Gapdh, Gusb, Hprt1, Pgk1, Tubb5). (C) qRT-PCR analysis of Ahr mRNA expression in splenic Ly6C monocyte subsets sorted by flow cytometry from non-Tg, SOD1WT, and SOD1G93A mice at disease onset. Total RNA was isolated and pooled from 3–5 mice for each cell population. Expression levels were normalized to Gapdh. Data represent mean ± SEM. ***P < 0.001, Student’s t test (2-tailed). Results are representative of 2 independent experiments.
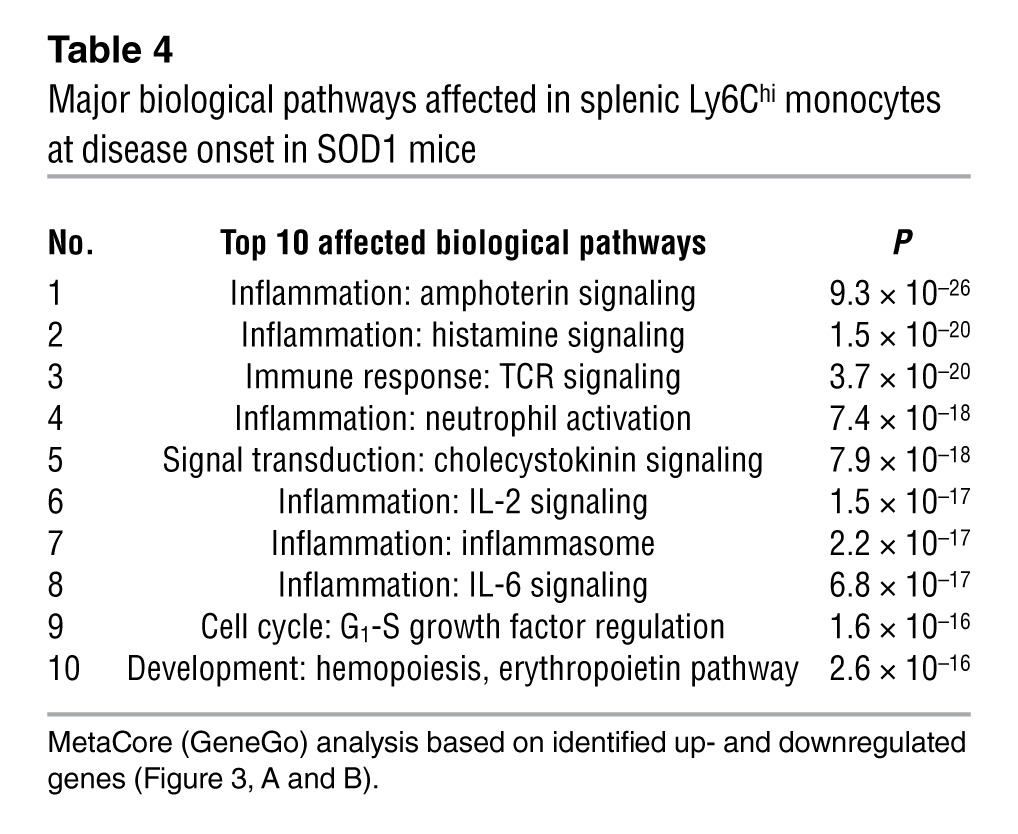
Biologic network (Table 3) and pathway (Table 4) analysis (MetaCore, GeneGo) demonstrated that the most significantly affected pathways related to inflammation, which included SP1, CREB1, and NF-κB (Table 3 and Supplemental Figure 3). These pathways have been shown to play an important role in both monocyte activation and differentiation (32, 33). Thus, the gene expression profiling demonstrates an activated proinflammatory Ly6Chi monocyte population in the peripheral immune compartment of SOD1 mice that we observed 2 months prior to disease onset.
Table 3.
Key transcription factors and target genes affected in splenic Ly6Chi monocytes at disease onset in SOD1 mice
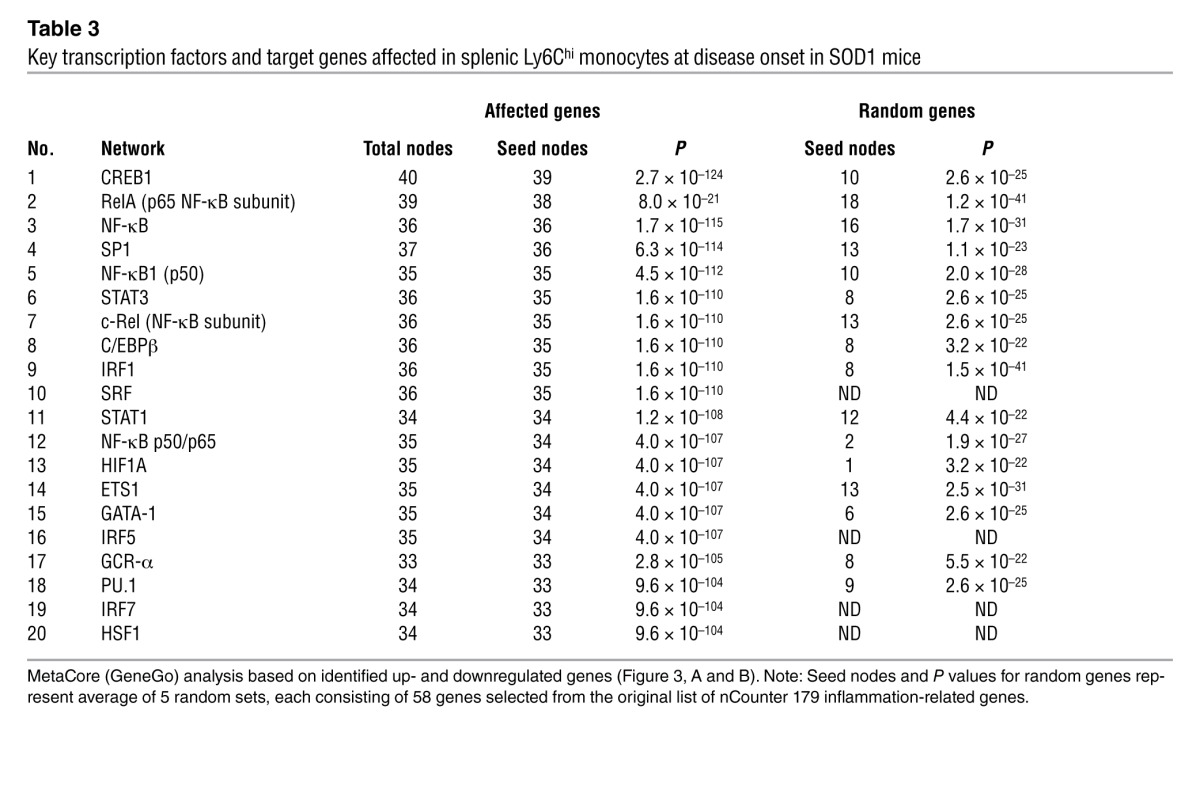
Table 4.
Major biological pathways affected in splenic Ly6Chi monocytes at disease onset in SOD1 mice
The gene expression differences between non-Tg and SOD1 microglia and monocytes were determined starting from a set containing only inflammatory response–related genes. Because this may have led to a bias toward networks related to inflammation, we performed additional analysis based on a random selection of genes from the original list and found that the networks identified were indeed statistically significant relative to the network identified based on random analysis (Tables 1 and 3). Furthermore, by interrogating gene expression found in the network analysis, but not tested by the nCounter assay set, we found that Ahr (aryl hydrocarbon receptor), which is implicated in the SP1 and NF-κB networks and was found to trigger the downstream NF-κB and CREB1 signaling (34, 35), was significantly upregulated in Ly6Chi monocytes but not in Ly6Clo monocytes in SOD1 mice (Figure 3C). Thus, we not only identified a gene independent of the nCounter set, we further verified the link between monocyte subsets in ALS subjects and the SOD1 mouse (see below).
Changes in microRNA profiles of spleen-derived Ly6Chi monocytes and spinal cord–derived CD39+ microglia during the course of disease.
MicroRNAs (miRNAs) belong to a family of small, non-protein-coding RNAs that regulate expression of multiple target genes and are involved in fundamental biological processes. Several hundred mammalian miRNAs have been identified, many of which are tissue specific and modulate hematopoietic lineage differentiation (36). Affected expression of specific miRNAs is associated with pathologic processes including heart disease (37), cancer (38), Alzheimer’s disease (39), and autoimmune inflammation (40). To investigate microglia and the Ly6Chi monocyte subset, we performed miRNA analysis of these populations in the spleens of SOD1 mice at the presymptomatic stage (60 days), at the onset of symptoms, and at end-stage disease. To our knowledge, no study to date has investigated miRNAs in the immune system in ALS. miRNA profiling of spleen-derived Ly6Chi monocytes during all stages of disease (Figure 4A) showed 34 significantly affected miRNAs in Ly6Chi cells, confirmed by Singleplex TaqMan PCR (Figure 4B). Inflammation-related miRNAs such as let-7a (41), let-7b (42), miR-27a (43), miR-146a (44), miR-451 (45), miR-223 (46), miR-142-5p (47), and miR-155 (48) were significantly upregulated in the Ly6Chi subset in the spleen 1 month prior to clinical onset and during disease progression in SOD1 mice (Figure 4, A and B). These miRNAs have been shown to be upregulated during inflammatory responses. Thus, miR-146a was identified as a regulator of Ly6Chi monocyte function in inflammation (49), and miR-155 has been shown to promote tissue inflammation (48) and macrophage inflammatory responses (50–52) and to be upregulated in EAE (53) and MS lesions (54). Furthermore, miR-155 has been implicated in increasing proinflammatory cytokine secretion by targeting SOCS1 mRNA (55), thereby releasing the intrinsic cellular “brake” on cytokine secretion.
Figure 4. Changes in miRNA profiles of spleen-derived Ly6Chi monocytes during the course of disease.

(A) miRNA profiling of splenic Ly6Chi monocytes compared with non-Tg mice at presymtomatic (60 days), onset (defined by body weight loss), and end stages of disease was performed by rodent TLDA (containing 364 mouse miRNA assays; 2 arrays for each group, pool of 6–8 mice per group). Heatmap shows miRNAs with at least 2-fold-altered transcription levels. Microarray data were normalized using quantile (R software; http://www.r-project.org/) normalization. Each row of the heatmap represents an individual miRNA and each column an individual group in biological duplicate. The relative abundance of transcripts is indicated by a color scale (red, high; green, median; blue, low). (B) Summary of significantly affected miRNAs in splenic Ly6Chi monocytes in SOD1 mice compared with non-Tg mice validated in Singleplex qRT-PCR. Data represent mean ± SD. All shown miRNAs were significantly affected (P < 0.05). miRNA expression level was normalized using ΔCt against U6 miRNA.
miRNA target scan Ingenuity pathway analysis (IPA) based on miRNA (Figure 4B) and inflammation-related quantitative NanoString analysis (Figure 3, A and B) revealed that the top 10 miRNA-mRNA interactions unique in Ly6Chi splenic monocytes were related to proinflammatory genes (including Tnf, Myd88, Stat1, Ccr2, Tlr2, Myc, Jun, Cd40, H2-Eb1) that are associated with the M1 monocyte phenotype. The top 10 affected miRNAs in Ly6hi splenic monocytes (at onset) yielded 58 miRNA-mRNA interactions (Figure 5) with 47 affected inflammatory genes. In addition to performing miRNA profiles of Ly6Chi subsets, we performed miRNA analysis of microglial cells at different stages of disease (Figure 6A) and found 26 miRNAs that were upregulated and 2 downregulated, as confirmed by Singleplex qRT-PCR (Figure 6B). For CD39+ microglia, the top 10 affected miRNAs yielded 80 miRNA-mRNA interactions (Figure 7) with 58 affected inflammatory genes. To assess the significance of the observed interactions of the top 10 miRNA families from IPA, we mapped the miRNA families and mRNAs to the list of possible predicted miRNA-mRNA interactions in TargetScan 4.1. This resulted in 18 miRNAs showing 80 interactions in CD39+ spinal cord microglia and 17 miRNAs in Ly6Chi splenic monocytes showing 51 interactions with the affected inflammatory genes in each case. We removed the affected inflammatory genes from the database of all possible miRNA targets to assess the specificity of interaction of the observed miRNAs with non-inflammatory genes. In each case, we generated 1,000 random sets of these non-inflammatory genes (for CD39+ microglia each set contained 40 genes, and for Ly6Chi monocytes each set contained 33 genes), and we identified their predicted interactions with the affected miRNAs. The mean number of random interactions identified for CD39+ microglia was 36.09 ± 12.9 and for Ly6Chi was 25.06 ± 10.09. The number of these interactions was significantly lower than the number of affected miRNA–inflammatory mRNA interactions (for CD39, 80 vs. 36.09 and for Ly6Chi, 58 vs. 25.06). Thus, analysis of the random network showed a substantially lower number of interactions than what we observed using the inflammation-related genes and confirms that we did not bias our analysis by using the inflammatory gene set. These results demonstrate differences between resident CD39+ microglia and infiltrating Ly6Chi monocytes and identify a unique miRNA signature in spinal cord microglia and peripheral inflammatory Ly6Chi monocytes of SOD1 animals.
Figure 5. Top miRNA-mRNA interactions in splenic Ly6Chi monocytes in SOD1 mice.

Ingenuity target filter analysis showing the top 10 miRNA-mRNA interactions based on identified affected mRNAs (Figure 3, A and B) and miRNAs (Figure 4, A and B) at disease onset.
Figure 6. Changes in miRNA profiles of spinal cord–derived CD39+ microglia during the course of disease.

(A) miRNA profiling of spinal cord–derived CD39+ microglia in SOD1 mice compared with non-Tg mice from the same mice as described in Figure 4. (B) Summary of significantly affected miRNAs in spinal cord microglia in SOD1 mice compared with non-Tg mice validated in Singleplex qRT-PCR. Validated miRNAs were selected based on their differential expression at all disease stages. Data represent mean ± SD. All shown miRNAs were significantly affected (P < 0.05). miRNA expression level was normalized using ΔCt against U6 miRNA.
Figure 7. Top miRNA-mRNA interactions in spinal cord CD39+ microglia in SOD1 mice.

Ingenuity target filter analysis showing the top 10 miRNA-mRNA interactions based on identified affected mRNAs (Figure 2, A and B) and miRNAs (Figure 6, A and B) at disease onset.
Ly6Chi inflammatory monocytes infiltrate the spinal cord with disease progression in SOD1 mice.
We measured CD11b+Ly6C+ monocytes and CD11b+CD39+ microglia in the CNS of SOD1 mice during disease progression. As shown in Figure 8A, in wild-type mice, 98% of CD11b+ cells were CD39+ and 1%–2% were Ly6C+ in both spinal cord and brain. In SOD1 mice with end-stage disease (135 days), 31% of CD11b cells in the spinal cord were Ly6C+, and there was a decrease in the number of CD39+ cells (22%). No change in Ly6C+ cells or in CD39+ cells was observed in the brains of SOD1 mice (Figure 8B). Our observation of changes in the spinal cord and not the brain is consistent with our observation of changes in inflammatory gene expression in microglia from spinal cord but not brain (Figure 8C). Furthermore, these findings suggest a relationship between the recruitment of Ly6C+ cells and the areas of CNS damage in SOD1 mice. We then quantified the percentage of CD11b+Ly6C+ monocytes and CD11b+CD39+ microglia in the CNS over time. We found an increase in Ly6C+ monocytes that began at 60 days of age (1 month before disease onset) and which continued as the disease progressed (Figure 8, C and D). At 120 and 135 days, respectively, the proportion of Ly6C monocytes and myeloid cells significantly increased compared with that in wild-type mice at age 135 days (P < 0.01 and P < 0.001, respectively), whereas CD39+ microglia significantly decreased (P < 0. 01 and P < 0.001, respectively). No contribution of myeloid subsets was detected in brains of SOD1 mice (Figure 8C). No Ly6C+ monocytes were detected in the spinal cord at 30 days of age, even though they had increased expression of inflammatory genes at this time (Figure 3A). As shown in Figure 8E, Ly6C expression was upregulated with disease progression, and CD39+ microglia remained negative for Ly6C, which is consistent with our observation that CD39 and Ly6C represent non-overlapping CD11b populations (Figure 1, B–D).
Figure 8. Ly6Chi monocytes are recruited to the spinal cord with disease progression in SOD1 mice.

(A) FACS analysis of isolated spinal cord and (B) brain-derived mononuclear cells for CD11b, CD39, and Ly6C at 135 days in SOD1 mice. Numbers represent the percentage of CD11b-gated cells in each quadrant. (C) Proportional increase in inflammatory monocytes (black) and myeloid cells (gray) and decrease in CD39+ resident microglia (white) as related to total CD11b+ cells. Data represent mean ± SEM from 3 experiments (pool of 4–5 mice per group). (D) Expansion of Ly6C monocytes from Ly6Clo to Ly6Chi during disease progression in the spinal cord. Numbers represent the percentage of cells in each quadrant. (E) Ly6C expression is increased during disease progression on recruited monocytes but not on resident microglia. The numbers show percentage of Ly6Clo (left) and Ly6Chi (right) monocytes. Open profiles represent staining pattern with an IC antibody; solid red profiles indicate CD11b+CD39+ microglia; and green profiles show recruited CD11b+Ly6C+ monocytes. Each panel represents a pool of 5 mice. Results are representative of 3 independent experiments. (F) qRT-PCR analysis of Ccr2 and Ccl2 mRNA expression in FACS-sorted CD39+ microglia and Ly6Chi monocytes from spinal cords of SOD1WT and SOD1G93A mice. Total RNA was isolated and pooled from 5 mice for each cell population. Expression levels were normalized to Gapdh. Data represent mean ± SEM. *P < 0.05, **P < 0.01, ***P < 0.001, 1-way ANOVA followed by Dunnett’s multiple-comparison post hoc test. Results are representative of 2 independent experiments.
SOD1 spinal cord microglia induce recruitment of Ly6C+ monocytes.
It is known that CCL2 interacts with CCR2 receptors on the surface of Ly6Chi monocytes and is required for the recruitment of Ly6Chi monocytes to areas of inflammation (19–21). As shown above, gene profiling revealed an increase in the expression of Ccl2 on microglia (Figure 2A) and Ccr2 on Ly6Chi monocytes (Figure 3A). We validated this observation using qRT-PCR to measure the kinetics of Ccr2 expression in Ly6Chi splenic monocytes and Ccl2 expression in CD39+ microglia in the spinal cord over the course of disease. We found that Ccr2 was upregulated in splenic Ly6Chi monocytes both at disease onset and at end-stage disease. This was paralleled by an upregulation of Ccl2 in CD39+ microglia at disease onset. In addition, we observed no expression of Ccr2 in CD39+ microglia or of Ccl2 in Ly6Chi monocytes at any time during the disease course (Figure 8F). This suggests that expression of Ccl2 and other chemokines (Figure 2A) on microglia plays a role in the recruitment of Ly6Chi monocytes to the CNS.
To address whether CD39+ spinal cord microglia in SOD1 mice facilitate recruitment of peripheral Ly6C+ monocytes, we isolated microglia from the spinal cord of both wild-type and SOD1G93A mice at disease onset and transplanted them intracranially in WT and SOD1 recipient mice. Forty-eight hours after transplantation, we isolated brain mononuclear cells and analyzed them by FACS for Ly6C and CD11b expression (Figure 9A). We found a significant increase in recruited Ly6C+ monocytes when we transferred microglia from SOD1 mice versus WT or PBS (sham)–injected mice (Figure 9B). These experiments demonstrate that spinal cord–derived CD39+ microglia directly recruit the Ly6C+ monocytes. Furthermore, we observed a greater increase in Ly6C+ monocytes when microglia from SOD1 mice were transplanted into recipient SOD1 brain as opposed to WT brain (Figure 9B). This is consistent with our observation that splenic Ly6C+ monocytes in SOD1 mice are activated in the periphery and thus there is enhanced recruitment of these cells to the spinal cord in SOD1 mice. Of note, we did not observe recruitment of T, B, or NK cells following intracranial transplantation of microglia (data not shown).
Figure 9. SOD1 spinal cord microglia induce recruitment of Ly6C+ monocytes.

(A) FACS analysis of myeloid cells isolated from recipient WT and SOD1 brains at disease onset 48 hours after transplantation (intracranial) with spinal cord–derived CD39+ microglia (5 × 10⁴ cells) from donor WT and SOD1 mice at disease onset. Cells were gated using Annexin V and 7-AAD to eliminate apoptotic and necrotic cells. Numbers represent the percentage of cells in each quadrant. Panels are representative of 3–4 mice in each group. (B) Quantitative analysis showing absolute numbers of recruited Ly6C+ cells per hemisphere of injected mice. Data represent mean ± SEM (3–4 mice per group). **P < 0.01, ***P < 0.001, 2-way ANOVA with Bonferroni post hoc test.
Although we observed changes in Ly6Chi monocytes and CD39+ microglia, during the course of disease, it is theoretically possible that these markers are affected by inflammation that occurs in the spinal cord of SOD1 animals. To rule out this possibility, we generated chimeras in which donor peripheral monocytes expressing GFP under the Cx3cr1 promoter were transplanted into recipient irradiated SOD1 or non-Tg mice. In these chimeras, peripheral monocytes are distinguishable from microglia by FACS. Consistent with our observations above, we found progressive recruitment of Cx3cr1GFP/+ monocytes (Figure 10, A–C), which were Ly6C+ and CD39 negative (Figure 10, B and D). Of note Ly6Chi recruited monocytes express low levels of CX3CR1 during all disease stages (Figure 10E). This inflammatory monocyte subset (CD11b+CCR2+Ly6ChiCX3CR1lo) (56) has been shown to infiltrate into inflamed tissues and contribute to inflammation (18, 20, 24, 25).
Figure 10. Reciprocal expression of CD39 and Ly6C in CNS-resident microglia and bone marrow–derived monocytes in SOD1 chimeric mice.

SOD1G93A and non-Tg littermates were transplanted with syngeneic bone marrow cells from CX3CR1GFP/+ mice. Spinal cords were analyzed at presymptomatic (60 days), disease onset, and end stages. (A) GFP+ recruited IBA1+ monocytes in lumbar spinal cord of non-Tg– and SOD1-Cx3cr1GFP+/– mice. Scale bar: 500 μm. (B) Confocal images of GFP+ recruited monocytes (IBA1+GFP+; white arrowheads) and resident microglia (IBA1+GFP–; yellow arrowhead) in ventral horns of non-Tg– and SOD1-Cx3cr1 chimeric mice at 120 days of age. Representative confocal images (5–6 mice per group). Scale bars: 50 μm. (C) Quantitative analysis showing the kinetics of bone marrow–derived CX3CR1GFP/+ monocytes recruited into spinal cords during disease at 90, 120, and 145 days of age in SOD1-Cx3cr1GFP+/– chimeric mice. Data represent mean ± SEM (5–6 mice per group). ***P < 0.001, 1-way ANOVA followed by Dunnett’s multiple-comparison post hoc test. (D) FACS analysis of CD39 and Ly6C expression in spinal cord–derived populations of microglia (MG) and peripheral monocytes (PMs) isolated from non-Tg– and SOD1-chimera mice at 120 days of age. Note: CD11b+GFP+ gated peripheral monocytes express Ly6Chi and do not express CD39, whereas all resident microglia express CD39 and are negative for Ly6Chi. (E) Expansion of the recruited Ly6ChiCX3CR-GFPlo monocyte subset in the spinal cord of SOD1 mice during disease progression. Numbers in D and E represent the percentage of CD11b-gated cells in each quadrant. Each panel represents a pool of 4–5 mice.
Ly6Chi monocytes proliferate and CD39+ microglia undergo apoptosis and are lost in the spinal cord during disease progression in SOD1 mice.
To further investigate Ly6Chi monocytes and CD39+ microglia in the spinal cord during the course of disease, we assessed cellular proliferation as measured by BrdU and apoptosis as measured by Annexin V and 7-AAD staining for apoptotic and necrotic cells, respectively. As shown in Figure 11, A and B, CD39+ microglia in the spinal cord underwent apoptosis at all disease stages . Concomitant with this, we observed that Ly6Chi monocytes were recruited to the spinal cord and proliferated at all stages of disease (Figure 11, C and D). In addition, immunohistochemical analysis of spinal cord sections at different stages of disease demonstrated that microglia were also located in the ventral horn in close proximity to motor neurons, and with disease progression there was a loss of resident microglia (Supplemental Figure 4) in association with recruited monocytes that were in close proximity to dying motor neurons in the ventral horn (Supplemental Figure 5, A and B). These results demonstrate reciprocal changes in these two cell populations during the course of disease.
Figure 11. Ly6Chi monocytes proliferate and CD39+ microglia undergo apoptosis during disease progression in the spinal cord of SOD1 mice.

Spinal cord–isolated myeloid cells at onset (90 days), early symptomatic (120 days), and late symptomatic (135 days) stages from SOD1WT and SOD1 mice were analyzed. (A) Microglia viability was evaluated using Annexin V and 7-AAD for apoptotic and necrotic cells, respectively. No significant apoptosis was detected in Ly6C+ monocytes (data not shown). Numbers represent the percentage of cells in each quadrant. (B) Quantification of microglia viability reveals an approximately 2.5-fold increase in microglial apoptosis at 90, 120, and 135 days in comparison to wild-type microglia. Data represent mean ± SEM. *P < 0.05, **P < 0.01. (C) Proliferation of CD39+ resident microglia and Ly6C+ monocytes assessed by BrdU incorporation. BrdU was injected (i.p.) daily for 5 consecutive days before the spinal cords were analyzed. Wild-type mice received the same course of BrdU injection. Spinal cords were excised 5 days after the first BrdU injection. G1-gated CD11b+CD39+ microglia; G2-gated Ly6Chi; and G3-gated Ly6Clo monocytes. Flow cytometric analysis was based on live cell population after exclusion of Annexin V–and 7-AAD–positive cells. Numbers represent the percentage of cells in each quadrant. (D) Ly6Chi monocytes proliferate 3- to 4-fold more than Ly6Clo cells during the disease course. Data represent mean ± SEM (pool of 3–4 mice per group). ***P < 0.001, Student’s t test (2-tailed).
Anti-Ly6C mAb treatment delays disease onset and extends survival in SOD1 mice.
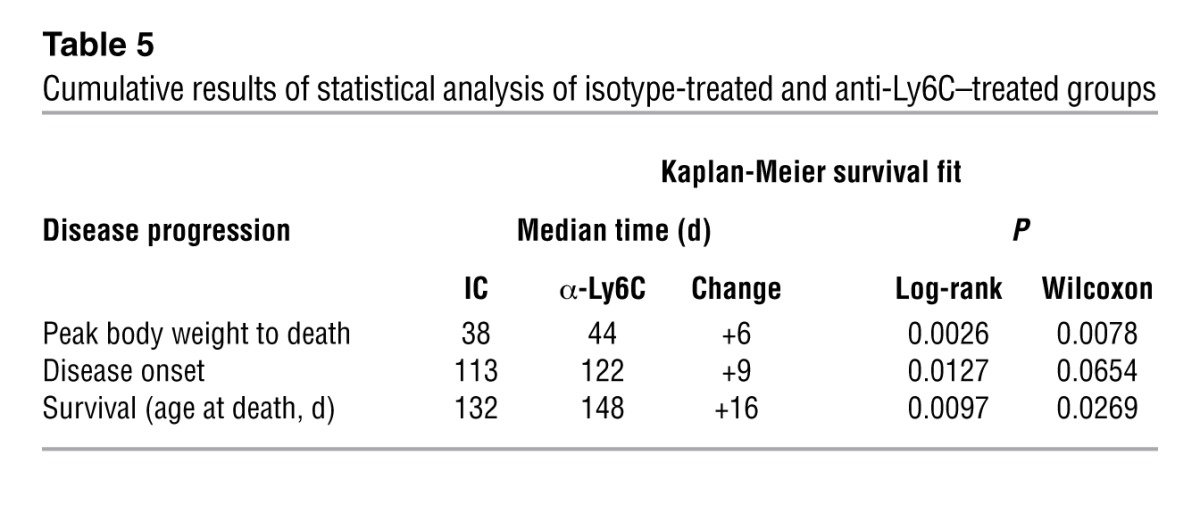
Based on our finding that Ly6Chi monocytes infiltrate the spinal cord and appear to participate in disease progression, we treated SOD1 mice with anti-Ly6C mAb to determine whether modulation of Ly6Chi monocytes affected disease progression. Animals were treated i.p. every other day beginning at disease onset (defined by body weight loss) until end-stage disease. We monitored body weight (every 3–4 days starting at day 80), clinical neurologic score (daily), and rotarod performance (3 times/week). Treatment with 100 μg anti-Ly6C antibody prolonged survival by 16 days (P = 0.0097) (Figure 12A), extended time to reach a neurologic score of 2 by 9 days (P = 0.0127) (Figure 12B), enhanced rotarod performance (Figure 12C), reduced weight loss (P = 0.001 at day 137) (Figure 12D), and delayed early (P < 0.001) and late (P < 0.05) disease onset (Figure 12E). These results are representative of 3 independent experiments in female animals. In the other 2 experiments (n = 7–9/group), treatment with 100 μg anti-LyC6 mAb extended survival by 18 days (P < 0.01) and 8 days (P < 0.05). No significant effects were observed in animals treated with 10-μg or 1-μg doses (data not shown). Cumulative results of statistical analysis of isotype-treated and anti-Ly6C–treated groups are shown in Table 5. In one experiment, males treated with anti-Ly6C had an increased survival of 6 days versus isotype control (n = 10/group).
Figure 12. Anti-Ly6C mAb treatment delays disease onset and extends survival in SOD1 mice.

SOD1G93A mice were treated i.p. with IgG2a (IC; 100 μg, n = 11) or 100 μg anti-6C3 mAb (n = 11) every other day starting at the onset of the disease. (A) Kaplan-Meier analysis of the probability of surviving of SOD1 as function of age. Mantel-Cox’s F-test comparison showed groups treated with 100 μg IC versus anti-Ly6C (P = 0.0097). (B) Time-to-event analysis for disease neurologic onset (neurological severity score of 2). Disease onset was significantly delayed (P = 0.0127) by anti-Ly6C (100 μg) treatment. (C) Rotarod performance of IC- and anti-Ly6C–treated groups as a function of age. Data represent mean ± SEM. *P < 0.05, **P < 0.01, ***P < 0.001, IC compared with anti-Ly6C groups by factorial ANOVA and Fisher’s least significant difference post hoc test. (D) Weight loss plotted for IC- and anti-Ly6C–treated groups. Data represent mean ± SD. *P < 0.05, **P < 0.01, ***P < 0.001, 2-way ANOVA, Bonferroni post hoc test. (E) Duration of an early disease phase (from onset to 5% weight loss) and a later disease phase (from 5% weight loss to end stage). Data represent mean ± SEM. *P < 0.05, ***P < 0.001, 1-way ANOVA.
Table 5.
Cumulative results of statistical analysis of isotype-treated and anti-Ly6C–treated groups
Anti-Ly6C treatment affects the phenotype of splenic Ly6Chi monocytes in SOD1 mice.
To examine the effects of anti-Ly6C treatment on Ly6C+ cells, we sorted CD11b+Ly6C+ monocytes from the spinal cord and spleen of treated animals after 1 month of treatment (age 120 days). We performed quantitative nCounter analysis of splenic Ly6Chi cells for the 179 inflammation-related genes we examined in untreated animals above (Figure 3, A and B). As shown in Figure 13A, genes related to inflammation, including Tnf, Il1b, and Il6 were downregulated, whereas Tgfb1 and Tgfbr1 were upregulated. We then validated these results by qRT-PCR (Figure 13B). Consistent with our nCounter results, anti-Ly6C mAb suppressed Il1b and Tnf and increased expression of Tgfb1 in Ly6Chi splenic monocytes. In the spinal cord, we observed downregulation of Tnf and upregulation of Tgfb1. No changes in Il1b or Il6 were observed in the spinal cord.
Figure 13. Anti-Ly6C treatment affects the phenotype of splenic Ly6Chi monocytes in SOD1 mice.

(A) SOD1 mice were treated with systemic (i.p.) injection every other day with IgG2a IC (100 μg; n = 5) or anti-Ly6C mAb (100 μg; n = 6) starting at disease onset (body weight loss). After 1 month of treatment (120 days of age), the mice were sacrificed and their splenic CD11b+Ly6Chi sorted cells were analyzed with quantitative nCounter profiling for 179 inflammation-related genes. Bars show affected genes with at least 2-fold-altered transcription levels. Gene expression levels were normalized against the geometric mean of 6 housekeeping genes (Cltc, Gapdh, Gusb, Hprt1, Pgk1, Tubb5). (B) Validation of Il1b, Il6, Tnf, and Tgfb1 by qRT-PCR (TaqMan) in spleen- and spinal cord–derived Ly6Chi monocytes. Expression levels were normalized to Gapdh. Results represent data from 2 independent experiments, each with 3–6 mice. Error bars represent mean ± SEM. **P < 0.01, ***P < 0.001, Student’s t test (2-tailed). (C) Expression of Il1b, Il6, Tnf, and Tgfb1 (qRT-PCR) in spleen- and spinal cord (SC)–derived Ly6Chi monocytes in untreated WT and SOD1 mice at 120 days of age. Expression levels were normalized to Gapdh. Data represent mean ± SEM from 6 mice. *P < 0.05, ***P < 0.001, 1-way ANOVA followed by Dunnett’s multiple-comparison post hoc test.
In addition, to determine the degree to which recruitment to the spinal cord affected the expression profile of Ly6Chi recruited monocytes, we measured Il1b, Il6, Tnf, and Tgfb1 expression in spleen-derived and spinal cord–recruited Ly6Chi monocytes in both WT and SOD1 untreated mice at 120 days of age (Figure 13C). In the spleen, we found increased expression of Il1b and Tnf and decreased expression of Tgfb1 in SOD1 versus WT mice. We found similar patterns in the spinal cord, viz., increased expression of Il1b and Tnf and decreased expression of Tgfb1 in SOD1 versus WT mice. In addition, we found increased expression of Il6 in the spinal cord in SOD1 versus WT mice. Thus, in untreated animals, we observed an increase in expression of Il1b and Il6 when cells were recruited to the spinal cord, but no difference in Tnf or Tgfb1 expression. This may explain why anti-Ly6C treatment did not affect Il1b and Il6 expression in the spinal cord, whereas it did affect Tnf and Tgfb1.
Anti-Ly6C mAb treatment decreases infiltration of Ly6Chi monocytes into the spinal cord and attenuates neuronal loss.
To further investigate the effect of anti-Ly6C mAb treatment, we performed FACS analysis of Ly6Chi monocytes in the spinal cord. At 30 days after treatment, we found a marked decrease in the percentage of Ly6C+ cells as shown both by FACS (Figure 14A) and quantitative analysis (Figure 14B), indicating depletion of these cells. It is not known whether there is a particular activation/signaling event; however, based on the effects shown in Figure 13, A and B, anti-Ly6C mAb treatment modulates the M1 Ly6Chi phenotype. Concomitant with the decrease in Ly6C+ cells, we found an increase in CD39+ microglial cells. Because we treated animals with anti-Ly6C antibody and also used anti-Ly6C antibody to measure Ly6C cells in the spinal cord, it is possible that the decrease we observed is related to the antibody and not to actual loss of cells. To address this issue, we used CD169 (Siglec1), which is a well-characterized marker of inflammatory monocytes and differentiated dendritic cells (57). Using SOD1-chimeric mice, we found that CD169 was expressed by all recruited GFP+ bone marrow–derived monocytes, but not by microglia (Supplemental Figure 5B). Consistent with our results above, we found a decrease in CD169+ monocytes in the spinal cord following anti-Ly6C treatment both by FACS (Figure 14C) and by immunohistochemical analysis (Figure 14D). We then asked whether anti-Ly6C treatment affected neurons in the spinal cord. As shown in Figure 14, D and E, we found an increase in the numbers of neurons both in the dorsal and ventral horns of anti-Ly6C–treated animals. Concomitant with this, there was a decrease in the number of inflammatory monocytes (CD169+ cells). Because CD169, like Ly6C is expressed on the surface of inflammatory monocytes, we treated SOD1 mice with anti-CD169 mAb, but unlike with anti-Ly6C, we found no effect on disease (data not shown).
Figure 14. Anti-Ly6C mAb treatment decreases infiltration of Ly6Chi monocytes into the spinal cord and attenuates neuronal loss.

SOD1 mice were treated as described in Figure 12. (A) FACS analysis of Ly6C+ monocytes in the spinal cord of anti-Ly6C–treated SOD1 mice compared with the IC group 30 days after treatment. Cells were gated using Annexin V and 7-AAD to eliminate apoptotic and necrotic cells. Numbers represent the percentage of CD11b-gated cells in each respective quadrant as indicated. Pooled data from 5 mice are shown. (B) Significantly reduced proportion of Ly6C+ monocytes and increased numbers of CD39+ microglia among CD11b+ cells 50 days after α-Ly6C treatment. (C) Significant reduction in CD11b+CD169+ monocytes was detected after 50 days of α-Ly6C treatment. Numbers represent the percentage of cells in each gate. (D) Representative confocal images stained for NeuN (green; neurons), IBA1 (blue; myeloid cells), and CD169 (red; recruited monocytes) of whole mount lumbar axial sections of spinal cords from IC- and Ly6C-treated mice at the end stage (140 days old). Scale bar: 500 μm. Boxed areas showed insets at high magnification. Scale bars: 200 μm. (E) Quantitation of neurons (NeuN+) and recruited monocytes (IBA1+/CD169+) in ventral and dorsal horns in the spinal cord of SOD1 mice treated with isotype control or anti-Ly6C mAbs (n = 6–8 per group). Results are representative of 2 independent experiments. Error bars represent mean ± SEM. *P < 0.05, **P < 0.01, ***P < 0.001, Student’s t test (2-tailed).
Our results thus far demonstrate that peripheral Ly6Chi cells play an important role in disease progression. It is known that the spleen is a major reservoir of Ly6C+ cells (58), and it has been reported that the spleen atrophies during the course of disease in the SOD1 mouse (4). Thus, we examined spleen size to determine whether splenic atrophy had occurred and whether this was affected by treatment with anti-Ly6C mAb. We found that the splenic atrophy that occurred in SOD1 mice was reversed by anti-Ly6C mAb treatment (Supplemental Figure 6). It has been shown that splenectomy is of benefit in an animal model of stroke (59) and cardiac ischemia (58). Thus, we asked whether splenectomy would have a beneficial effect on the disease course in the SOD1 mouse. We performed splenectomy during the presymptomatic stage (60 days of age). However, rather than ameliorating disease, splenectomy worsened disease (Supplemental Figure 7).
miRNA and gene profiling of peripheral monocytes (CD14+CD16–) in ALS patients demonstrate an inflammatory phenotype analogous to that observed in SOD1 mice.
To investigate whether the inflammatory phenotype we observed in splenic Ly6Chi monocytes in SOD1 mice was also present in patients with ALS, we sorted CD14+CD16– cells (Supplemental Figure 8A), which are the analog of Ly6Chi cells in mice (56) and which we found to be decreased compared with those from healthy controls (Supplemental Figure 8B). We then profiled blood-derived CD14+CD16– and CD14+CD16+ monocyte subsets for 664 miRNAs using quantitative nCounter analysis. We also profiled untreated relapsing-remitting MS patients to determine whether any inflammatory signatures we observed in ALS subjects were unique to ALS or were also present in a classic inflammatory CNS disease such as MS. In ALS, we found 56 miRNAs that were significantly affected in CD14+CD16– monocytes (Figure 15, A and B). We identified 19 miRNAs similarly affected in SOD1 mice and human ALS (Supplemental Table 3). Principal component analysis (PCA) showed that both ALS and MS were distinct from healthy controls and that we could distinguish ALS from MS, although there was some overlap (Figure 16A). To validate these findings, we performed quantitative Singleplex qRT-PCR on 6 miRNAs (Figure 16B), including 5 (miR-27a, miR-155, miR-142-5p, miR-223, and miR-532-3p) that we found upregulated in Ly6Chi monocytes in the SOD1 mouse (Figure 4A). In our validation, these miRNAs showed the least overlap between MS and healthy control subjects. Of note, miR-27a was highly expressed in ALS subjects, with no expression in healthy control or MS subjects. To further validate these findings, we investigated a separate independent cohort of ALS patients and healthy controls and found identical results (data not shown). When we analyzed CD14+CD16+ monocytes, we found relatively small numbers (17 miRNAs) of significantly affected miRNAs (Supplemental Figure 9). However, 12 miRNAs were similarly affected in CD14+CD16– monocytes. These results are consistent with our findings in the SOD1 mice of prominent changes in Ly6Chi monocytes, the mouse analog of CD14+CD16– monocytes (56). We also tested cerebrospinal fluid (CSF) from ALS subjects for 43 selected miRNAs that we found upregulated in SOD1 spinal cord CD39+ microglia and splenic Ly6Chi monocytes, and found 3 miRNAs (miR-27b, miR-146a, and miR-532-3p) in common elevated in ALS CSF that were elevated both in monocytes and microglia from SOD1 mice and from human ALS subjects (Supplemental Figure 10). To further evaluate monocytes in subjects with ALS, we performed gene expression, in which we examined 184 inflammatory-related genes as we had in SOD1 mice (Figure 3, A and B). We found upregulation of inflammatory genes in ALS that were not observed in healthy controls. Nonetheless, although there were some differences, unlike in our experiments above with miRNAs, the inflammatory gene expression pattern in ALS was similar to that observed in MS (Supplemental Figure 11).
Figure 15. miRNA profiling of peripheral monocytes (CD14+CD16–) in ALS patients demonstrates an inflammatory phenotype analogous to that observed in SOD1 mice.

(A) Quantitative nCounter expression profiling of blood-sorted CD14+CD16– monocytes for 664 miRNAs in sporadic ALS (n = 8) and relapsing-remitting MS patients (n = 8) versus healthy controls (HC; n = 8). Heatmap of uncentered Pearson correlation was used as the distance metric with average linkage for the unsupervised hierarchical clustering. P < 0.01, nonparametric Kruskal-Wallis test, significance based on Benjamini-Hochberg FDR; selected FDR limit, 0.05. (B) Bars show fold differences of significantly affected miRNAs in ALS and MS subjects versus healthy controls. miRNA expression level was normalized against the geometric mean of 5 internal housekeeping genes (ACTB, B2M, GAPDH, RPL19, RPLP0). Data represent mean ± SD. All shown miRNAs were significantly affected (P < 0.05). The complete list of P values for each significantly affected miRNA is shown in Supplemental Table 4.
Figure 16. Identification of a unique microRNA signature in CD14+CD16– blood monocytes from ALS subjects.

(A) PCA of the identified affected miRNAs between ALS and MS subjects versus healthy controls with spatial miRNA distribution. (B) qRT-PCR validation of 6 selected miRNAs in an independent healthy control and sALS cohort. Relative expression in HCs, MS, sALS, and fALS was calculated using the comparative Ct (2–ΔΔCt) method. miRNA expression level was normalized against U6 miRNA. PCRs were run in duplicate per subject. Each data point represents an individual subject. Horizontal bars denote mean of miRNA expression for each group. **P < 0.01, ***P < 0.001, 1-way ANOVA followed by Dunnett’s multiple-comparison post hoc test.
To further investigate immune-related gene expression in ALS, we examined 511 immune-related genes in monocytes from ALS subjects. With this panel, we were able to distinguish ALS subjects from healthy controls and sporadic ALS (sALS) from familial ALS (fALS) with SOD1 mutation in the small number of samples tested (Figure 17, A and B, and Figure 18A). We validated these findings using Singleplex qPCR in an independent cohort of ALS patients and healthy controls in which we chose the genes that were the most significantly upregulated (AHR, CCL2, PTAFR, NFKB1, TRAF3, and FCER1A) or downregulated (CXCR4, SOCS1) in ALS (Figure 18B). Of note, we found differences between fALS and sALS in 3 of 8 genes (NFKB1, TRAF3, and FCER1A). Although only 4 fALS subjects were studied, it is possible that these genes may be related to the SOD1 mutation. Furthermore, Ingenuity miRNA-mRNA target filter analysis revealed that the top 10 miRNA-mRNA interactions in ALS were linked to the genes we found to be the most significantly affected in ALS subjects (Figure 19). When we analyzed the human peripheral monocyte gene data for degree of overlap with the mouse, we did not find different or more extensive overlap of fALS than sALS with data from the mouse mutant model (see Supplemental Table 3 for a list of similar miRNAs and mRNAs between splenic Ly6Chi monocytes and CD14+CD16– blood monocytes in ALS).
Figure 17. Immune gene profiling of peripheral monocytes (CD14+CD16–) in ALS patients.

Quantitative nCounter expression profiling of CD14+CD16– monocytes for 511 immune- and 184 inflammation-related genes in sALS (n = 10) and fALS-SOD1 patients (n = 4) versus healthy controls (n = 10). (A) Heatmap of unsupervised hierarchical clustering (Pearson correlation) shows significantly affected genes (P < 0.01, nonparametric Kruskal-Wallis test, significance based on FDR Benjamini-Hochberg; selected FDR limit, 0.05). (B) Bars show fold differences of significantly affected genes in sALS and fALS subjects versus healthy controls. Gene expression level was normalized against the geometric mean of 15 internal-reference housekeeping genes (ABCF1, ALAS1, EEF1G, G6PD, GAPDH, GUSB, HPRT1, OAZ1, POLR1B, POLR2A, PPIA, RPL19, SDHA, TBP, TUBB). Data represent mean ± SD. All shown miRNAs were significantly affected (P < 0.05). The complete list of P values for each significantly affected miRNA is shown in Supplemental Table 5.
Figure 18. Identification of a unique gene signature in CD14+CD16– blood monocytes from ALS subjects.

(A) PCA analysis of the identified affected genes between sALS and fALS subjects versus healthy controls with spatial gene distribution. (B) qRT-PCR validation of 8 selected genes in an independent cohort that were the most significantly upregulated or downregulated. Relative expression in sALS and fALS against healthy controls were calculated using the 2–ΔΔCt method. Gene expression level was normalized against the geometric mean of 3 housekeeping genes (GAPDH, TUBB, and GRB2). PCRs were run in duplicate per subject. Each data point represents an individual subject. Horizontal bars denote mean of gene expression for each group. **P < 0.01, ***P < 0.001, 1-way ANOVA followed by Dunnett’s multiple-comparison post hoc test.
Figure 19. Top miRNA-mRNA interactions in CD14+CD16– blood monocytes from ALS subjects.

Ingenuity target filter analysis showing miRNA-mRNA interactions based on identified significantly affected miRNAs (Figure 15) and mRNAs (Figure 17) in ALS subjects.
We then analyzed both the miRNA and gene expression profile in monocytes from ALS subjects. We found that the abnormalities related to miRNA and gene expression in monocytes from ALS subjects were linked to inflammatory and immune-related genes (Supplemental Table 6 and Supplemental Figure 12). When these miRNA-mRNA interactions in CD14+CD16– blood monocytes in ALS were analyzed, the interactions were shown to be statistically significant using TargetScan 4.1 prediction analysis both in SOD1 mice and in ALS subjects (Supplemental Figure 13, A and B). Furthermore, GeneGo pathway analysis identified 9 inflammation-related networks (Supplemental Figure 14) that were identical to those that we observed in splenic Ly6Chi monocytes in SOD1 mice (Table 3).
Discussion
We have identified an important role for Ly6Chi monocytes in a mouse model of ALS. One month prior to disease onset, Ly6Chi monocytes in the spleen had a pronounced proinflammatory profile, as detected by both miRNA and gene expression profiling. The inflammatory gene profile in the spleen was also observed at 2 months prior to disease onset (age 30 days). Ly6Chi monocytes were recruited to the spinal cord, but not brain, and proliferated in the spinal cord during disease progression. This occurred in association with increased Ccr2 expression in Ly6Chi peripheral monocytes and increased Ccl2 expression on CD39+ resident microglia. Even before disease onset and neuronal loss, CD39+ resident microglia expressed Ccl2 and other chemotaxis-associated molecules in the spinal cord, but not brain. Furthermore, we observed increased apoptosis of CD39+ microglia in association with Ly6Chi infiltration and neuronal loss.
Given these findings, we treated SOD1 mice with anti-Ly6C mAb at the time of disease onset. We found that targeting of peripheral Ly6Chi monocytes with anti-Ly6C mAb slowed disease progression and attenuated neuronal damage by decreasing infiltration of Ly6Chi cells to the spinal cord. In addition, anti-Ly6C mAb treatment reduced microglial loss. Anti-Ly6C treatment modulated the cytokine profile of Ly6Chi monocytes in both the spinal cord and spleen by decreasing Tnf and increasing Tgfb1. Thus, it appears that we were both decreasing the infiltration of disease-promoting monocytes and inducing an alternatively (M2) monocyte population.
We then investigated subjects with ALS to determine whether the SOD1-like inflammatory monocyte profile occurred in people with the disease. In humans, CD14+CD16– monocytes express CCR2 and low levels of CX3CR1 and are functionally equivalent to Ly6Chi monocytes (56). We tested CD14+CD16– monocytes from the peripheral blood of ALS subjects for expression of the miRNAs we found upregulated in Ly6Chi cells in SOD1 mice and found analogous patterns. In addition, using gene expression profiling, we found an analogous inflammatory profile in ALS subjects, consistent with classically activated (M1 type) monocytes, the same pattern we observed in the SOD1 mouse.
The chemokine receptor CCR2 and its ligand CCL2 participate in regulating monocyte Ly6ChiCCR2+ subset infiltration (19, 20). The CCL2 protein is expressed in astrocytes in ALS and is increased in the CSF of ALS patients (7). These results support the involvement of immune/inflammatory responses in motor neuron degeneration in ALS. CCL2 is produced at 3-fold-higher levels by SOD1-mutant microglia compared with wild-type human SOD1 microglia activated with LPS in vitro (60). Henkel et al. reported increased CD14+ monocytes in the spinal cord in close proximity to motor neurons, and this was associated with disease progression in ALS patients (7). Consistent with this, the authors reported increased expression of CCL2 in ALS glial cells. Furthermore, Mantovani et al. reported a decrease in CD14+ cells in the blood of ALS patients and postulated that this was related to their early recruitment to CNS areas of primary neurodegeneration (61). We also observed a modest but significant decrease in CD14+CD16– peripheral blood monocytes in the ALS subjects we studied. These findings in humans are consistent with our findings that Ly6Chi monocytes are recruited to the CNS in the SOD1 mice in association with increased Ccl2 expression in resident microglia. Of note, this occurs both prior to disease onset and during disease.
An important question is why Ly6Chi cells are recruited to the spinal cord but not to the brain in SOD1 mice. These findings are consistent with the observation that neurons in the spinal cord, but not the brain, are damaged in the SOD1 mouse. They are also consistent with the fact that we only found changes in microglia in the spinal cord of SOD1 mice. It appears that expression of CCL2 and other chemokines in microglia plays a role in the recruitment of Ly6Chi monocytes to the CNS. We found increased recruitment of Ly6C+ monocytes to the CNS when we transferred microglia from SOD1 mice to the CNS of both WT and SOD1 mice. There was greater recruitment of Ly6C+ monocytes to the CNS when SOD1 microglia were transplanted into SOD1 as opposed to WT CNS. This is consistent with our observation that SOD1 splenic Ly6C+ monocytes are activated and this results in enhanced recruitment of these cells to the spinal cord in SOD1 mice. This process plays an important role in damage to spinal cord neurons, since modulation of Ly6Chi monocytes prolongs survival and decreases motor neuron loss. Thus, based on our results in the SOD1 mouse, we postulate that treatment to modulate inflammatory monocytes in ALS may slow disease progression.
Of note, we found that the activation of splenic inflammatory Ly6Chi monocytes occurs at 30 days of age in SOD1 mice, which is 2 months prior to disease onset. Furthermore, we observed no changes in CNS microglia at this age. This raises the possibility that the SOD1 mutation triggers autonomous activation of peripheral monocytes independent of its effects in the nervous system. Of note, in Huntington’s disease peripheral innate immune activation is detectable before clinical onset (62). Our identification of an analogous SOD1-like miRNA profile in monocytes of subjects with ALS provides a direct link between the animal model and the human disease. Furthermore, it is now possible to test whether the SOD1-like profile of monocytes in the blood of ALS patients is linked to disease stage or progression and whether it has prognostic significance.
One of the important insights from our studies was that CD39+ was able to distinguish resident microglial cells from infiltrating monocytes. This led to the discovery that there was resident microglial loss, not “microgliosis,” in the spinal cord of these animals. Our findings support previous work by Fendrick et al., who demonstrated the occurrence of severe abnormalities in microglia and hypothesized that degeneration of microglia is part of the pathogenesis in ALS (63). It has been proposed that microglia in the adult brain arise from Ly6ChiCCR2+ monocytes under defined host conditions (20). However, in line with our data, recent studies suggest that this is not the case and that resident microglia represent a unique, indigenous cell population in the brain (25, 64, 65).
Numerous studies demonstrate that miRNAs play an essential role in the regulation of immune function (40). Based on miRNA profiling, we found that the peripheral monocytes in the SOD1 mouse and in humans with ALS exhibit a unique inflammatory phenotype. In the SOD1 mouse, we observed upregulation of let-7, miR-15b, miR-16, miR-27a, miR-34a, miR-132, miR-146a, miR-155, miR-223, and miR-451, all of which have been associated with inflammatory responses (41–44, 48). Specifically, the expression of miR-15b, miR-16, miR-132, miR-146a, miR-155, and miR-223 is induced in response to LPS stimulation and by proinflammatory stimuli such as IL-1β and TNF-α and mediated by the TLR ligands via the NF-κB pathway and signaling through the JNK pathway (50, 66, 67). Interestingly, a recent study demonstrated that extracellular let-7b induces neurodegeneration through TLR7 (42). We found let-7b to be upregulated in inflammatory monocytes in both SOD1 mice and ALS subjects, which may contribute to the neuronal loss observed in ALS.
Innate immune effector cells are armed with an extensive repertoire of pattern recognition receptors including CD14 and TLRs that are necessary for detection and rapid elimination of invading microorganisms. Upon ligand binding, the CD14/TLR signaling cascade via a common adaptor, MyD88, induces activation of transcription factor 2 (ATF2) and NF-κB transcription factors, both of which subsequently regulate the expression of numerous immune response genes including inflammatory cytokines and also have been recognized as responding to endogenous ligands (68). Several reports indicate the involvement of TLR2 and TLR4 in oxidative stress–related cell activation, a hypothesized mechanism of ALS pathogenesis (69). Moreover, in ALS, mSOD1 protein aggregates (70) and is secreted into the extracellular space (71). Thus, having observed a marked upregulation of Myd88 and Nfkb1 in Ly6Chi splenic monocytes, we hypothesize that in ALS, recruited monocytes could be activated autonomously in the periphery prior to disease onset by aggregated extracellular mSOD1 protein via innate immune receptors, which in turn modulate proinflammatory activation of Ly6Chi monocytes associated with neuronal death. Interestingly, miR-132, miR-146a, and miR-155 were shown to be upregulated by LPS via the adaptor MyD88 and NF-κB (50, 66) and are all upregulated in Ly6Chi monocytes in SOD1 mice. Consistent with this, in our gene expression profiling, we found activation of SP-1, NF-κB, and CREB1, which are pathways related to inflammatory responses. Furthermore, we found that Ahr, which is implicated in the SP1 and NF-κB networks, is upregulated in splenic Ly6Chi monocytes in SOD1 mice and CD14+CD16– blood monocytes in ALS subjects. AhR is reported to trigger the downstream CREB1 (34) and NF-κB (35) signaling, leading to transactivation of the c-Myc oncogene, which we also found to be upregulated in SOD1 mice and ALS. AhR expression is induced during monocytic differentiation (72), and AhR-dependent upregulation of MMP-12, CCL2, and IL-8 in vascular macrophages correlates with recruitment and activation of inflammatory cells in a mouse model of atherosclerosis (73). We found high expression of Jun and Fos in Ly6Chi monocytes in SOD1 mice, indicating that the JNK pathway is activated, and recent studies showed that the NF-κB pathway is activated in ALS (74). Thus, AhR activation in monocytes may be related to misfolded SOD1 and serve a “sensor of toxin exposure” that is linked to inflammation in ALS.
The miRNA profile we found in SOD1 mice was also observed in ALS and consisted of miR-27a, miR-155, miR-146a, and miR-532-3p, with miR-27a being highly expressed in ALS subjects and not expressed in healthy control or MS subjects. Concomitant with the upregulation of these miRNAs, we observed downregulation of TGF-β1 in monocytes from both SOD1 mice and ALS patients. It has been shown that overexpression of miR-155 reduced TGF-β1 production by repressing SMAD2 (52) and SMAD5 (75). In ALS patients, miR-21 and miR-106b were upregulated, and these miRNAs have been shown to target TGF-β1 (76). Indeed, in mice, treatment with anti-Ly6C antibody upregulated Tgfb1 and decreased Tnf in Ly6C+ monocytes in both the spleen and CNS.
Recently, the spleen has been identified as a main reservoir for Ly6C monocytes. This has been shown most dramatically in a myocardial ischemia model in which Ly6Chi monocytes accumulate in the myocardium, which is associated with en masse exit of monocytes from the spleen (58). Consistent with these findings, Offner et al. report that splenic atrophy occurs in a model of experimental stroke (77). This phenomenon has also been reported in ALS models. Banerjee et al. showed that spleens of SOD1 mice were reduced in size and weight at the end stage of disease (4), and in our experiments we found a decrease in spleen size in untreated SOD1 mice. Furthermore, we found that in association with disease amelioration in the CNS following treatment with anti-Ly6C mAb, the spleen returned to normal size. We hypothesize that splenic atrophy was linked to the deployment of inflammatory monocytes during disease progression. Nonetheless, we found that splenectomy worsened, rather than ameliorated disease, suggesting that the spleen may harbor disease-protective monocytes or other protective elements.
Although immune abnormalities have been reported before in ALS, it is not generally considered an inflammatory disease. MS is a classic neuroinflammatory disease with well-documented changes in the peripheral immune compartment and proven response to immune-modulatory treatment. Although we found broad similarities between the miRNA and inflammatory gene patterns in monocytes from MS and ALS patients, we identified unique miRNA and gene profiles in the blood of ALS patients. General immunosuppressive treatments including cyclophosphamide (15, 16) and total lymphoid irradiation (78) have been tested in ALS without positive results. Furthermore, as described above, affecting the entire monocyte pool by splenectomy worsened disease in the mouse model. Thus, specific modulation of inflammatory monocytes may be required. The identification of common inflammatory pathways between ALS and MS further supports a role for inflammation in ALS and raises the possibility that immunomodulatory therapies that target monocytes may be beneficial in both MS and ALS.
Most subjects with ALS have the sporadic form (sALS), though some have a familial form (fALS) linked to specific gene mutations. The clinical characteristics of the sporadic and familial forms are similar. We studied monocytes from 4 fALS subjects with SOD1 mutations and found, by miRNA and gene profiling, that they had profiles similar to those we had observed in SOD1 mice. Although only 4 fALS (mSOD1) subjects were studied, the similar immune abnormalities we identified may indicate that these immune abnormalities represent common pathways that are affected in different forms of ALS. It is now known that there are other forms of familial ALS-related mutations such as TDP-43, FUS, and the newly discovered mutation in a noncoding region of C9ORF72 (79, 80), which is the most common known genetic cause of fALS (46%) and also accounts for approximately 21% of sALS cases in Finland. Based on our findings, it will now be possible to determine the degree to which the changes in inflammatory monocytes we identified are linked to the various genetic forms of the disease.
In conclusion, we demonstrate that recruitment of inflammatory monocytes into the CNS plays an important role in ALS disease progression. Furthermore, we found that the inflammatory miRNA signature in peripheral monocytes from ALS subjects to be analogous to that observed in the spleen of SOD1 mice, providing a direct link between the mouse model and the human disease. Thus, the SOD1-like profile of monocytes in the blood of ALS patients we identified may serve as a biomarker linked to disease stage or progression and modulation of these cells is a potential therapeutic approach.
Methods
See Supplemental Methods for detailed methodology.
Animals.
Lewis rats were used to generate hybridoma cells for antibody production and were purchased from Charles River Laboratories. B6/SJL-SOD1G93A Tg, SOD1 wild-type, CX3CR1-GFP (B6.129P-Cx3cr1tm1Litt/J), and non-Tg mice were provided by Prize4Life or purchased from the Jackson Laboratory.
Behavioral analysis.
See Supplemental Methods.
Generation of chimeric mice.
See Supplemental Methods.
Generation of mAbs specific for resident microglia and peripheral inflammatory monocytes.
See Supplemental Methods.
Cell transfection.
See Supplemental Methods.
Flow cytometry.
See Supplemental Methods.
Patients.
See Supplemental Methods.
Blood samples.
See Supplemental Methods.
CSF samples.
See Supplemental Methods.
Isolation of human blood monocytes.
Fresh peripheral blood mononuclear cells were obtained by Ficoll density gradient centrifugation. CD14+CD16– and CD14+CD16+ monocyte subsets stained with mouse anti–human CD14-PE and CD16-PeCy7 (BD Biosciences — Pharmingen) were sorted with a FACSAria (BD Biosciences). The sorted cells were further prepared for the RNA isolation protocol indicated below.
Analysis of miRNA and mRNA expression.
To assess miRNA and mRNA expression in human CD14+CD16– and CD14+CD16+ monocyte subsets and brain and spinal cord CD11b+CD39+ microglia and CD11b+Ly6C+ spinal cord and splenic monocytes from WT and SOD1 mice, total RNA was isolated and analyzed by qRT-PCR using specific primers for selected mRNAs and miRNAs all purchased from Applied Biosystems. For analysis of miRNA expression, qRT-PCR analyses were carried out using TaqMan miRNA assays (Applied Biosystems), and relative expression was calculated using the ΔCt method as described elsewhere (81) and normalized to uniformly expressed U6 (Applied Biosystems) for miRNAs and to housekeeping genes for relative gene expression indicated in each corresponding figure legend. All qRT-PCRs were performed in duplicate or triplicate, and the data are presented as mean ± SD.
Administration of BrdU and tissue preparation.
See Supplemental Methods.
Immunohistochemistry.
See Supplemental Methods.
RNA isolation and miRNA profiling in CSF.
See Supplemental Methods.
TaqMan miRNA low-density array (TLDA) miRNA analysis and TLDA data analysis.
See Supplemental Methods.
Statistical analysis of TLDA data.
See Supplemental Methods.
Quantitative NanoString nCounter miRNA/gene expression analysis.
See Supplemental Methods.
GeneGo biological pathway analysis.
See Supplemental Methods.
IPA miRNA-mRNA target filter analysis.
See Supplemental Methods.
GEO dataset.
The gene expression data set has been deposited in the GEO database (GSE39644).
Statistics.
Prism software (GraphPad Software) was used for 1-way ANOVA with Dunnett’s or Bonferroni post hoc test. Differences between 2 groups were examined using Student’s t test (2-tailed). Unsupervised hierarchical clustering of significantly affected miRNA and gene expression profiles was analyzed by nonparametric Kruskal-Wallis test, with significance based on Benjamini-Hochberg false discovery rate (FDR). The results were visualized by heatmap and PCA using MeV (Multi Experiment Viewer software version 4.7.4). miRNA and mRNA expression between WT and SOD1 mice was compared by ANOVA with Dunnett’s post-hoc test. A P value less than 0.05 was considered statistically significant.
Study approval.
Animal protocols were approved by the IACUC at Harvard Medical School and were performed according to NIH guidelines. Concerning the use of human materials, the study was approved by the MGH and BWH institutional review boards, and all subjects provided written informed consent prior to being enrolled in the study. ALS patients were at least 18 years old and met El Escorial criteria for possible, probable, or definite ALS.
Supplementary Material
Acknowledgments
This work was supported in part by the Amyotrophic Lateral Sclerosis Association; NIH grant AG027437; Tufts Center for Neuroscience Research P30 NS047243. The Harvard NeuroDiscovery Center provided CSF specimens (Biomarker Study). We thank Prize4Life for providing SOD1 mice; V. Kuchroo and D. Selkoe for critical discussions; N. Kassam for technical support.
Footnotes
Conflict of interest: The authors have declared that no conflict of interest exists.
Citation for this article: J Clin Invest. 2012;122(9):3063–3087. doi:10.1172/JCI62636.
References
- 1.Pasinelli P, Brown RH. Molecular biology of amyotrophic lateral sclerosis: insights from genetics. Nat Rev Neurosci. 2006;7(9):710–723. doi: 10.1038/nrn1971. [DOI] [PubMed] [Google Scholar]
- 2.McGeer PL, McGeer EG. Inflammatory processes in amyotrophic lateral sclerosis. Muscle Nerve. 2002;26(4):459–470. doi: 10.1002/mus.10191. [DOI] [PubMed] [Google Scholar]
- 3.Beers DR, Henkel JS, Zhao W, Wang J, Appel SH. CD4+ T cells support glial neuroprotection, slow disease progression, and modify glial morphology in an animal model of inherited ALS. Proc Natl Acad Sci U S A. 2008;105(40):15558–15563. doi: 10.1073/pnas.0807419105. [DOI] [PMC free article] [PubMed] [Google Scholar]
- 4.Banerjee R, et al. Adaptive immune neuroprotection in G93A-SOD1 amyotrophic lateral sclerosis mice. PLoS One. 2008;3(7):e2740. doi: 10.1371/journal.pone.0002740. [DOI] [PMC free article] [PubMed] [Google Scholar]
- 5.Chiu IM, et al. Activation of innate and humoral immunity in the peripheral nervous system of ALS transgenic mice. Proc Natl Acad Sci U S A. 2009;106(49):20960–20965. doi: 10.1073/pnas.0911405106. [DOI] [PMC free article] [PubMed] [Google Scholar]
- 6.Beers DR, et al. Wild-type microglia extend survival in PU.1 knockout mice with familial amyotrophic lateral sclerosis. Proc Natl Acad Sci U S A. 2006;103(43):16021–16026. doi: 10.1073/pnas.0607423103. [DOI] [PMC free article] [PubMed] [Google Scholar]
- 7.Henkel JS, et al. Presence of dendritic cells, MCP-1, and activated microglia/macrophages in amyotrophic lateral sclerosis spinal cord tissue. Ann Neurol. 2004;55(2):221–235. doi: 10.1002/ana.10805. [DOI] [PubMed] [Google Scholar]
- 8.Lincecum JM, et al. From transcriptome analysis to therapeutic anti-CD40L treatment in the SOD1 model of amyotrophic lateral sclerosis. Nat Genet. 2010;42(5):392–399. doi: 10.1038/ng.557. [DOI] [PubMed] [Google Scholar]
- 9.Boillee S, et al. Onset and progression in inherited ALS determined by motor neurons and microglia. Science. 2006;312(5778):1389–1392. doi: 10.1126/science.1123511. [DOI] [PubMed] [Google Scholar]
- 10.Nagai M, et al. Astrocytes expressing ALS-linked mutated SOD1 release factors selectively toxic to motor neurons. Nat Neurosci. 2007;10(5):615–622. doi: 10.1038/nn1876. [DOI] [PMC free article] [PubMed] [Google Scholar]
- 11.Chiu IM, et al. T lymphocytes potentiate endogenous neuroprotective inflammation in a mouse model of ALS. Proc Natl Acad Sci U S A. 2008;105(46):17913–17918. doi: 10.1073/pnas.0804610105. [DOI] [PMC free article] [PubMed] [Google Scholar]
- 12.Gordon PH, et al. Efficacy of minocycline in patients with amyotrophic lateral sclerosis: a phase III randomised trial. Lancet Neurol. 2007;6(12):1045–1053. doi: 10.1016/S1474-4422(07)70270-3. [DOI] [PubMed] [Google Scholar]
- 13. Stommel EW, et al. Efficacy of thalidomide for the treatment of amyotrophic lateral sclerosis: a phase II open label clinical trial. Amyotroph Lateral Scler. 2009. 10 (5-6): 393 404 10.3109/17482960802709416 [DOI] [PMC free article] [PubMed] [Google Scholar]
- 14.Cudkowicz ME, et al. Trial of celecoxib in amyotrophic lateral sclerosis. Ann Neurol. 2006;60(1):22–31. doi: 10.1002/ana.20903. [DOI] [PubMed] [Google Scholar]
- 15.Brown RH, Jr, Hauser SL, Harrington H, Weiner HL. Failure of immunosuppression with a ten- to 14-day course of high-dose intravenous cyclophosphamide to alter the progression of amyotrophic lateral sclerosis. Arch Neurol. 1986;43(4):383–384. doi: 10.1001/archneur.1986.00520040063021. [DOI] [PubMed] [Google Scholar]
- 16.Smith SA, Miller RG, Murphy JR, Ringel SP. Treatment of ALS with high dose pulse cyclophosphamide. J Neurol Sci. 1994;124(suppl):84–87. doi: 10.1016/0022-510X(94)90188-0. [DOI] [PubMed] [Google Scholar]
- 17.King IL, Dickendesher TL, Segal BM. Circulating Ly-6C+ myeloid precursors migrate to the CNS and play a pathogenic role during autoimmune demyelinating disease. Blood. 2009;113(14):3190–3197. doi: 10.1182/blood-2008-07-168575. [DOI] [PMC free article] [PubMed] [Google Scholar]
- 18.Dimitrijevic OB, Stamatovic SM, Keep RF, Andjelkovic AV. Absence of the chemokine receptor CCR2 protects against cerebral ischemia/reperfusion injury in mice. Stroke. 2007;38(4):1345–1353. doi: 10.1161/01.STR.0000259709.16654.8f. [DOI] [PubMed] [Google Scholar]
- 19.Nahrendorf M, et al. The healing myocardium sequentially mobilizes two monocyte subsets with divergent and complementary functions. J Exp Med. 2007;204(12):3037–3047. doi: 10.1084/jem.20070885. [DOI] [PMC free article] [PubMed] [Google Scholar]
- 20.Mildner A, et al. Microglia in the adult brain arise from Ly-6C(hi)CCR2(+) monocytes only under defined host conditions. Nat Neurosci. 2007;10(12):1544–1553. doi: 10.1038/nn2015. [DOI] [PubMed] [Google Scholar]
- 21.Kim YG, et al. The Nod2 Sensor Promotes Intestinal Pathogen Eradication via the Chemokine CCL2-Dependent Recruitment of Inflammatory Monocytes. Immunity. 2011;34(5):769–780. doi: 10.1016/j.immuni.2011.04.013. [DOI] [PMC free article] [PubMed] [Google Scholar]
- 22.Nagata T, et al. Elevation of MCP-1 and MCP-1/VEGF ratio in cerebrospinal fluid of amyotrophic lateral sclerosis patients. Neurol Res. 2007;29(8):772–776. doi: 10.1179/016164107X229795. [DOI] [PubMed] [Google Scholar]
- 23.Ransohoff RM, Cardona AE. The myeloid cells of the central nervous system parenchyma. Nature. 2010;468(7321):253–262. doi: 10.1038/nature09615. [DOI] [PubMed] [Google Scholar]
- 24.Mildner A, et al. CCR2+Ly-6Chi monocytes are crucial for the effector phase of autoimmunity in the central nervous system. Brain. 2009;132(pt 9):2487–2500. doi: 10.1093/brain/awp144. [DOI] [PubMed] [Google Scholar]
- 25.Saederup N, et al. Selective chemokine receptor usage by central nervous system myeloid cells in CCR2-red fluorescent protein knock-in mice. PLoS One. 2010;5(10):e13693. doi: 10.1371/journal.pone.0013693. [DOI] [PMC free article] [PubMed] [Google Scholar]
- 26.Deaglio S, et al. Adenosine generation catalyzed by CD39 and CD73 expressed on regulatory T cells mediates immune suppression. J Exp Med. 2007;204(6):1257–1265. doi: 10.1084/jem.20062512. [DOI] [PMC free article] [PubMed] [Google Scholar]
- 27.Braun N, et al. Assignment of ecto-nucleoside triphosphate diphosphohydrolase-1/cd39 expression to microglia and vasculature of the brain. Eur J Neurosci. 2000;12(12):4357–4366. [PubMed] [Google Scholar]
- 28.Guttman M, et al. lincRNAs act in the circuitry controlling pluripotency and differentiation. Nature. 2011;477(7364):295–300. doi: 10.1038/nature10398. [DOI] [PMC free article] [PubMed] [Google Scholar]
- 29.Malkov VA, et al. Multiplexed measurements of gene signatures in different analytes using the Nanostring nCounter Assay System. BMC Res Notes. 2009;2:80. doi: 10.1186/1756-0500-2-80. [DOI] [PMC free article] [PubMed] [Google Scholar]
- 30. Kulkarni MM. Digital multiplexed gene expression analysis using the NanoString nCounter system. Curr Protoc Mol Biol. 2011. Chapter 25: Unit25B .10. [DOI] [PubMed] [Google Scholar]
- 31.Geiss GK, et al. Direct multiplexed measurement of gene expression with color-coded probe pairs. Nat Biotechnol. 2008;26(3):317–325. doi: 10.1038/nbt1385. [DOI] [PubMed] [Google Scholar]
- 32.Park JM, et al. Signaling pathways and genes that inhibit pathogen-induced macrophage apoptosis--CREB and NF-kappaB as key regulators. Immunity. 2005;23(3):319–329. doi: 10.1016/j.immuni.2005.08.010. [DOI] [PubMed] [Google Scholar]
- 33.Hirata Y, et al. Sp1 is an essential transcription factor for LPS-induced tissue factor expression in THP-1 monocytic cells, and nobiletin represses the expression through inhibition of NF-kappaB, AP-1, and Sp1 activation. Biochem Pharmacol. 2008;75(7):1504–1514. doi: 10.1016/j.bcp.2007.12.019. [DOI] [PubMed] [Google Scholar]
- 34.Hsieh TH, et al. Phthalates induce proliferation and invasiveness of estrogen receptor-negative breast cancer through the AhR/HDAC6/c-Myc signaling pathway. FASEB J. 2012;26(2):778–787. doi: 10.1096/fj.11-191742. [DOI] [PubMed] [Google Scholar]
- 35.Kim DW, Gazourian L, Quadri SA, Romieu-Mourez R, Sherr DH, Sonenshein GE. The RelA NF-kappaB subunit and the aryl hydrocarbon receptor (AhR) cooperate to transactivate the c-myc promoter in mammary cells. Oncogene. 2000;19(48):5498–5506. doi: 10.1038/sj.onc.1203945. [DOI] [PubMed] [Google Scholar]
- 36.Chen CZ, Li L, Lodish HF, Bartel DP. MicroRNAs modulate hematopoietic lineage differentiation. Science. 2004;303(5654):83–86. doi: 10.1126/science.1091903. [DOI] [PubMed] [Google Scholar]
- 37.Thum T, et al. MicroRNA-21 contributes to myocardial disease by stimulating MAP kinase signalling in fibroblasts. Nature. 2008;456(7224):980–984. doi: 10.1038/nature07511. [DOI] [PubMed] [Google Scholar]
- 38.Ma L, Teruya-Feldstein J, Weinberg RA. Tumour invasion and metastasis initiated by microRNA-10b in breast cancer. Nature. 2007;449(7163):682–688. doi: 10.1038/nature06174. [DOI] [PubMed] [Google Scholar]
- 39.Hebert SS, et al. Loss of microRNA cluster miR-29a/b-1 in sporadic Alzheimer’s disease correlates with increased BACE1/beta-secretase expression. Proc Natl Acad Sci U S A. 2008;105(17):6415–6420. doi: 10.1073/pnas.0710263105. [DOI] [PMC free article] [PubMed] [Google Scholar]
- 40.O’Connell RM, Rao DS, Chaudhuri AA, Baltimore D. Physiological and pathological roles for microRNAs in the immune system. Nat Rev Immunol. 2010;10(2):111–122. doi: 10.1038/nri2708. [DOI] [PubMed] [Google Scholar]
- 41.Polikepahad S, et al. Proinflammatory role for let-7 microRNAS in experimental asthma. J Biol Chem. 2010;285(39):30139–30149. doi: 10.1074/jbc.M110.145698. [DOI] [PMC free article] [PubMed] [Google Scholar]
- 42.Lehmann SM, et al. Nat Neurosci. An unconventional role for miRNA: let-7 activates Toll-like receptor 7 and causes neurodegeneration [published online ahead of print May 20, 2012]. doi: 10.1038/nn.3113 . [DOI] [PubMed] [Google Scholar]
- 43.Jennewein C, von Knethen A, Schmid T, Brune B. MicroRNA-27b contributes to lipopolysaccharide-mediated peroxisome proliferator-activated receptor gamma (PPARgamma) mRNA destabilization. J Biol Chem. 2010;285(16):11846–11853. doi: 10.1074/jbc.M109.066399. [DOI] [PMC free article] [PubMed] [Google Scholar]
- 44.Lu LF, et al. Function of miR-146a in controlling Treg cell-mediated regulation of Th1 responses. Cell. 2010;142(6):914–929. doi: 10.1016/j.cell.2010.08.012. [DOI] [PMC free article] [PubMed] [Google Scholar]
- 45.Bandres E, et al. microRNA-451 regulates macrophage migration inhibitory factor production and proliferation of gastrointestinal cancer cells. Clin Cancer Res. 2009;15(7):2281–2290. doi: 10.1158/1078-0432.CCR-08-1818. [DOI] [PubMed] [Google Scholar]
- 46.Li T, Morgan MJ, Choksi S, Zhang Y, Kim YS, Liu ZG. MicroRNAs modulate the noncanonical transcription factor NF-kappaB pathway by regulating expression of the kinase IKKalpha during macrophage differentiation. Nat Immunol. 2010;11(9):799–805. doi: 10.1038/ni.1918. [DOI] [PMC free article] [PubMed] [Google Scholar]
- 47.Schaefer JS, Montufar-Solis D, Vigneswaran N, Klein JR. Selective upregulation of microRNA expression in peripheral blood leukocytes in IL-10–/– mice precedes expression in the colon. . J Immunol. 2011;187(11):5834–5841. doi: 10.4049/jimmunol.1100922. [DOI] [PMC free article] [PubMed] [Google Scholar]
- 48.O’Connell RM, et al. MicroRNA-155 promotes autoimmune inflammation by enhancing inflammatory T cell development. Immunity. 2010;33(4):607–619. doi: 10.1016/j.immuni.2010.09.009. [DOI] [PMC free article] [PubMed] [Google Scholar]
- 49.Etzrodt M, et al. Regulation of monocyte functional heterogeneity by miR-146a and Relb. Cell Rep. 2012;1(4):317–324. doi: 10.1016/j.celrep.2012.02.009. [DOI] [PMC free article] [PubMed] [Google Scholar]
- 50.O’Connell RM, Taganov KD, Boldin MP, Cheng G, Baltimore D. MicroRNA-155 is induced during the macrophage inflammatory response. Proc Natl Acad Sci U S A. 2007;104(5):1604–1609. doi: 10.1073/pnas.0610731104. [DOI] [PMC free article] [PubMed] [Google Scholar]
- 51.Ceppi M, et al. MicroRNA-155 modulates the interleukin-1 signaling pathway in activated human monocyte-derived dendritic cells. Proc Natl Acad Sci U S A. 2009;106(8):2735–2740. doi: 10.1073/pnas.0811073106. [DOI] [PMC free article] [PubMed] [Google Scholar]
- 52.Louafi F, Martinez-Nunez RT, Sanchez-Elsner T. MicroRNA-155 targets SMAD2 and modulates the response of macrophages to transforming growth factor-{beta}. J Biol Chem. 2010;285(53):41328–41336. doi: 10.1074/jbc.M110.146852. [DOI] [PMC free article] [PubMed] [Google Scholar]
- 53.Murugaiyan G, Benyon V, Mittal A, Joller N, Weiner HL. Silencing microRNA-155 ameliorates experimental autoimmune encephalomyelitis. J Immunol. 2011;187(5):2213–2221. doi: 10.4049/jimmunol.1003952. [DOI] [PMC free article] [PubMed] [Google Scholar]
- 54.Junker A, et al. MicroRNA profiling of multiple sclerosis lesions identifies modulators of the regulatory protein CD47. Brain. 2009;132(pt 12):3342–3352. doi: 10.1093/brain/awp300. [DOI] [PubMed] [Google Scholar]
- 55.Lu LF, et al. Foxp3-dependent microRNA155 confers competitive fitness to regulatory T cells by targeting SOCS1 protein. Immunity. 2009;30(1):80–91. doi: 10.1016/j.immuni.2008.11.010. [DOI] [PMC free article] [PubMed] [Google Scholar]
- 56.Geissmann F, Jung S, Littman DR. Blood monocytes consist of two principal subsets with distinct migratory properties. Immunity. 2003;19(1):71–82. doi: 10.1016/S1074-7613(03)00174-2. [DOI] [PubMed] [Google Scholar]
- 57.Asano K, et al. CD169-positive macrophages dominate antitumor immunity by crosspresenting dead cell-associated antigens. Immunity. 2011;34(1):85–95. doi: 10.1016/j.immuni.2010.12.011. [DOI] [PubMed] [Google Scholar]
- 58.Swirski FK, et al. Identification of splenic reservoir monocytes and their deployment to inflammatory sites. Science. 2009;325(5940):612–616. doi: 10.1126/science.1175202. [DOI] [PMC free article] [PubMed] [Google Scholar]
- 59.Ajmo CT, Jr, et al. The spleen contributes to stroke-induced neurodegeneration. J Neurosci Res. 2008;86(10):2227–2234. doi: 10.1002/jnr.21661. [DOI] [PMC free article] [PubMed] [Google Scholar]
- 60.Sargsyan SA, Blackburn DJ, Barber SC, Monk PN, Shaw PJ. Mutant SOD1 G93A microglia have an inflammatory phenotype and elevated production of MCP-1. Neuroreport. 2009;20(16):1450–1455. doi: 10.1097/WNR.0b013e328331e8fa. [DOI] [PMC free article] [PubMed] [Google Scholar]
- 61.Mantovani S, et al. Immune system alterations in sporadic amyotrophic lateral sclerosis patients suggest an ongoing neuroinflammatory process. J Neuroimmunol. 2009;210(1–2):73–79. doi: 10.1016/j.jneuroim.2009.02.012. [DOI] [PubMed] [Google Scholar]
- 62.Bjorkqvist M, et al. A novel pathogenic pathway of immune activation detectable before clinical onset in Huntington’s disease. J Exp Med. 2008;205(8):1869–1877. doi: 10.1084/jem.20080178. [DOI] [PMC free article] [PubMed] [Google Scholar]
- 63.Fendrick SE, Xue QS, Streit WJ. Formation of multinucleated giant cells and microglial degeneration in rats expressing a mutant Cu/Zn superoxide dismutase gene. J Neuroinflammation. 2007;4:9. doi: 10.1186/1742-2094-4-9. [DOI] [PMC free article] [PubMed] [Google Scholar]
- 64.Ginhoux F, et al. Fate mapping analysis reveals that adult microglia derive from primitive macrophages. Science. 2010;330(6005):841–845. doi: 10.1126/science.1194637. [DOI] [PMC free article] [PubMed] [Google Scholar]
- 65.Ajami B, Bennett JL, Krieger C, McNagny KM, Rossi FM. Infiltrating monocytes trigger EAE progression, but do not contribute to the resident microglia pool. Nat Neurosci. 2011;14(9):1142–1149. doi: 10.1038/nn.2887. [DOI] [PubMed] [Google Scholar]
- 66.Taganov KD, Boldin MP, Chang KJ, Baltimore D. NF-kappaB-dependent induction of microRNA miR-146, an inhibitor targeted to signaling proteins of innate immune responses. Proc Natl Acad Sci U S A. 2006;103(33):12481–12486. doi: 10.1073/pnas.0605298103. [DOI] [PMC free article] [PubMed] [Google Scholar]
- 67.Zhou R, Hu G, Liu J, Gong AY, Drescher KM, Chen XM. NF-kappaB p65-dependent transactivation of miRNA genes following Cryptosporidium parvum infection stimulates epithelial cell immune responses. PLoS Pathog. 2009;5(12):e1000681. doi: 10.1371/journal.ppat.1000681. [DOI] [PMC free article] [PubMed] [Google Scholar]
- 68.Akira S, Takeda K, Kaisho T. Toll-like receptors: critical proteins linking innate and acquired immunity. Nature Immunol. 2001;2(8):675–680. doi: 10.1038/90609. [DOI] [PubMed] [Google Scholar]
- 69.Ischiropoulos H, Beckman JS. Oxidative stress and nitration in neurodegeneration: cause, effect, or association? J Clin Invest. 2003;111(2):163–169. doi: 10.1172/JCI17638. [DOI] [PMC free article] [PubMed] [Google Scholar]
- 70.Bruijn LI, et al. Aggregation and motor neuron toxicity of an ALS-linked SOD1 mutant independent from wild-type SOD1. Science. 1998;281(5384):1851–1854. doi: 10.1126/science.281.5384.1851. [DOI] [PubMed] [Google Scholar]
- 71.Urushitani M, Sik A, Sakurai T, Nukina N, Takahashi R, Julien JP. Chromogranin-mediated secretion of mutant superoxide dismutase proteins linked to amyotrophic lateral sclerosis. Nat Neurosci. 2006;9(1):108–118. doi: 10.1038/nn1603. [DOI] [PubMed] [Google Scholar]
- 72.Hayashi S, Okabe-Kado J, Honma Y, Kawajiri K. Expression of Ah receptor (TCDD receptor) during human monocytic differentiation. Carcinogenesis. 1995;16(6):1403–1409. doi: 10.1093/carcin/16.6.1403. [DOI] [PubMed] [Google Scholar]
- 73.Wu D, et al. Activation of aryl hydrocarbon receptor induces vascular inflammation and promotes atherosclerosis in apolipoprotein E–/– mice. . Arterioscler Thromb Vasc Biol. 2011;31(6):1260–1267. doi: 10.1161/ATVBAHA.110.220202. [DOI] [PMC free article] [PubMed] [Google Scholar]
- 74.Swarup V, et al. Deregulation of TDP-43 in amyotrophic lateral sclerosis triggers nuclear factor kappaB-mediated pathogenic pathways. J Exp Med. 2011;208(12):2429–2447. doi: 10.1084/jem.20111313. [DOI] [PMC free article] [PubMed] [Google Scholar]
- 75.Rai D, Kim SW, McKeller MR, Dahia PL, Aguiar RC. Targeting of SMAD5 links microRNA-155 to the TGF-beta pathway and lymphomagenesis. Proc Natl Acad Sci U S A. 2010;107(7):3111–3116. doi: 10.1073/pnas.0910667107. [DOI] [PMC free article] [PubMed] [Google Scholar]
- 76.Roubelakis MG, et al. Human microRNA target analysis and gene ontology clustering by GOmir, a novel stand-alone application. BMC Bioinformatics. 2009;10(suppl 6):S20. doi: 10.1186/1471-2105-10-S6-S20. [DOI] [PMC free article] [PubMed] [Google Scholar]
- 77.Offner H, et al. Splenic atrophy in experimental stroke is accompanied by increased regulatory T cells and circulating macrophages. J Immunol. 2006;176(11):6523–6531. doi: 10.4049/jimmunol.176.11.6523. [DOI] [PubMed] [Google Scholar]
- 78.Drachman DB, et al. Trial of immunosuppression in amyotrophic lateral sclerosis using total lymphoid irradiation. Ann Neurol. 1994;35(2):142–150. doi: 10.1002/ana.410350205. [DOI] [PubMed] [Google Scholar]
- 79.Renton AE, et al. A hexanucleotide repeat expansion in C9ORF72 is the cause of chromosome 9p21-linked ALS-FTD. Neuron. 2011;72(2):257–268. doi: 10.1016/j.neuron.2011.09.010. [DOI] [PMC free article] [PubMed] [Google Scholar]
- 80.DeJesus-Hernandez M, et al. Expanded GGGGCC hexanucleotide repeat in noncoding region of C9ORF72 causes chromosome 9p-linked FTD and ALS. Neuron. 2011;72(2):245–256. doi: 10.1016/j.neuron.2011.09.011. [DOI] [PMC free article] [PubMed] [Google Scholar]
- 81.Gabriely G, et al. MicroRNA 21 promotes glioma invasion by targeting matrix metalloproteinase regulators. Mol Cell Biol. 2008;28(17):5369–5380. doi: 10.1128/MCB.00479-08. [DOI] [PMC free article] [PubMed] [Google Scholar]
Associated Data
This section collects any data citations, data availability statements, or supplementary materials included in this article.