Abstract
We demonstrate that freeform fabricated (FFF) scaffolds with a roughened surface topography can support hBMSC proliferation, while also inducing osteogenic differentiation, for maximized generation of calcified, bone-like tissue. Previously, hBMSCs rapidly proliferated, without osteogenic differentiation, during culture in FFF scaffolds. In contrast, hBMSCs underwent osteogenic differentiation, with slow proliferation, during culture in nanofiber scaffolds. Analysis of cell morphology showed that the topography presented by the nanofiber scaffolds drove hBMSC differentiation by guiding them into a morphology that induced osteogenic differentiation. Herein, we hypothesized that using the high-surface area architecture of FFF scaffolds to present a surface roughness that drives hBMSCs into a morphology that induces osteogenic differentiation would yield a maximum amount differentiated hBMSCs and bone-like tissue. Thus, a solvent etching method was developed that imparted a 5-of the struts of poly(ε-caprolactone) (PCL) FFF scaffolds. The etched scaffolds induced osteogenic differentiation of the hBMSCs while un-etched scaffolds did not. The etched scaffolds also supported the same high levels of hBMSC proliferation that un-etched scaffolds supported. Finally, hBMSCs on un-etched scaffolds had a large spread area, while hBMSCs on etched scaffolds has a smaller area and were more rounded, indicating that the surface roughness from the etched scaffolds dictated the morphology of the hBMSCs. The results demonstrate that FFF scaffolds with surface roughness can support hBMSC proliferation, while also inducing osteogenic differentiation, to maximize generation of calcified tissue. This work validates a rational approach to scaffold fabrication where the structure of the scaffold was designed to optimize stem cell function by controlling cell morphology.
Keywords: cell proliferation, cell spreading, osteogenesis, scaffold, topography, stem cell
1. Introduction
Tailoring the properties of three-dimensional (3D) scaffolds to enhance tissue regeneration is a primary goal in the field of tissue engineering [1]. Scaffold chemistry [2,3], biofunctionalization [4,5], mechanics [6,7] and structure [8,9] are key in determining cell response to scaffold designs. In regard to structure, it is well-established that surface topography from the micro- to the nanoscale can influence cell behavior. For orthopaedic applications, topographical cues can induce osteoprogenitor cell [10,11] and mesenchymal stem cell [8,9] osteogenesis. Using scaffold structure to control cell function is also an attractive approach in regard to scaffold cost and stability. Scaffold devices functionalized with biomolecules or loaded with growth factors are expensive to manufacture and have reduced shelf-life. The inclusion of biomolecules or growth factors in a device can also significantly increase the regulatory burden. In the U.S.A., it costs an estimated $24 million in regulatory costs to bring a low-to-moderate risk medical device to market via the 510(k) process, while it costs $75 million to bring a higher risk device to market via the pre-market approval route [12]. Further, the U.S.A. is in a healthcare cost crisis where medical care consumes 17 % of the gross domestic product [13]. Thus, development of a stable, inexpensive, scaffold with a low regulatory burden, whose physical structure can be tuned to direct tissue regeneration, would be a major advance for the field.
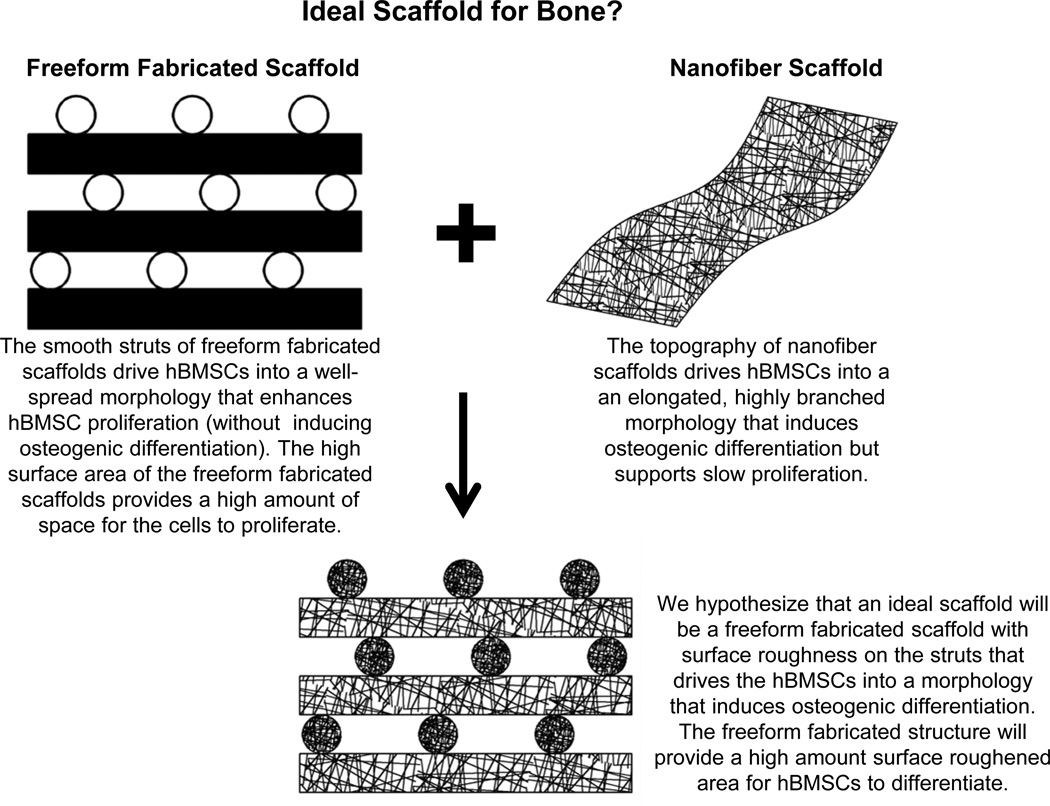
In previous work [9], many types of scaffolds were systematically screened for their ability to support proliferation and differentiation of primary human bone marrow stromal cells (hBMSCs). hBMSCs are a population of cells isolated from bone marrow that contains adult skeletal stem cells that can differentiate into bone, fat and cartilage [14–16]. It was observed that FFF scaffolds, which have an open pore structure, supported the fastest hBMSC proliferation but did not induce osteogenic differentiation [9]. In contrast, hBMSC proliferation was slow on electrospun nanofibers, but the nanofibers scaffolds induced hBMSC osteogenic differentiation. The structure of the nanofiber scaffolds guided hBMSCs to adopt morphologies that drove them towards osteogenic differentiation. Combining properties of FFF and nanofiber scaffolds would yield hybrid scaffolds that could simultaneously support hBMSC proliferation and drive osteogenic differentiation, in order to generate a maximum amount of bony tissue. Thus, we developed a solvent-etching method to generate surface roughness on the struts of FFF scaffolds. We hypothesized that the surface roughness of the scaffold struts would drive the hBMSCs into morphologies that would induce osteogenic differentiation. Further, we hypothesized that the high-surface area architecture of the FFF scaffolds would provide a high amount of roughened surface for generating a maximal amount of differentiated hBMSCs.
The same FFF scaffold design used previously [9] was used in the current work. The FFF scaffolds were fabricated by precision extrusion deposition using poly(ε-caprolactone) (PCL) [17] and were subsequently solvent-etched to create surface roughness. Herein, un-etched and etched scaffolds were characterized structurally and evaluated for their ability to support hBMSC proliferation and osteogenic differentiation.
2. Methods
2.1. Freeform Fabricated (FFF) Scaffolds and Solvent-Etching
Disc-shaped freeform fabricated (FFF) scaffolds (5 mm dia., 2 mm height, in 96-well plates) made by precision extrusion deposition [17] were purchased from 3D Biotek and used as received for un-etched scaffolds. As described previously [9], average scaffold strut diameter was 0.288 mm (S.D. was 0.029 mm), strut spacing was 0.491 mm (S.D. was 0.039 mm), scaffold porosity was 66 % (S.D. was 1 %) and there were 6 layers of struts in each scaffold. Scaffolds were etched in solvent to impart surface roughness to the struts. For etched scaffolds, scaffolds were placed in 5 mL round bottom glass tubes with 1 mL of etching solvent (10 % by volume dichloromethane and 90 % by volume acetone) for 30 s. After 30 s, etched scaffolds were immersed in 2 mL acetone for 60 s, air-dried and stored in desiccators. Scaffolds were examined by scanning electron microscopy (SEM) to observe surface morphology. Scaffolds were sputter-coated with gold for 90 s and imaged (SEM, 15kV, Hitachi s-4700-II FE-SEM).
2.2. Interferometry to Assess Roughness
An interferometric optical profilometer was used to image and measure the surface roughness of scaffold struts (Zygo NewView 7300, 50× Mirau objective with a 2× magnifier lens under white light) [18,19]. Measurements were made on 5 un-etched and 5 etched scaffolds, 2 struts per scaffold and 5 measurements per strut. Each measurement was from a 0.050 mm line that was parallel to the strut (so that strut curvature would not contribute to the measurements). Each strut from each scaffold was leveled by maximizing the spread of fringes across the surface. Arithmetic average roughness (Ra) and root mean squared roughness (RMS) were calculated. Data was acquired and analyzed using MetroPro 8.3.3 software with the minimum vertical interferometric modulation of the correlogram set to 3, which was demonstrated to ensure accuracy while acquiring maximum reflected data for measurements. Tilt controls were conducted of overlapping measurements to confirm that features remain unaltered. Since poly(ε-caprolactone) (PCL) scaffolds are semi-transparent and susceptible to producing multiple interferometric fringes for a single location, correlogram interpretation was controlled for measurement artifacts and raw interferogram acquisitions were monitored to ensure measurements were not compromised by multiple fringe conflict.
2.3. Cell Culture
Scaffolds were placed in 96-well polystyrene plates (non tissue-culture treated) for cell culture experiments. Scaffolds were sterilized by ethylene oxide (Anderson Products) and degassed for 2 d under house vacuum. Primary human bone marrow stromal cells (hBMSCs, Tulane Center for Gene Therapy, 29 year old female) were cultured at 37° C with 5 % by volume CO2 in α-minimum essential medium (Invitrogen) supplemented with 16.5 % by volume fetal bovine serum (Atlanta Biologicals) and 4 mmole/L L-glutamine [14]. For seeding scaffolds, hBMSCs (80 % confluent) were dissociated with 0.25 % mass fraction trypsin [containing 1 mmole/L ethylenediaminetetraacetate (EDTA)] and re-suspended in medium. Passage 5 hBMSCs were used for all experiments. hBMSCs (5,000 in 0.02 mL of medium) were placed on scaffolds in a droplet and allowed to adhere for 2 h before adding 0.2 mL of medium to fill each well. Medium was changed twice per week and hBMSCs were cultured for 4 time points (1 d, 7 d, 21 d, 62 d) as indicated in the figures.
2.4. Alizarin Red Staining
For Alizarin red staining, cells on scaffolds were fixed with 3.7 % formaldehyde for 24 h at 37 °C and then stained with Alizarin Red S (10 mg/mL) for 1 h. Scaffolds were washed 5 times with deionized water to remove excess stain and air dried. Digital images of stained scaffolds were acquired using a stereomicroscope. Alizarin red experiments were performed with three scaffolds per treatment (n = 3).
2.5. Osteocalcin ELISA
Levels of osteocalcin protein were measured by ELISA (enzyme-linked immunosorbent assay, BTI, BT-460) [7]. At indicated time points, scaffolds cultured with cells were rinsed with PBS and frozen until assay. For ELISA assay, thawed scaffolds were incubated in 0.5 mL of 0.5 mol/L HCl for 30 min at 37 °C. After 30 min, the pH was neutralized with NaOH (1 mol/L) and amount of osteocalcin in extracts was measured by ELISA according to manufacturer’s protocols. A standard curve using control osteocalcin was used to determine concentration. Osteocalcin ELISAs were performed with three scaffolds per treatment (n = 3).
2.6. Picogreen DNA Assay
The Picogreen DNA assay was used to quantify cell numbers in the scaffolds [20]. Scaffolds were washed with PBS (phosphate-buffered saline) and then incubated with lysis buffer (PBS with 0.175 U/mL Papain and by 14.5 mmol/L L-cysteine) for 18 h at 60°C. After incubation, 0.1 mL of lysate was transferred to a clean 96-well plate and diluted with 0.1 mL of Picogreen reagent (Invitrogen, diluted as per manufacturer’s protocol). Fluorescence (excitation 485 nm, emission 538 nm) was measured using a plate reader. A DNA standard curve was generated using known DNA concentrations to calibrate readings.
Doubling time for hBMSC division was calculated using Picogreen DNA data for un-etched and etched scaffolds from all four time points (1 d, 7 d, 21 d, 62 d). Doubling times were determined by plotting the natural log of the DNA amount versus time. Plots were fit by least squares linear regression to determine slope and doubling times were calculated by the following equation: doubling time = ln (2)(1/slope). For comparison, doubling times for different types of scaffolds were calculated using data from a previous study [9] and these data are presented in the Results section.
2.7. Confocal Microscopy and Cell Morphology Analysis
Cells on scaffolds were fixed with 3.7 % formaldehyde (mass/volume in PBS buffer) for 15 min, washed in PBS and permeabilized with 0.2 % by mass Triton X-100 for 5 min. Samples were rinsed with PBS and stained (1 h) with Alexa Fluor 546-phalloidin (20 nmol/L in PBS) and Sytox green (100 nmol/L in PBS buffer) to stain for F-actin and nuclei, respectively (Invitrogen). Confocal microscopy (Leica SP5) was used to image hBMSCs using air-dried samples. Image Z-stacks were captured with a 20×/0.70 objective (0.5 µm z-step size) for nuclei (Sytox green) and actin (Alexa Fluor 546 phalloidin). Three specimens were prepared for each treatment and several hBMSCs were imaged for each specimen.
Cell morphology analysis was performed using ImageJ software. Sytox green staining of nuclei ensured that hBMSC morphology was assessed for single cells that were not touching other cells (only one nucleus per object). Alexa Fluor 546 phalloidin-stained actin images were used to assess hBMSC morphology. The “Untilt Stack” plugin for ImageJ was used to position the hBMSCs in 3D space [21] so that the projected area was maximized. This was necessary since hBMSCs were adherent to the scaffold struts which were curved and the majority of hBMSCs were not were positioned directly on top of the struts (from the perspective of the microscope objective). Confocal Z-stack projections were constructed to project the cell area into two dimensions and thresholding was performed to yield binary images. ImageJ was used to calculate cell area, perimeter, aspect ratio, roundness and circularity.
3. Results
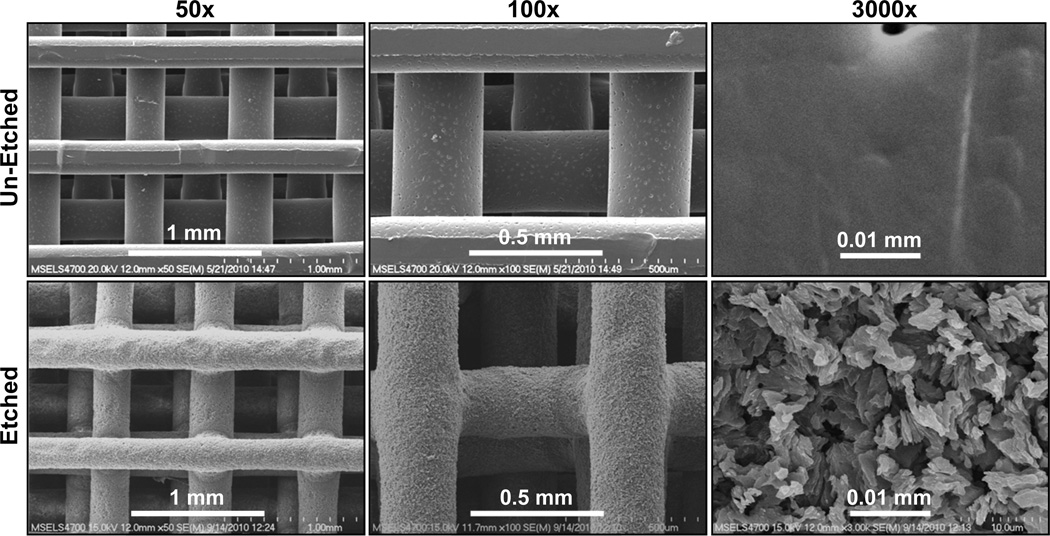
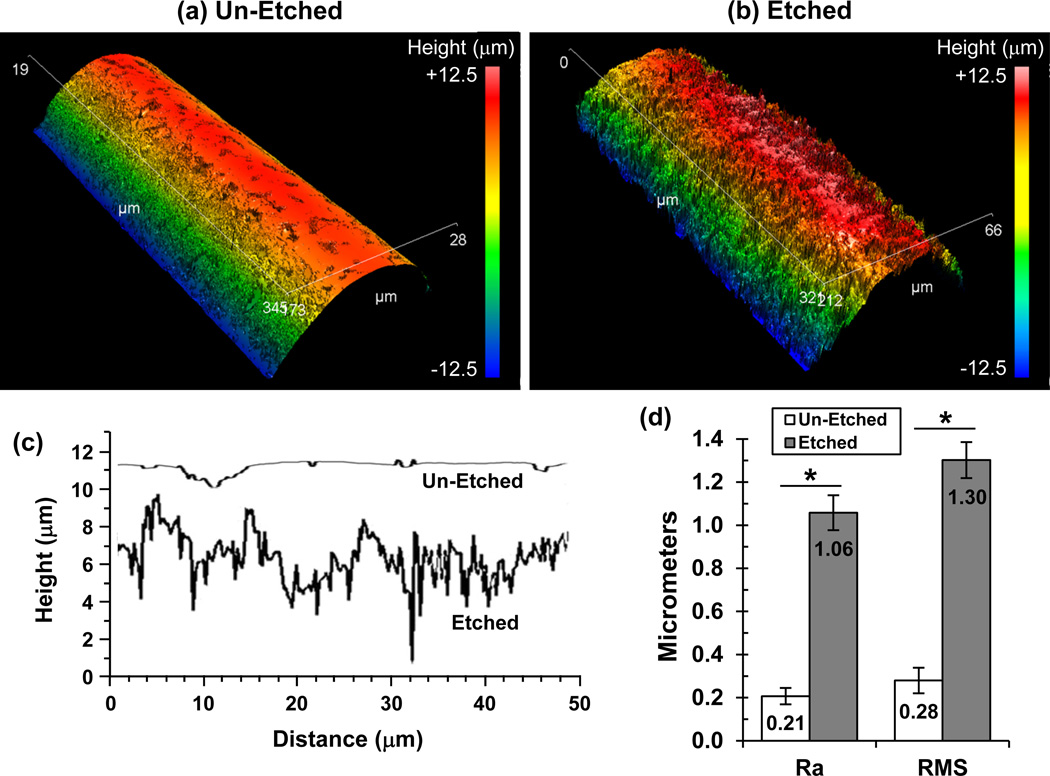
We hypothesized that FFF scaffolds with surface roughness on their struts could enhance osteogenic differentiation of hBMSCs by altering cell shape. PCL FFF scaffolds were immersed in solvent to partially erode the strut surfaces giving them a roughened surface morphology. Scanning electron micrographs (Fig. 2) show the difference in the surface roughness of un-etched and etched scaffolds. The surface roughness was quantified using interferometric optical profilometry, which showed that the struts of etched scaffolds were 5X rougher than un-etched scaffolds (Fig. 3). Un-etched scaffolds had struts with an average surface roughness (Ra) of 0.2 µm, while solvent etching increased the surface roughness for etched scaffolds to 1.1 µm.
Figure 2.
Solvent etching created surface roughness on the struts of FFF scaffolds. The surface structure of un-etched and etched scaffolds is shown in scanning electron micrographs.
Figure 3.
Surface roughness of struts from etched scaffolds were 5X rougher than struts from un-etched scaffolds. Interferometric optical profilometry was used to measure roughness of scaffold struts. (a,b) Representative 3D surface height maps are shown for struts from un-etched (a) and etched (b) scaffolds. (c) Representative surface height traces from struts of un-etched versus etched scaffolds are shown in the plot. (d) Arithmetic average roughness (Ra) and root mean squared roughness (RMS) were calculated from profilometry data of struts from un-etched and etched scaffolds. Measurements from five scaffolds (n = 5) were averaged and error bars are S.D. Significant differences are indicated by asterisk (t-test, P < 0.05).
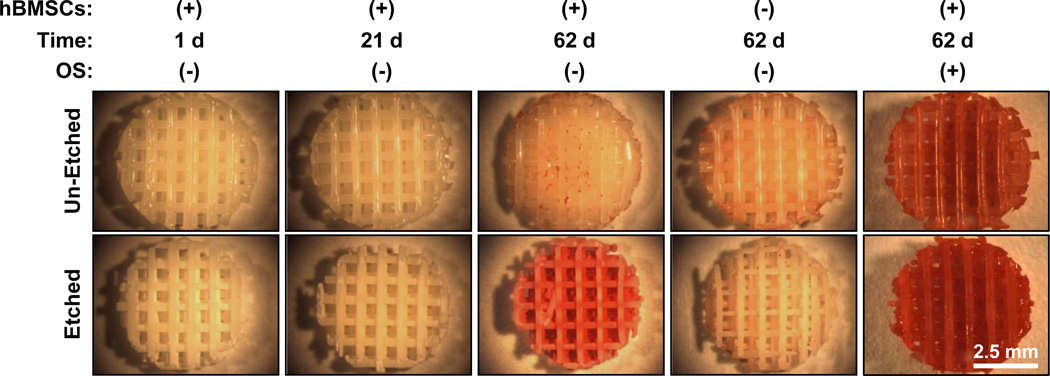
When cultured in the absence of osteogenic supplements, etched scaffolds induced hBMSC osteogenic differentiation while un-etched scaffolds did not. Etched scaffolds caused hBMSCs to calcify their matrix at 62 d culture (Fig. 4) and calcification is a standard marker for osteogenesis and osteogenic differentiation. Controls using scaffolds without hBMSCs did not mineralize, indicating that the mineralization was mediated by the hBMSCs and was not a result of non-specific calcium precipitation. In additional controls where osteogenic supplements were included in the medium, hBMSCs mineralized both un-etched and etched scaffolds indicating that both types of scaffolds could support hBMSC osteogenic differentiation under the appropriate conditions.
Figure 4.
Etched scaffolds induced hBMSCs to create a calcified matrix while un-etched scaffolds did not. Stereomicrographs of calcium staining (Alizarin red) are shown for different treatments. Controls were run without hBMSCs to show that minerals did not precipitate from culture medium and that calcification was mediated by hBMSCs. Additional controls with osteogenic supplements (OS) were performed to demonstrate that un-etched scaffolds could support osteogenesis. The scale bar in bottom right panel applies to all panels.
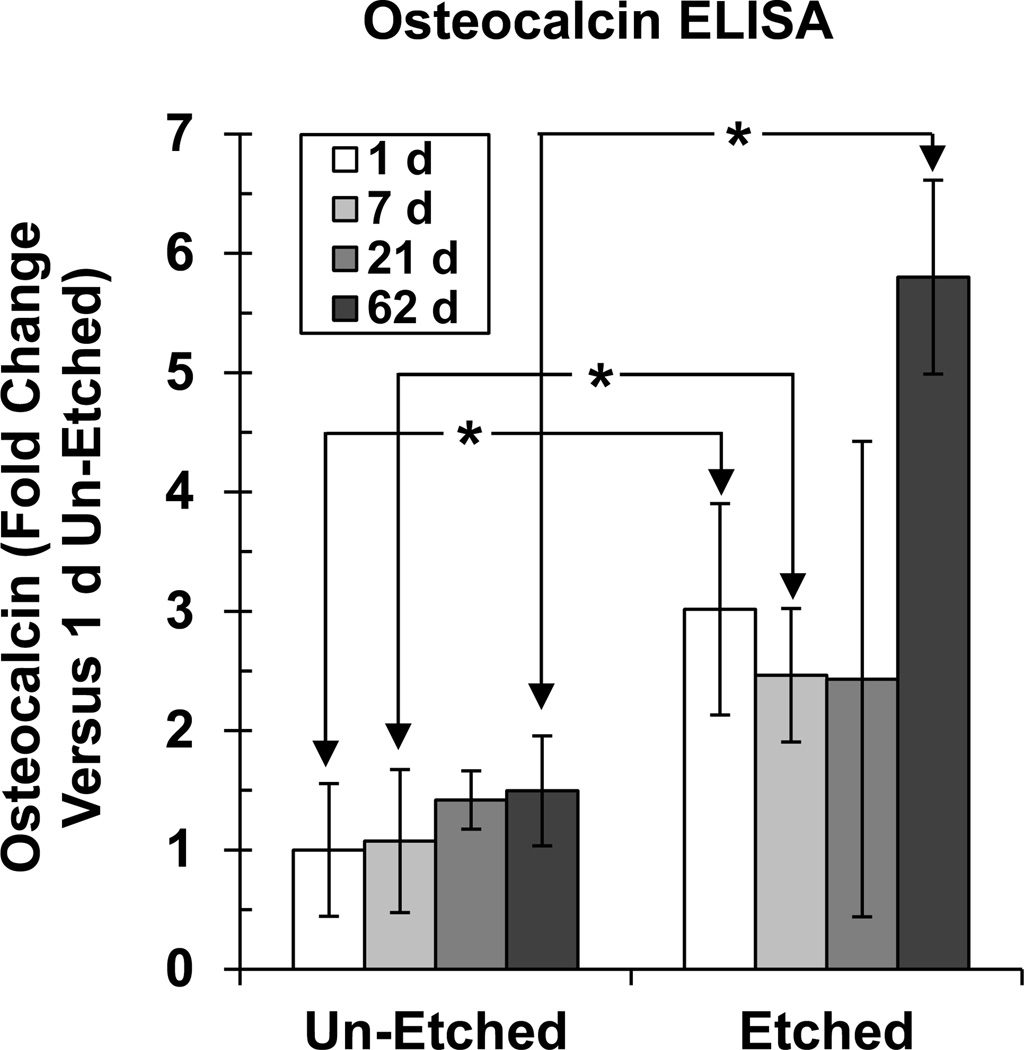
Osteocalcin expression was measured as a second marker for osteogenic differentiation [22] (Fig. 5). Osteocalcin expression did not change significantly from 1 d to 62 d culture for hBMSCs cultured on un-etched scaffolds. However, osteocalcin increased significantly for etched scaffolds by 62 d culture. When comparing un-etched versus etched, hBMSCs expressed significantly more osteocalcin on the etched scaffolds at 1 d, 7 d and 62 d. Taken together, these results indicated that the surface topography on the etched scaffolds drove hBMSCs to synthesize a calcified matrix that contained osteocalcin, whereas the un-etched scaffolds did not.
Figure 5.
Etched scaffolds induced hBMSC osteocalcin expression. At various time points, the matrix that formed on the scaffolds was assayed for osteocalcin protein using ELISA. Error bars are S.D. (n = 4). Asterisks indicate significant differences between un-etched and etched scaffolds for 1 d, 7 d and 62 d (t-test, P < 0.05). Osteocalcin did not change significantly over time for un-etched [one-way analysis of variance (ANOVA) with Tukey’s test, P > 0.05]. Osteocalcin changed significantly over time for etched scaffolds and 62 d was significantly higher than 1 d, 7 d and 21 d (ANOVA with Tukey’s test, P < 0.05).
Proliferation of hBMSCs on scaffolds was measured using the Picogreen assay to measure DNA levels (Fig. 6). DNA levels increased significantly over time for both un-etched and etched scaffolds. In addition, there were no significant differences between un-etched and etched scaffolds for DNA levels at any time points. These results indicate that hBMSCs proliferated on both types of scaffolds equally well.
Figure 6.
hBMSCs proliferated well on both un-etched and etched scaffolds. (a) hBMSC DNA was measured by Picogreen assay. Error bars are S.D. (n = 4). There were significant increases in DNA levels over time for both etched and un-etched scaffolds (ANOVA with Tukey’s, P < 0.05). There were no significant differences between un-etched and etched scaffolds at any time points (t-test, P > 0.05). (b) Doubling time for hBMSC proliferation on different scaffolds. The six bars to the left are from previous work [9] using various PCL scaffolds. The two bars to the right are the current study and are calculated from Panel A.
DNA measurements in Fig. 6a were used to calculate the doubling times plotted in Fig. 6b. For comparison, results from a previous study [9] are also plotted in Fig. 6b where hBMSCs were cultured on a variety of PCL scaffolds and their proliferation was measured. Fig. 6b shows that in the previous study [9] hBMSCs had the lowest doubling time (fastest proliferation) during culture on un-etched FFF scaffolds. The results from the current work showed that both etched and un-etched FFF scaffolds supported faster doubling times than was seen for other types of scaffolds in the previous work (Fig. 6b). These data demonstrate that etched FFF scaffolds supported fast hBMSC proliferation in addition to inducing hBMSC osteogenic differentiation.
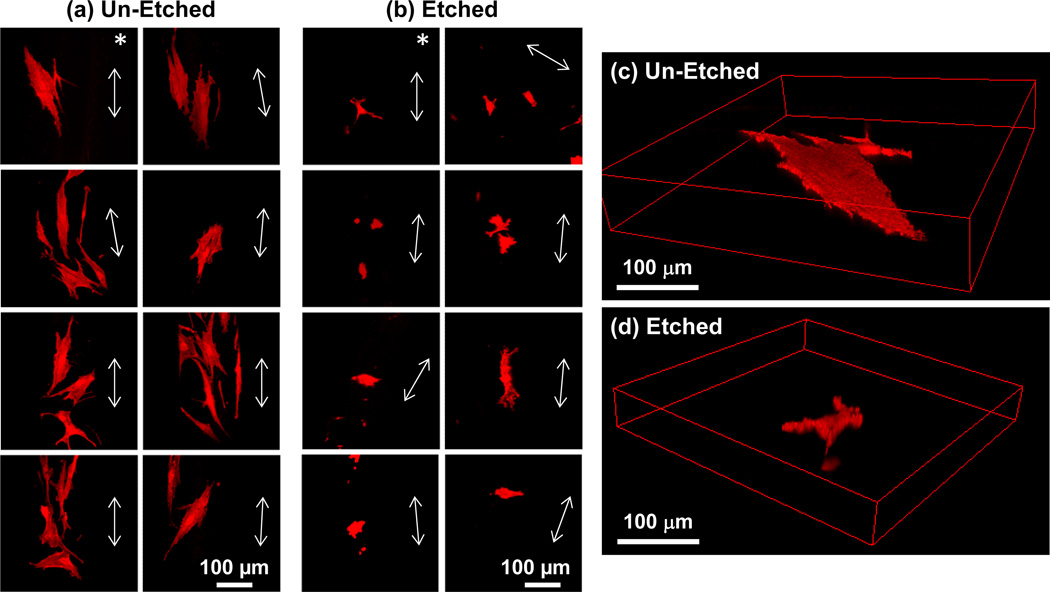
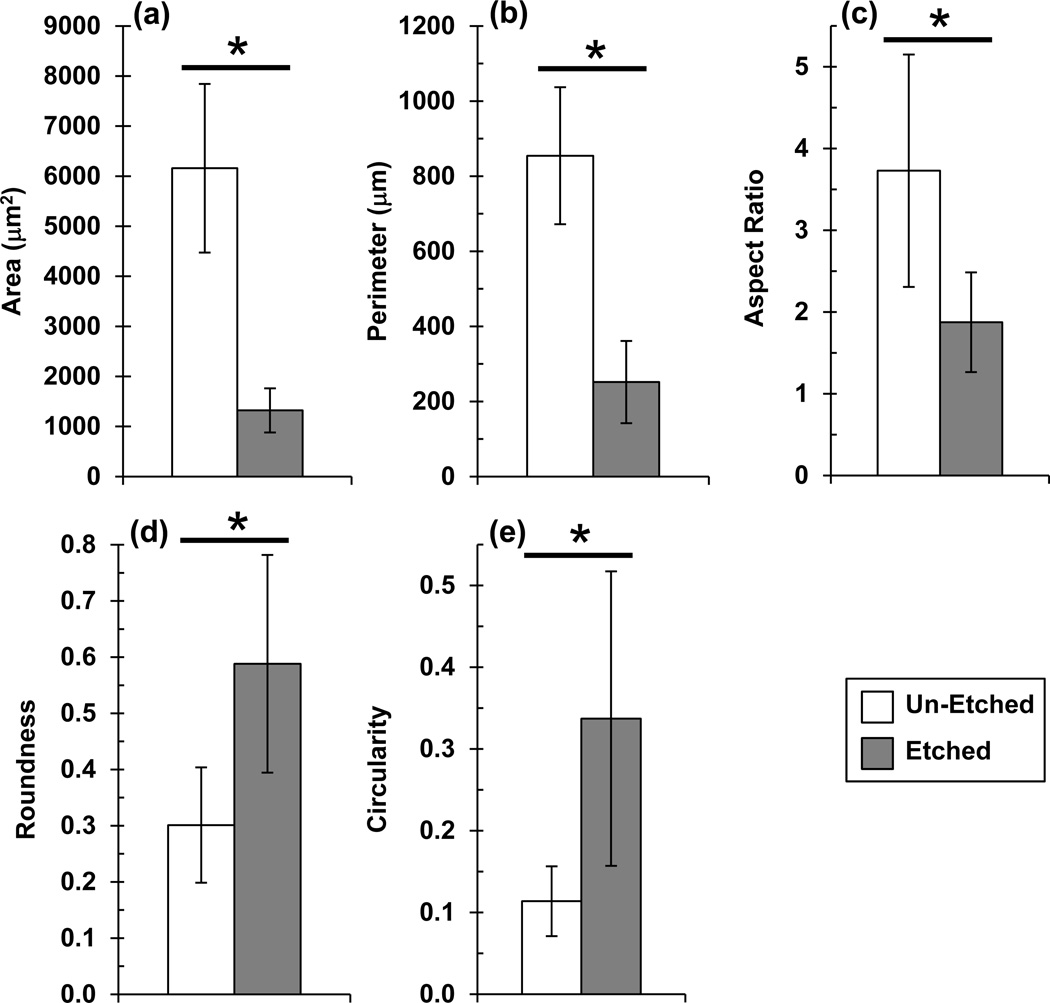
The ability of etched scaffolds to induce hBMSC osteogenic differentiation was further investigated to determine a potential mechanism. Since, previous work demonstrated a tight link between cell morphology and cell function [23–25], hBMSC morphology was assessed. hBMSCs assumed a smaller spread area and were more rounded during culture on etched scaffolds as compared to un-etched scaffolds (Fig. 7). hBMSCs on etched scaffolds had a significantly smaller spread area, smaller perimeter, smaller aspect ratio, higher circularity and higher roundness than hBMSCs on un-etched scaffolds (P < 0.05) (Fig. 8). These results suggest that roughness on the struts of the etched scaffolds drove the hBMSCs into a less-spread, more-rounded morphology that guided them towards osteogenic differentiation.
Figure 7.
hBMSCs have a smaller spread area and are more rounded during culture on etched scaffolds than on un-etched scaffolds. The morphology of hBMSCs after 1 d culture was assessed by confocal microscopy (actin staining, Alexa Fluor 546 phalloidin). Maximum intensity Z-projections of 8 fields on un-etched (a) and etched (b) scaffolds are shown. Arrows in each panel indicate direction of the long axis of the strut upon which the cells were adherent. hBMSC 3D renderings are shown for perspective in (c) for un-etched and in (d) for etched scaffolds. The asterisks in (a,b) indicate the hBMSCs that are shown in (c,d).
Figure 8.
Image analysis of hBMSC morphology during culture on un-etched and etched scaffolds (1 d). Confocal fluorescence images of actin-stained hBMSCs (Alexa Fluor 546 phalloidin) were analyzed to quantify cell area (a), perimeter (b), aspect ratio (c), roundness (d) and circularity (e). Maximum intensity Z-projections were used for analysis. Error bars are S.D. (n = 10 cells). Asterisks indicate significant differences (p < 0.05, t-test).
4. Discussion
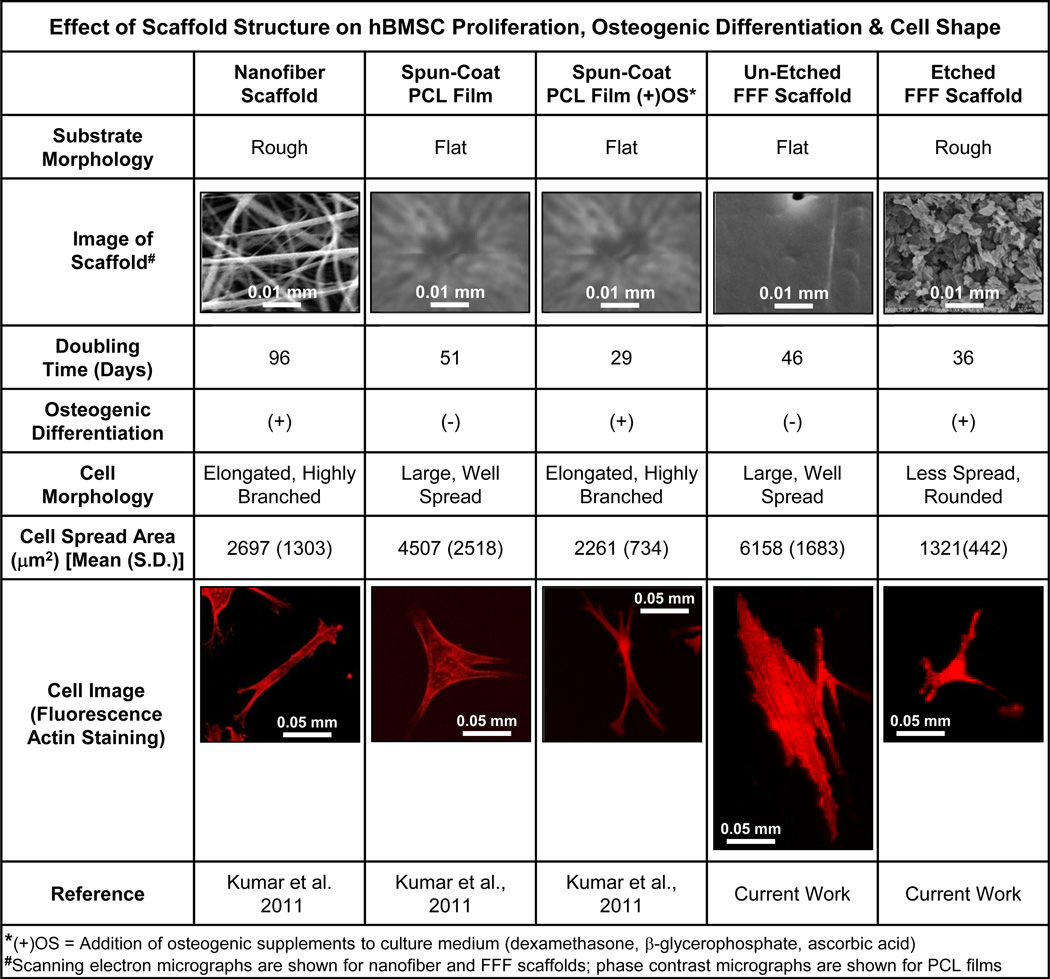
There is strong evidence for a link between cell shape and cell function [23–25] in hBMSCs [9,26–28]. hBMSC differentiation down an osteogenic or adipogenic lineage can be controlled by cell shape [26] and induction of osteogenic differentiation using biochemical supplements causes distinct changes in hBMSC morphology [27]. Combining the current results and previous results [9] in Fig. 9, we have evaluated 5 treatments for hBMSC proliferation, osteogenic differentiation and cell shape. The two treatments that lead to a well-spread hBMSC morphology (spun-coat films and un-etched FFF scaffold struts) caused fast cell proliferation but no osteogenic differentiation. The other 3 treatments (nanofiber scaffolds, ‘spun-coat films with osteogenic supplements’ and etched FFF scaffolds) caused smaller cell areas (Fig. 9) and lead to osteogenic differentiation. Previous reports [23–25] generally support the notion that well spread cells with large areas tend to proliferate and that cells with smaller spread areas tend to differentiate. The results in Fig. 9 agree in that the treatments with large cell spread areas (spun-coat films and un-etched FFF scaffolds) did not differentiate and the treatments with small cell spread areas (nanofiber scaffolds, spun-coat films with osteogenic supplements and etched FFF scaffolds) did differentiate. However, there were exceptions to the generality: hBMSCs on ‘spun-coat films with osteogenic supplements’ and on ‘etched FFF scaffolds’ had a small cell area but underwent both osteogenic differentiation and high proliferation. These results suggest that there are more lessons to be learned regarding the relationships between scaffold structure, cell shape and cell function.
Figure 9.
Summary graphic for effect of scaffold structure on hBMSC proliferation, osteogenic differentiation and cell shape, during culture on 5 different substrates. Data in the graphic comes from the current work and Kumar et al. [9].
For the current work, it is interesting to consider if hBMSCs sensed strut curvature (Fig. S1). At low magnification, FFF scaffolds struts appeared as “logs” stacked at 90° angles (Fig. S1c). However, the struts appeared as flat surfaces when viewed at the length-scale of an hBMSC. An adherent hBMSC on a flat surface was 0.1 mm across while a FFF scaffold strut was 0.288 mm in diameter. Using these values and the principles of trigonometry, the Z-depth experienced across the cell body of an hBMSC that was adherent to a scaffold strut can be calculated and was 8.6 µm (Fig. S1). hBMSCs tended to align with the long axis of the un-etched struts indicating that they sensed the strut curvature (Fig. 7, Fig. S1). Even though hBMSCs were “aware” of un-etched strut curvature, they still behaved like they were on a flat surface since they attained a well spread morphology, proliferated quickly and did not differentiate (Fig. 9).
In contrast, hBMSCs did not align with the long axis of the struts for etched FFF scaffolds. hBMSC spread areas were much smaller on etched scaffolds which means they felt less of a change in Z-depth from the strut curvature. For a simple calculation, assume that the diameter of hBMSCs on etched scaffolds was half that of un-etched scaffolds (this is reasonable based on the hBMSC images in Fig. 7), which means that the Z-depth experienced across the cell body of an hBMSC on an etched strut was half (4.3 µm) that of un-etched struts (8.6 µm). The 4.3 µm change in Z-depth due to strut curvature for etched scaffolds is within the range of Z-depth that the hBMSCs will experience due to the roughness from the etching. The profilometer Z-trace made parallel to the long axis of an etched FFF scaffold strut had a Z-depth range of 5 µm to 6 µm (Fig. 3c). Thus, hBMSCs probably did not align with the long axis of the struts in etched FFF scaffolds because the strut curvature was masked by the surface roughness induced by the etching.
Ma’s group has also imparted surface roughness to struts in FFF scaffolds [29,30]. A reverse fabrication approach using negative molds created 3D scaffolds with struts and a phase separation approach was used to generate surface roughness on the struts. The scaffolds with increased strut roughness enhanced proliferation and osteogenic differentiation of MC3T3-E1 murine osteoblasts. In addition, a reverse fabrication with phase separation was used to make sphere-templated scaffolds with and without roughness on the scaffold pore walls. The scaffolds with roughened pore walls enhanced proliferation and odontogenic differentiation of human dental pulp stem cells both in vitro and in vivo (mouse subcutaneous model). Morphology of the adherent osteoblasts or dental pulp stem cells was not evaluated in either of these reports. Ma and colleagues observed increased adsorption of cell adhesive proteins (fibronectin, vitronectin) to the roughened scaffolds which they suggested enhanced differentiation [31]. They also proposed that transport of nutrients and waste was improved on the roughened scaffolds which caused the observed increase in cell differentiation.
Jamison and colleagues also modified the surface roughness on scaffold struts by making calcium phosphate FFF scaffolds with strut micropores [32,33]. When these scaffolds were loaded with rhBMP-2 and implanted intramuscularly in pigs, bone only formed in scaffolds containing micropores [33]. The authors suggested that the strut micropores improved retention of rhBMP-2 within the scaffolds causing the increased osteogenesis. The micropores in the scaffold struts may also affect the morphology of adherent cells, though cell morphology was not assessed.
5. Conclusions
A solvent etching approach was used to create FFF scaffolds that had roughened surface struts that guided hBMSCs into a morphology that induced osteogenic differentiation. The etched scaffolds drove adherent hBMSCs into a smaller, more rounded morphology, whereas hBMSCs on un-etched FFF scaffolds attained a well-spread morphology with larger cell area. In addition to inducing osteogenic differentiation, the etched FFF scaffolds also supported a high rate of hBMSC proliferation. The results demonstrate a simple, inexpensive approach for making scaffolds with a structure that inherently induced osteogenic differentiation of hBMSCs. Further, this work validates a rational approach to scaffold design where the scaffold architecture was constructed to modulate stem cell function by controlling stem cell morphology.
Supplementary Material
Figure 1.
The goal of the current work was to create a freeform fabricated scaffold with a roughened topography on its struts that would induce osteogenic differentiation to generate a maximum amount of bone-like tissue. We hypothesized that a freeform fabricated (FFF) scaffold that had a surface topography on its struts, that drove hBMSCs into a morphology that would induce osteogenic differentiation, could achieve this goal.
Acknowledgments
G.K., M.S.W. and T.M.F. were supported by postdoctoral fellowships from NIH-NIBIB/NIST NRC, NIST-ARRA NRC and NIST-ARRA NRC, respectively. This work was supported by NIST and the Intramural Program of the NIH/NIDCR (National Institute of Dental and Craniofacial Research). The hBMSCs employed in this work were provided by the Tulane Center for Gene Therapy through a grant from NCRR of the NIH P40RR017447. The “standard deviation” (S.D.) is the same as the “combined standard uncertainty of the mean” for the purposes of this work. The content is solely the responsibility of the authors and does not necessarily represent the official views of NIH, NIBIB, NIDCR or NIST. This article, a contribution of NIST, is not subject to US copyright. Certain equipment and instruments or materials are identified in the paper to adequately specify the experimental details. Such identification does not imply recommendation by NIST, nor does it imply the materials are necessarily the best available for the purpose.
References
- 1.Stevens MM, George JH. Exploring and engineering the cell surface interface. Science. 2005;31(5751):1135–1138. doi: 10.1126/science.1106587. [DOI] [PubMed] [Google Scholar]
- 2.Kohn J, Welsh WJ, Knight D. A new approach to the rationale discovery of polymeric biomaterials. Biomaterials. 2007;28(29):4171–4177. doi: 10.1016/j.biomaterials.2007.06.022. [DOI] [PMC free article] [PubMed] [Google Scholar]
- 3.Benoit DS, Schwartz MP, Durney AR, Anseth KS. Small functional groups for controlled differentiation of hydrogel-encapsulated human mesenchymal stem cells. Nat Mater. 2008;7(10):816–823. doi: 10.1038/nmat2269. [DOI] [PMC free article] [PubMed] [Google Scholar]
- 4.Petrie TA, Raynor JE, Dumbauld DW, Lee TT, Jagtap S, Templeman KL, et al. Multivalent integrin-specific ligands enhance tissue healing and biomaterial integration. Sci Transl Med. 2010;2(45):45–60. doi: 10.1126/scitranslmed.3001002. [DOI] [PMC free article] [PubMed] [Google Scholar]
- 5.Grafahrend D, Heffels KH, Beer MV, Gasteier P, Moller M, Boehm G, et al. Degradable polyester scaffolds with controlled surface chemistry combining minimal protein adsorption with specific bioactivation. Nat Mater. 2011;10(1):67–73. doi: 10.1038/nmat2904. [DOI] [PubMed] [Google Scholar]
- 6.Engler AJ, Sen S, Sweeney HL, Discher DE. Matrix elasticity directs stem cell lineage specification. Cell. 2006;126(4):677–689. doi: 10.1016/j.cell.2006.06.044. [DOI] [PubMed] [Google Scholar]
- 7.Parekh SH, Chatterjee K, Lin-Gibson S, Moore NM, Cicerone MT, Young MF, et al. Modulus-driven differentiation of marrow stromal cells in 3D scaffolds that is independent of myosin-based cytoskeletal tension. Biomaterials. 2011;32(9):2256–2264. doi: 10.1016/j.biomaterials.2010.11.065. [DOI] [PMC free article] [PubMed] [Google Scholar]
- 8.Dalby MJ, Gadegaard N, Tare R, Andar A, Riehle MO, Herzyk P, et al. The control of human mesenchymal cell differentiation using nanoscale symmetry and disorder. Nat Mater. 2007;6(12):997–1003. doi: 10.1038/nmat2013. [DOI] [PubMed] [Google Scholar]
- 9.Kumar G, Tison CK, Chatterjee K, Pine PS, McDaniel JH, Salit ML, et al. The determination of stem cell fate by 3D scaffold structures through the control of cell shape. Biomaterials. 2011;32(35):9188–9196. doi: 10.1016/j.biomaterials.2011.08.054. [DOI] [PMC free article] [PubMed] [Google Scholar]
- 10.Zhao G, Zinger O, Schwartz Z, Wieland M, Landolt D, Boyan BD, et al. Osteoblast-like cells are sensitive to submicron-scale surface structure. Clin Oral Implants. Res. 2006;17(3):258–264. doi: 10.1111/j.1600-0501.2005.01195.x. [DOI] [PubMed] [Google Scholar]
- 11.Lovmand J, Justesen E, Foss M, Lauridsen RH, Lovmand M, Modin C, et al. The use of combinatorial topographical libraries for the screening of enhanced osteogenic expression and mineralization. Biomaterials. 2009;30(11):2015–2022. doi: 10.1016/j.biomaterials.2008.12.081. [DOI] [PubMed] [Google Scholar]
- 12.Makower J, Meer A, Denend L. FDA Impact on U.S. medical technology innovation: a survey of over 200 medical technology companies. In: PricewaterhouseCoopers LLP, editor. 2010. Nov, pp. 1–43. market report editor. [Google Scholar]
- 13.Messenger MP, Tomlins PE. Regenerative medicine: a snapshot of the current regulatory environment and standards. Adv Healthcare Mater. 2011;23(12):H10–H17. doi: 10.1002/adma.201100254. [DOI] [PubMed] [Google Scholar]
- 14.Dominici M, Le BK, Mueller I, Slaper-Cortenbach I, Marini F, Krause D, et al. Minimal criteria for defining multipotent mesenchymal stromal cells. The International Society for Cellular Therapy position statement. Cytotherapy. 2006;8(4):315–317. doi: 10.1080/14653240600855905. [DOI] [PubMed] [Google Scholar]
- 15.Bianco P, Robey PG, Simmons PJ. Mesenchymal stem cells: revisiting history, concepts, and assays. Cell Stem Cell. 2008;2(4):313–319. doi: 10.1016/j.stem.2008.03.002. [DOI] [PMC free article] [PubMed] [Google Scholar]
- 16.Robey PG. Cell sources for bone regeneration: the good, the bad, the ugly (but promising) Tissue Eng Part B Rev. 2011;17(6):423–430. doi: 10.1089/ten.teb.2011.0199. [DOI] [PMC free article] [PubMed] [Google Scholar]
- 17.Darling AL, Sun W. 3D microtomographic characterization of precision extruded polyepsilon-caprolactone scaffolds. J Biomed Mater Res B Appl Biomater. 2004;70(2):311–317. doi: 10.1002/jbm.b.30050. [DOI] [PubMed] [Google Scholar]
- 18.Waters MS, Sturm CA, El-Naggar MY, Luttge A, Udwadia FE, Cvitkovitch DG, et al. In search of the microbe/mineral interface: quantitative analysis of bacteria on metal surfaces using vertical scanning interferometry. Geobiology. 2008;6(3):254–262. doi: 10.1111/j.1472-4669.2008.00161.x. [DOI] [PubMed] [Google Scholar]
- 19.Waters MS, El-Naggar MY, Hsu L, Sturm CA, Luttge A, Udwadia FE, et al. Simultaneous interferometric measurement of corrosive or demineralizing bacteria and their mineral interfaces. Appl Environ Microbiol. 2009;75(5):1445–1449. doi: 10.1128/AEM.02039-08. [DOI] [PMC free article] [PubMed] [Google Scholar]
- 20.Chatterjee K, Sun L, Chow LC, Young MF, Simon CG., Jr Combinatorial screening of osteoblast response to 3D calcium phosphate/poly(epsilon-caprolactone) scaffolds using gradients and arrays. Biomaterials. 2011;32(5):1361–1369. doi: 10.1016/j.biomaterials.2010.10.043. [DOI] [PMC free article] [PubMed] [Google Scholar]
- 21.Cooper J. The untilt stack plugin for ImageJ. 2011 computer program, http://rsbweb.nih.gov/ij/plugins/untilt-stack/index.html.
- 22.Ducy P, Karsenty G. Skeletal gla proteins: gene structure, regulation of expression, and function. In: Bilezikian JP, Raisz LG, Rodan GA, editors. Principles of bone biology. New York: Academic Press; 1996. pp. 183–195. [Google Scholar]
- 23.Folkman J, Moscona A. Role of cell shape in growth control. Nature. 1978;273(5661):345–349. doi: 10.1038/273345a0. [DOI] [PubMed] [Google Scholar]
- 24.Watt FM, Jordan PW, O'Neill CH. Cell shape controls terminal differentiation of human epidermal keratinocytes. Proc Natl Acad Sci USA. 1988;85(15):5576–5580. doi: 10.1073/pnas.85.15.5576. [DOI] [PMC free article] [PubMed] [Google Scholar]
- 25.Chen CS, Mrksich M, Huang S, Whitesides GM, Ingber DE. Geometric control of cell life and death. Science. 1997;276(5317):1425–1428. doi: 10.1126/science.276.5317.1425. [DOI] [PubMed] [Google Scholar]
- 26.McBeath R, Pirone DM, Nelson CM, Bhadriraju K, Chen CS. Cell shape, cytoskeletal tension, and RhoA regulate stem cell lineage commitment. Dev. Cell. 2004;6(4):483–495. doi: 10.1016/s1534-5807(04)00075-9. [DOI] [PubMed] [Google Scholar]
- 27.Rodriguez JP, Gonzalez M, Rios S, Cambiazo V. Cytoskeletal organization of human mesenchymal stem cells (MSC) changes during their osteogenic differentiation. J Cell Biochem. 2004;93(4):721–731. doi: 10.1002/jcb.20234. [DOI] [PubMed] [Google Scholar]
- 28.Treiser MD, Yang EH, Gordonov S, Cohen DM, Androulakis IP, Kohn J, et al. Cytoskeleton-based forecasting of stem cell lineage fates. Proc Natl Acad Sci USA. 2010;107(2):610–615. doi: 10.1073/pnas.0909597107. [DOI] [PMC free article] [PubMed] [Google Scholar]
- 29.Chen VJ, Smith LA, Ma PX. Bone regeneration on computer-designed nano-fibrous scaffolds. Biomaterials. 2006;27(21):3973–3979. doi: 10.1016/j.biomaterials.2006.02.043. [DOI] [PubMed] [Google Scholar]
- 30.Wang J, Ma H, Jin X, Hu J, Liu X, Ni L, et al. The effect of scaffold architecture on odontogenic differentiation of human dental pulp stem cells. Biomaterials. 2011;32(31):7822–7830. doi: 10.1016/j.biomaterials.2011.04.034. [DOI] [PMC free article] [PubMed] [Google Scholar]
- 31.Woo KM, Chen VJ, Ma PX. Nano-fibrous scaffolding architecture selectively enhances protein adsorption contributing to cell attachment. J Biomed. Mater Res A. 2003;67(2):531–537. doi: 10.1002/jbm.a.10098. [DOI] [PubMed] [Google Scholar]
- 32.Dellinger JG, Eurell JA, Stewart M, Jamison RD. Bone response to 3D periodic hydroxyapatite scaffolds with and without tailored microporosity to deliver bone morphogenetic protein 2. J Biomed Mater Res A. 76(2):366–376. doi: 10.1002/jbm.a.30523. 200. [DOI] [PubMed] [Google Scholar]
- 33.Woodard JR, Hilldore AJ, Lan SK, Park CJ, Morgan AW, Eurell JA, et al. The mechanical properties and osteoconductivity of hydroxyapatite bone scaffolds with multi-scale porosity. Biomaterials. 2007;28(1):45–54. doi: 10.1016/j.biomaterials.2006.08.021. [DOI] [PubMed] [Google Scholar]
Associated Data
This section collects any data citations, data availability statements, or supplementary materials included in this article.


