

Abstract
The MAPT (microtubule-associated protein tau) locus is one of the most remarkable in neurogenetics due not only to its involvement in multiple neurodegenerative disorders, including progressive supranuclear palsy, corticobasal degeneration, Parksinson's disease and possibly Alzheimer's disease, but also due its genetic evolution and complex alternative splicing features which are, to some extent, linked and so all the more intriguing. Therefore, obtaining robust information regarding the expression, splicing and genetic regulation of this gene within the human brain is of immense importance. In this study, we used 2011 brain samples originating from 439 individuals to provide the most reliable and coherent information on the regional expression, splicing and regulation of MAPT available to date. We found significant regional variation in mRNA expression and splicing of MAPT within the human brain. Furthermore, at the gene level, the regional distribution of mRNA expression and total tau protein expression levels were largely in agreement, appearing to be highly correlated. Finally and most importantly, we show that while the reported H1/H2 association with gene level expression is likely to be due to a technical artefact, this polymorphism is associated with the expression of exon 3-containing isoforms in human brain. These findings would suggest that contrary to the prevailing view, genetic risk factors for neurodegenerative diseases at the MAPT locus are likely to operate by changing mRNA splicing in different brain regions, as opposed to the overall expression of the MAPT gene.
INTRODUCTION
The MAPT (microtubule-associated protein tau) locus is one of the most remarkable in neurogenetics due not only to its involvement in multiple neurodegenerative disorders, including progressive supranuclear palsy (PSP) (1,2), corticobasal degeneration (CBD) (3), Parksinson's disease (PD) (4–6) and possibly Alzheimer's disease (AD) (7,8), but also its genetic evolution and complex alternative splicing—features which are to some extent linked and so all the more intriguing (9–11). Therefore, obtaining robust information regarding the expression, splicing and genetic regulation of this gene within the human brain is of immense importance and the driving force behind this paper.
The evolution of the MAPT locus has been extensively studied and it is well known that the gene sits within an inversion polymorphism on chromosome 17q21. While the majority of individuals inherit this region in the direct orientation, up to 25% of individuals of European-Caucasian descent have an ∼970 Kb sequence in the opposite orientation (9,12), inducing a larger ∼1.3–1.6 Mb region of linkage disequilibrium (LD) (13). This sequence appears, in Europeans at least, to descend from a single founder (13,14). The common haplotype clades marking the majority and inverted sequences are termed H1 and H2, respectively. It is not clear which of these sequences is the ancestral orientation because the polymorphism exists in other primate species and the rodent sequence is in the H2 orientation (9). It is worth noting that since this inversion polymorphism precludes recombination over a region of ∼1.3–1.6 Mb, haplotype-specific polymorphisms have arisen. Genetic studies, including genome-wide association, have demonstrated the importance of both the inversion polymorphism and haplotype-specific polymorphisms in disease. In fact, two distinct types of disease association have been demonstrated, of which the first is the association of the H1 haplotype with an increased risk of PD (odds ratio ∼1.7) (4–6), PSP (odds ratio 5.5) (1,2) and CBD (odds ratio ∼5) (3). The second is the association of the H1c haplotype, one of the multiple sub-haplotypes within the H1 clade, with an increased risk of PSP alone (Table 1) (additional odds ratio ∼1.5) (2,15).
Table 1.
Semi-quantitative distribution of tangle pathology in human disease
| Brain region | Alzheimer's disease | Progressive supranuclear palsy | Corticobasal degeneration | Parkinson's disease |
|---|---|---|---|---|
| FCTX | 3 | 2 | 3 | 1 |
| TCTX | 3 | 1 | 2 | 2 |
| OCTX | 2 | 0 | 0 | 0 |
| WHMT | 0 | 1 | 3 | 0 |
| HIPP | 3 | 2 | 2 | 2/3 |
| PUTM | 1 | 2 | 3 | 0 |
| THAL | 2 | 1 | 2 | 1 |
| HYPO | 1 | 2 | 2 | 1 |
| SNIG | 1 | 2 | 3 | 0 |
| MEDU | 1 | 2 | 2 | 0 |
| CRBL | 0 | 1 | 1 | 0 |
| SPCO | 0/1 | 2 | 2 | 0 |
The importance of tau, the protein product, in neurodegenerative disease was well recognized even before the advent of MAPT genetics. Tau is expressed throughout the adult human central nervous system and tau pathology, namely neurofibrillary tangles, is a notable pathological feature of a range of neurodegenerative disorders, including PSP, CBD (16) and AD (10). As well as having distinct clinical features, these diseases also have distinct, but overlapping distributions of tau pathology within the human brain. These distributions are summarized in Table 1 and show that in AD, a disease characterized by early memory loss and difficulties in executive functions, tangle pathology is most prominent in brain regions that are highly associated with these processes, namely the hippocampus, temporal cortex and frontal cortex. These findings have led some to investigate whether basal regional expression of MAPT mRNA and protein may predispose some brain regions to a higher risk of tau pathology than others and indeed there is evidence in support of this (16,17).
However, there is an increasing appreciation for the importance of not only assessing total MAPT expression, but also alternative splicing. The MAPT gene is extensively spliced to produce 12 mRNA transcripts (according to Ensembl/Havana annotation) and 7 protein isoforms. Concentrating on the known protein products within human brain (of which six are recognized), cassette splicing of exons 2 and 3 (E2 and E3), give rise to tau isoforms with 0, 1 or 2 amino-terminal repeats (0N-, 1N- or 2N-tau) and alternative splicing of exon 10 (E10), give isoforms with 3- or 4-microtubule-binding repeats in the carboxy-terminal half of tau (3R- or 4R-tau) (10). Interestingly, detailed investigation has demonstrated that neurofibrillary tangles in different diseases have a different isoform composition, suggesting that splicing is of key importance in the neuropathological process. Whereas the tangles found in PSP and CBD consist predominantly of 4R-tau (due to exon 10 inclusion), those found in AD contain both 3R- and 4R-tau (18,19). Furthermore, consistent with the findings on total tau, we have previously shown that regions of relatively high 4R-tau in PSP are more susceptible to tau-related pathology and neurodegeneration (16,17).
Understanding the expression, splicing and regulation of the mRNA and protein isoforms is of key importance to the field. At present, no robust and coherent study of this type has been performed. In order to address this, we used data from the UK Human Brain Expression Consortium (UKBEC), the largest exon-specific expression data set currently available (20), containing up to 10 distinct brain regions (including hippocampus and substantia nigra) sampled from 134 neuropathologically normal individuals (see details of the brains studied in Table 2 and Supplementary Material, Table S1) (20). In addition, expression QTL analysis was performed to understand the effects of both the H1 and H1c risk haplotypes on MAPT expression and splicing (Table 2). In order to increase statistical power, the latter was performed using a second data set originating from 390 neuropathologically normal individuals from the North American Brain Expression Consortium (NABEC) (see details of the brains studied in Table 2 and Supplementary Material, Table S1) (21).
Table 2.
Demographics of the brains studied for each major type of analysis conducted
| Analysis | Source | n | Sex |
Age (years) | PMI (h) | |||
|---|---|---|---|---|---|---|---|---|
| M | F | Range | Mean | Range | Mean | |||
| Regional distribution and splicing of MAPT mRNA | UKBEC | 134 | 99 | 35 | 16–102 | 58 | 1–99 | 41.7 |
| The effect of H1/H2 haplotypes on mRNA expression and splicing | ||||||||
| The effect of the H1c haplotype on MAPT mRNA expression | NABEC | 305 | 204 | 101 | 16–101 | 50 | 1.5–96 | 13.5 |
| UKBEC | 85 | 64 | 21 | 16–83 | 51 | 28–96 | 54.4 | |
RESULTS
Regional distribution and splicing of MAPT mRNA expression in human brain
The frontal cortex (FCTX, n = 127), temporal cortex (TCTX, n = 119), occipital cortex (specifically primary visual cortex, OCTX, n = 129), hippocampus (HIPP, n = 122), thalamus (THAL, n = 124), cerebellum (CRBL, n = 130), substantia nigra (SNIG, n = 101), putamen (PUTM, n = 129), medulla (specifically inferior olivary nucleus, MEDU, n = 119) and intralobular white matter (WHMT, n = 131), originating from 134 individuals from the UKBEC, were profiled on 1231 Affymetrix Human Exon 1.0 ST arrays. The regional distribution of MAPT mRNA expression at the gene level is shown in Figure 1. This demonstrated significant regional differences in MAPT mRNA expression with a 1.5-fold difference (paired t-test P-value = 5.7 × 10−49) between the frontal cortex, the highest MAPT expressing region, and the white matter, the lowest (Fig. 1). Regional differences in MAPT mRNA expression were confirmed on a subset of 12 individuals in 4 brain regions (CRBL, OCTX, PUTM and WHMT) using QuantiGene, which showed a similar pattern [please see Figure 5b in reference (20) for MAPT mRNA expression].
Figure 1.

Regional distribution of MAPT mRNA expression: box plot of mRNA expression levels for MAPT in 10 brain regions, based on microarray experiments and plotted on a log2 scale (y-axis). This plot shows the variation in MAPT transcript expression across 10 brain regions: the frontal cortex (FCTX, n = 127), temporal cortex (TCTX, n = 119), occipital cortex (specifically primary visual cortex, OCTX, n = 129), hippocampus (HIPP, n = 122), thalamus (THAL, n = 124), cerebellum (CRBL, n = 130), substantia nigra (SNIG, n = 101), putamen (PUTM, n = 129), medulla (specifically inferior olivary nucleus, MEDU, n = 119) and intralobular white matter (WHMT, n = 131). Whiskers extend from the box to 1.5 times the inter-quartile range.
The unique design of the Affymetrix Exon arrays, with probe sets targeted against individual exons, also allowed us to investigate regional differences in MAPT mRNA splicing (alternative splicing P-value < 1 × 10−45, Fig. 2C). This demonstrated a relative reduction in the expression of exon 2 in white matter when compared with other brain regions, suggesting lower expression of exon 2-containing isoforms specifically in this tissue. Similarly, there was a relative increase in the expression of exon 6 in the cerebellum when compared with other brain regions, suggesting higher expression of exon 6 containing isoforms in this tissue (Fig. 2C). Alternate splicing of exon 2 in white matter was confirmed by TaqMan assays for 0N (E2−, 3−), 1N (E2+, 3−) and 2N (E2+, 3+) transcripts (Supplementary Material, Fig. S1). These assays demonstrated a selective reduction of exon-2-containing transcripts (2N-tau and 1N-tau) in white matter, whereas 0N-tau isoforms, which do not contain exon 2 or 3, were unchanged between the selected regions.
Figure 2.

MAPT gene/exon structure, position of expression probes and array expression. (A, upper panel) The structure of the MAPT gene. The position of Affymetrix exon array probe sets (from probe set 3723707 to 3723753) and probe sets of Illumina transcript expression array (ILMN_2298727, ILMN_1800049, ILMN_1710903 and ILMN_2310814) are indicated within the MAPT exons. (B, middle panel) The tau protein isoforms expressed in the human brain. Alternative splicing of exons 2, 3 and 10 generates six protein isoforms of tau with either 0, 1 or 2 N-terminal repeats and 3 or 4 C-terminal microtubule-binding repeats. (C, lower panel) Exon array data show the expression of MAPT expression at the exon level matching the upper panel of the exon structure. The mean expression levels were (y-axis, log2 scale) plotted for each probe set (x-axis) covering the whole transcript. Note that levels are not absolute since they depend upon the hybridization efficiency of individual probe sets. It is, therefore, not possible to compare the expression between exons. Differences in splicing between brain regions are manifest through the non-parallelism between the expression lines. Two examples are clear: at exon 2, the white matter (light green line) shows less inclusion of this exon than would be expected and at exon 6, the cerebellum (red line) shows more inclusion.
Regional distribution of MAPT protein expression in human brain
The relationship between mRNA and protein expression is complex. However, establishing that relationship for MAPT is critical in interpreting reported expression quantitative trait loci, which have largely depended on mRNA expression levels alone. We assessed the regional variability in total tau protein expression levels in 5 brain regions (CRBL, FCTX, OCTX, PUTM and WHMT) in 12 individuals (Fig. 3A and B). This analysis showed that the frontal cortex has the highest tau protein levels with decreasing levels in the following order: frontal cortex > occipital cortex > white matter > putamen > cerebellum. Cerebellar tau protein levels were significantly lower than all other regions examined (Fig. 3B, P < 0.01) and tau protein levels in the putamen were significantly lower than the frontal cortex and occipital cortex (P < 0.05). These findings are largely in agreement with our mRNA expression results which showed that cortical regions express MAPT at the highest levels and the cerebellum, putamen and white matter all have lower levels of MAPT mRNA.
Figure 3.

Variation in tau protein levels within the human brain: soluble tau extracts were prepared from five different brain regions, separated by SDS–PAGE and detected on western blots probed with the polyclonal antibody to total tau (DAKO). (A) Specific tau isoforms were identified by comparing to recombinant tau ladder (n = 13, representative image shown). (B) Comparison of total tau to actin revealed highest tau protein levels in the frontal cortex and significantly lower tau levels in the cerebellum (P > 0.01) and putamen (P > 0.05). (C) Levels of specific tau isoforms were determined by normalization to total tau for the same sample and revealed a significantly lower amount of 0N3R in the cerebellum compared with other regions. (D–H) No significant variation in other tau isoforms.
The levels of each individual isoform of tau protein were determined relative to total tau protein level for the same sample (Fig. 3C–H). We found 1N-tau protein isoforms formed the majority of total tau (∼50%), followed by 0N-tau isoforms (∼40%) with 2N-tau isoforms forming the lowest proportion of tau (∼10%), and levels of 3R-tau and 4R-tau isoforms were approximately equal, in agreement with previous studies (22). Protein levels of the smallest tau isoform, 0N3R, were significantly lower in the cerebellum (P < 0.05) compared with other brain regions, but other tau isoforms were not found to vary significantly between brain regions. We also measured 3R- and 4R-tau protein levels in the same samples using sandwich ELISA assays (17,23). Both 3R- and 4R-tau are lowest in the cerebellum and white matter reflecting total transcript levels (Supplementary Material, Fig. S2). In conclusion, whereas MAPT gene-level expression and total tau protein expression follow similar trends between brain regions, the relationship between mRNA and protein isoforms could not be determined.
The effect of the H1/H2 haplotypes on MAPT mRNA expression and splicing
Previous studies have demonstrated the effects of the H1/H2 haplotypes on MAPT mRNA expression (6,21,24,25). However, there are large numbers of haplotype-specific polymorphisms at the MAPT locus (both SNP and insertion deletion polymorphisms), some of which have only recently been identified, and since expression probes have largely been designed against the H1 haplotype, these polymorphisms may have created false expression QTL results (26). This can occur because mRNA sequences transcribed from the H2 haplotype will depart from the H1 reference, due to both the presence of different nucleotides (i.e. SNPs) and the presence or absence of nucleotides (i.e. indels), and so are likely to exhibit a weaker binding affinity for the probes in question, which are a perfect match for mRNA sequences transcribed from the H1 haplotype. This results in an apparent association between the genotype and expression, confounding eQTL studies which are looking for just such a signal. For this reason, we used the most recent release of the1000 Genomes Project (March 2012: Integrated Phase I haplotype release version 3) to identify and remove probes on the Affymetrix Exon array that map to MAPT and contain SNPs or indels with a minor allele frequency (MAF) of >1% in Europeans. This resulted in the removal of 8 of the 25 MAPT probe sets from further expression QTL analysis (see Fig. 2A for positions of probe sets). Exon-specific expression data generated from the remaining 17 probe sets (using samples from the UKBEC) were tested for association against 3547 SNPs located within ∼1 Mb of the transcription start and end site of MAPT in each brain region.
The most significant expression QTL identified was between SNP chr17:44357157 and exon 3 (Affymetrix probe set 3723712). Since this SNP is in strong LD with SNPs that tag the H1/H2 haplotypes, we used the better known H1/H2 tagging SNP, rs17665188 (R2 = 0.93 with chr17:44357157) to demonstrate the effect of the H2 haplotype on exon 3 expression (as detected by Affymetrix probe set 3723712). The H2 haplotype was associated with higher expression of exon 3 in all brain regions (aveALL P-value = 5.2 × 10⁻¹³) except white matter (Fig. 4). The most significant association was observed in the frontal cortex (P-value = 8.8 × 10⁻⁶). In contrast to the alternate splicing of exon 10, the alternate splicing of exons 2 and 3, and more specifically the role of exon 3 has not been extensively studied. However, our data refine a previous report using cell lines (27) which suggested that H2 was associated with increased inclusion of exons 2 and 3, although we do not observe the former (P > 1 × 10⁻² for all tissues for exon 2, as measured by Affymetrix probe set 3723710).
Figure 4.
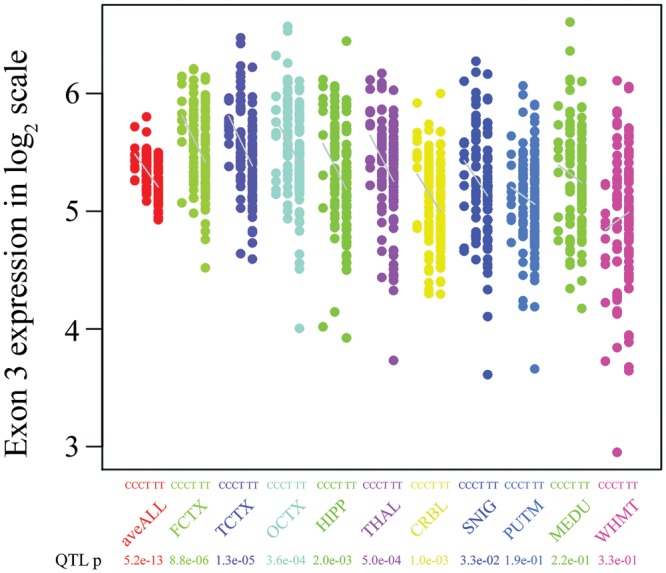
The effect of the H1/H2 haplotypes (tagged by rs17665188) on the expression of MAPT exon 3: MAPT exon 3 expression (Affymetrix probe set 3723712) stratified by genotype at rs17665188 in 134 brain samples for 10 brain regions. Increased exon 3 expression was associated with the homozygous major allele (CC). A similar association pattern was observed in all brain regions except for white matter (P = 0.03).
The effect of the H1c haplotype (tagged by rs242557) on MAPT mRNA expression
Although ideally we would have liked to determine the effect of the H1c haplotype on both MAPT mRNA expression and splicing, we were insufficiently powered to run such a conditional analysis using the available exon-specific expression data generated using the Affymetrix exon arrays (UKBEC data set). Therefore, in order to address this issue, we used expression data originating from 390 individuals (frontal the cortex and cerebellum samples only) generated by the North American Brain Expression Consortium using the Illumina HumanHT-12 v3 Expression BeadChips. This Illumina expression array contains four probes mapping to the MAPT gene, of which only two are robustly detected in human brain, ILMN_2310814 and ILMN_1710903. As previously described, in order to avoid the detection of false QTLs arising from the presence of genetic polymorphisms within the probe sequences used for MAPT mRNA expression detection, we checked both Illumina probes for SNPs and indels using the most recent release of the 1000 Genomes Project (March 2012: Integrated Phase I haplotype release version 3). This rigorous quality-control process allowed us to identify a 2bp deletion (rs67759530, MAF = 23% in Europeans) in the target sequence of Illumina probe, ILMN_1710903, specifically within the MAPT H2 haplotype.
However, removal of H2 haplotype-carrying individuals did allow us to use data generated by both MAPT probes to investigate the effects of rs242557 in the remaining 222 H1/H1 individuals. This SNP defines the H1c sub-haplotype within the H1 clade and has also been shown to be a significant risk SNP for PSP (risk allele = A, P-value = 9.5 × 10⁻¹⁸ from the relevant GWAS) (2). In fact, we found that the H1c haplotype (tagged by rs242557) was not significantly associated with increased mRNA expression of MAPT, as measured with Illumina probes ILMN_1710903 (P = 0.957 in the frontal cortex, P = 0.825 in the cerebellum) and ILMN_2310814 (P = 0.975 in the frontal cortex, P = 0.768 in the cerebellum).
DISCUSSION
This study, based on multiple analyses with a minimum of 780 brain samples used in any single analysis (originating from 390 individuals), provides the most robust and coherent information on the regional mRNA expression, splicing and regulation of MAPT available to date. Rigorous quality-control steps have been used to ensure that, in particular, the effects of the H1/H2 and H1c haplotypes on MAPT mRNA expression and splicing are as accurate as possible. Thus, we have been able to demonstrate, firstly, the significant regional variation in MAPT mRNA expression and splicing, validated using Quantigene and TaqMan assays, and secondly that at the gene-level MAPT mRNA expression and total tau protein are highly correlated. Finally and most importantly, we have shown that while the effect of the reported H1/H2 effect on MAPT mRNA gene-level expression is likely to be a technical artefact, this polymorphism is associated with the expression of exon 3-containing isoforms in human brain. These findings would suggest that contrary to the present, prevailing view genetic risk factors for neurodegenerative diseases at the MAPT locus are likely to operate by changing the balance of mRNA splicing in different brain regions, as opposed to the overall expression of the MAPT gene.
Profiling mRNA and protein expression in human brain demonstrated significant regional variation. We found that MAPT mRNA expression was 2.0-fold higher in the neocortex, when compared with white matter and cerebellum. Total tau protein expression level had a similar regional pattern of expression to that for mRNA. Since the frontal and temporal cortices are among the brain regions most affected by tangle pathology in AD, these findings support the concept that despite high ubiquitous expression of MAPT in the human brain, regional variation in basal MAPT expression might predispose some brain regions to tangle pathology and explain the regional specificity of disease in AD at least.
Analogous profiling of MAPT mRNA splicing and protein isoform expression was more complex. While we were able to demonstrate region-biased splicing of exon 2 containing mRNA isoforms and validate these findings using TaqMan assays, we were unable to replicate this observation at the protein level. The only significant regional difference in tau protein isoform expression was the reduced levels of 0N3R in the cerebellum when compared with other regions. This finding is in agreement with previous studies that have observed decreased 0N3R in the cerebellum of control (22) and PSP (28) patients. However, the absence of any clear relationship between mRNA splicing and tau protein isoform production is difficult to interpret. One possible reason for this is that altered splicing of exon 2 would be ‘shared’ across four tau protein isoforms (1N3R, 1N4R, 2N3R and 2N4R), thus a sizeable change would be needed to allow detection by a semi-quantitative technique such as western blotting.
Finally and most importantly, we investigated the effects of the H1/H2 and H1c haplotypes on MAPT mRNA expression and splicing. In the case of the former, we had sufficient statistical power to use the exon-specific and region-wide expression data provided by the UK Human Brain Expression Consortium. Thus, we were able to assess for the first time the effect of the H1/H2 inversion polymorphism on MAPT splicing, and do this in 10 brain regions (including highly clinically relevant regions such as the hippocampus and substantia nigra). These data show that the under-represented, protective H2 haplotype is associated, in all grey matter brain regions, with more expression of exon 3 and that this effect is most prominent in cortical regions. This finding is consistent with previous allele-specific expression studies (27). Interestingly, no association was seen in white matter, where in fact there was a trend in the opposite direction (P = 0.03). These data suggest that the inclusion of exon 3 in grey matter is protective in PSP, CBD and PD. Since several physiological roles for the amino-terminal inserts coded by exons 2 and 3 have been suggested, these might help explain this finding. For example, it has been suggested that the amino-terminal inserts could regulate the spacing between microtubules (29,30). Alternatively, since the amino-terminal region of tau has also been shown to interact with the plasma membrane where it can, in turn, interact with src-family kinases, it could be involved in signal transduction (31,32). Moreover, it has been recently shown that the exon 2- and 10-encoded inserts increase aggregation propensity, whereas the exon 3-encoded insert decreases aggregation (33). The latter could in part explain the protective function of H2 with its increased inclusion of exon 3. Interestingly, this function has recently been shown to be important in mediating amyloid-beta toxicity in a mouse model of AD (34).
Although we would have liked to run a similar exon-specific analysis to investigate the effects of the H1c haplotype (tagged by rs242557) on MAPT expression, the sample numbers available within the UK Human Brain Expression Consortium were insufficient (n = 74). Consequently, we used brain mRNA expression data (the frontal cortex and cerebellum) generated from the Illumina HT12-v3 Expression Beadchips and provided by the North American Brain Expression Consortium (n = 222). Using the most recent release of the 1000 Genomes project (Interim phase I haplotypes, June 2011), quality-control procedures identified a 2-bp deletion (rs67759530) in the target sequence of ILMN_1710903 within the H2 haplotype. It is now well recognized that such sequence polymorphisms can result in hybridization artefacts, which in turn cause reporting of false cis-acting expression QTLs (35,36). Since the signals produced by Illumina probe, ILMN_1710903, in mixed H1/H2 sample sets are responsible for the widely reported cis-acting MAPT expression QTL (characterized by lower expression of MAPT in H2 individuals) (6,21,24), this finding, combined with our own inability to replicate such a result using a different platform, would suggest that this gene-level mRNA expression QTL is a technical artefact. However, restricting our analysis to H1 homozygotes, we were still able to use this powerful data set to explore the impact of the H1c haplotype on gene expression. Unfortunately, this analysis did not demonstrate a significant association between the H1c haplotype (tagged by rs242557) and MAPT mRNA expression, as measured with Illumina probes ILMN_1710903 and ILMN_2310814. This does not preclude the possibility that this haplotype could effect MAPT mRNA splicing.
In summary, in this paper, we use the largest exon-specific and gene-level human brain expression data sets available to study the regional expression, splicing and regulation of MAPT mRNA. In addition, for providing valuable baseline information regarding regional differences in MAPT mRNA and protein isoform expression, we demonstrate the importance of exon-specific analyses in the study of neurodegenerative diseases. We found that the H1/H2 inversion polymorphism was associated with the expression of exon-3-containing mRNA transcripts, not gene-level expression. While recognition of this underlying complexity may complicate studies, it is a necessary complication, which may hold the key to explaining how a single locus can give rise to at least four human diseases, all with distinct clinical and pathological features.
MATERIALS AND METHODS
Collection and dissection of post-mortem human brain tissue analysed using Affymetrix Exon 1.0 ST Arrays
Brain and CNS tissue originating from 134 control individuals was collected by the Medical Research Council (MRC) Sudden Death Brain and Tissue Bank, Edinburgh, UK (37), and the Sun Health Research Institute (SHRI) an affiliate of Sun Health Corporation, USA (38). In all cases, control status was confirmed by histology performed on sections prepared from paraffin-embedded brain tissue blocks and the diagnosis was determined by a consultant neuropathologist. A detailed description of the samples used in the study, tissue processing and dissection is provided in Trabzuni et al. (20). All samples had fully informed consent for retrieval and were authorized for ethically approved scientific investigation (Research Ethics Committee number 10/H0716/3).
RNA isolation and processing of brain samples analysed using Affymetrix Exon 1.0 ST Arrays
Total RNA was isolated from human post-mortem brain tissues using the miRNeasy 96-well kit (Qiagen, UK). The quality of total RNA was evaluated by the 2100 Bioanalyzer (Agilent) and RNA 6000 Nano Kit (Agilent) before processing with the Ambion® WT Expression Kit and Affymetrix GeneChip Whole Transcript Sense Target Labeling Assay, and hybridization to the Affymetrix Exon 1.0 ST Arrays following the manufacturers' protocols. Hybridized arrays were scanned on an Affymetrix GeneChip® Scanner 3000 7G and visually inspected for hybridization artefacts. Further details regarding RNA isolation, quality control and processing are reported in Trabzuni et al. (20).
Analysis of Affymetrix Exon Array Data
All arrays were pre-processed using RMA quantile normalization with background correction and probe set summarization with median polish in Affymetrix Power Tools 1.14.3 (http://www.affymetrix.com/partners_programs/programs/developer/tools/powertools.affx). After re-mapping the Affymetrix probe sets onto human genome build 19 (GRCh37) as documented in the Netaffx annotation file (HuEx-1_0-st-v2 Probe set Annotations, Release 31), we restricted analysis to 294 943 probe sets that: (i) had gene annotation, (ii) contained at least three probes, (iii) were unaffected by SNPs both genotyped and imputed on the basis of 1000 Genomes Release (May 2011), and (iv) uniquely hybridized. Since most exons are represented by only one probe set, we used the probe set signal intensity as a synonym of exon expression level, unless explicitly mentioned. The transcript-level expression for 23 960 genes was estimated using the 90% Winsorized mean of the corresponding probe sets. Regional differences in gene-level expression and splicing were investigated using Partek's mixed-model ANOVA and alternative splicing ANOVA, which looks for a significant interaction between brain region and exon-specific expression (Partek Genomics Suite v6.6). In all analysis, we corrected for gender and batch effects [date of hybridization and brain bank), as investigated in detail (20)].
Direct RNA quantification with branched DNA, QuantiGene® 2.0 Assay
CRBL, OCTX, PUTM and WHMT samples from 12 individuals were analysed using the QuantiGene® (QG) platform for validation of exon array results. We selected RPLP0 and UBC as housekeeping genes as they showed relatively low variability in expression levels (i.e. low coefficient of variation) in all brain regions in our data set (20).
Quantitative RT–PCR
MAPT gene expression for CRBL, OCTX and WHMT was quantified by TaqMan real-time PCR (Invitrogen, UK). The MAPT transcript-specific assays used were Hs00902188, Hs00902978 and Hs00902314 (Invitrogen). Real-time quantitation was carried out on the Stratagene MX3000P system. All runs were performed in technical triplicates and were normalized to the geometric mean of three housekeeping genes, PPIA, BACT and HPRT. The relative expression values were calculated using the ΔΔCT method.
Collection, RNA isolation and processing of brain samples analysed using Illumina Human HT-12 v3 expression BeadChip arrays
Cerebellar and frontal cortex samples originating from 390 control individuals were collected as previously described (6,21,39). It is worth noting that 85 individuals had also been analysed as part of the Affymetrix exon array data set. Total RNA was extracted from sub-dissected samples (100–200 mg) of human post-mortem brain tissue using either Qiagen's miRNeasy Kit (Qiagen) or using a glass-Teflon homogenizer and 1 ml TRIzol (Invitrogen, Carlsbad, CA, USA) according to the manufacturers' instructions. RNA was biotinylated and amplified using the Illumina® TotalPrep-96 RNA Amplification Kit and directly hybridized onto HumanHT-12 v3 Expression BeadChips (Illumina Inc., USA) in accordance with the manufacturer's instructions.
Analysis of Illumina HT-12 v3 expression BeadChip Array Data
Expression data were analysed using the Gene Expression Module 3.2.7 within Illumina® BeadStudio. Raw intensity values for each probe were transformed using the cubic spline normalization method and then log2 transformed for mRNA analysis. We re-mapped the annotation for probes according to ReMOAT (40) on the human genome build 19 and then restricted the analysis to genes that were reliable, uniquely hybridized and were associated with gene descriptions. In our analysis, we used analysed data generated by the following two probes: ILMN_1710903 and ILMN_2310814.
DNA extraction, genotyping and imputation
Genomic DNA was extracted from sub-dissected samples (100–200 mg) of human post-mortem brain tissue using either Qiagen's DNeasy Tissue Kit (Qiagen) or standard phenol–chloroform DNA extraction protocol. Genotyping was performed using the Illumina Infinium Omni1-Quad BeadChip or Illumina Infinium HumanHap550 v3 (Illumina). In the case of samples analysed on the Affymetrix exon arrays, genotyping was also performed using the ImmunoChip, a custom genotyping array designed for the fine-mapping of auto-immune disorders (6). In all cases, the BeadChips were scanned using an iScan (Illumina) with an AutoLoader (Illumina). GenomeStudio v.1.8.X (Illumina) was used for analysing the data and generating SNP calls. After standard quality controls, both genotype data sets were combined and imputed using MaCH (41,42) and minimac (http://genome.sph.umich.edu/wiki/Minimac) using the 1000 Genomes (Interim phase I haplotypes, June 2011). We used the resulting ∼5.8 million SNPs with good post-imputation quality (Rsq > 0.50) and MAF of at least 5% in subsequent analyses. The selection of individuals with the H1/H1 status was based on SNPs rs1800547 and rs1052553.
Expression QTL analysis
We tested the association between given SNPs and expression profiles using the R package MatrixEQTL (http://www.bios.unc.edu/research/genomic_software/Matrix_eQTL/) and Revolution R (43). We assumed an additive genetic model for each SNP (1 degree-of-freedom trend test) without additional covariates.
Protein extraction and western blot analysis
Brain tissue was homogenized in 10 mm Tris–HCl (pH 7.4), 0.8 m NaCl, 1 mm EDTA, 10% sucrose and protease inhibitor tablets (Roche). Homogenates were clarified by centrifugation at 10 000g (av) for 10 min at 4°C prior to aliquoting and storage at −80°C. Protein concentrations were measured by BCA assay and equal amounts of protein were dephosphorylated using λ protein phosphatase (NEB) as described previously (44). Briefly, proteins were incubated with λ protein phosphatase at a final concentration of 40 U/μl for 3 h at 30°C. Dephosphorylation reactions were stopped by the addition of LDS buffer (Invitrogen) followed by heating at 100°C for 10 min. Samples were centrifuged at 10 000g (av) prior to separation on 10% Bis–Tris gels alongside recombinant tau protein ladder (Sigma). Proteins were transferred to nitrocellulose membrane and probed with rabbit polyclonal antibody to total tau (DAKO) and mouse monoclonal to actin (Sigma). Blots were visualized and quantified using an Odyssey Infrared imaging system (LI-COR Biosciences). The levels of total tau in each brain region were normalized to actin, and the levels of individual tau isoforms were calculated as a percentage of total tau for the same sample.
Tau isoform sandwich ELISA
Sandwich ELISAs for 3R- and 4R-tau were carried out as previously described (17). Briefly, microtitre plates were coated with 150 μl of 10 μg ml−1 of capture antibody (RD3 or RD4) (45) in coating buffer (150 μl, sodium tetraborate buffer, pH 9.4). The plate was washed and 150 μl of diluent buffer was added into the plate after which 25 μl of diluted supernatants obtained from the brain homogenates (1 in 1000 and 1 in 150 for 3R- and 4R-tau ELISAs, respectively) were added in duplicates to the blocked plates previously coated with RD3 or RD4 antibodies. The plates were incubated at RT for 2 h, washed and 150 μl affinity-purified sheep anti-tau-HRP conjugates, diluted to 1 in 1000 and 1 in 3500 for 3R- and 4R-tau assays, was added, respectively, and incubated for 1 h on a shaker. After washing, the plates were developed with tetramethylbenzidine substrate as previously described. The isoform composition in each sampled region is expressed as ng per mg of total brain protein.
SUPPLEMENTARY MATERIAL
FUNDING
This work was supported by the MRC through the MRC Sudden Death Brain Bank (C.S.) and by a Project Grant (G0901254 to J.H. and M.W.), Training Fellowship (G0802462 to M.R.) and a Research Grant (G0501560 to R.d.S.). This project was further supported by the Cure PSP, Irene and Abe Pollin Fund for CBD Research (R.d.S. and J.H.). D.T. was supported by the King Faisal Specialist Hospital and Research Centre, Saudi Arabia. S.W. is funded by an Alzheimer's Research UK research fellowship.
The work performed by the North American Brain Expression Consortium was supported in part by the Intramural Research Program of the National Institute on Aging, National Institutes of Health, part of the US Department of Health and Human Services; project number ZIA AG000932-04.
The funders had no role in study design, data collection and analysis, decision to publish or preparation of the manuscript. Funding to pay the Open Access publication charges for this article was provided by Medical Research Council UK.
Supplementary Material
ACKNOWLEDGEMENTS
We would like to thank AROS Applied Biotechnology AS company laboratories and Affymetrix for their valuable input. We are grateful to Professor Tamas Revesz for his helpful advice on tau pathology distribution.
Conflict of Interest statement: R.d.S. has licensed the RD3 and RD4 antibodies to Millipore/Upstate. The authors have no other potential conflicting financial, personal or professional interests.
REFERENCES
- 1.Baker M., Litvan I., Houlden H., Adamson J., Dickson D., Perez-Tur J., Hardy J., Lynch T., Bigio E., Hutton M. Association of an extended haplotype in the tau gene with progressive supranuclear palsy. Hum. Mol. Genet. 1999;8:711–715. doi: 10.1093/hmg/8.4.711. [DOI] [PubMed] [Google Scholar]
- 2.Hoglinger G.U., Melhem N.M., Dickson D.W., Sleiman P.M., Wang L.S., Klei L., Rademakers R., de Silva R., Litvan I., Riley D.E., et al. Identification of common variants influencing risk of the tauopathy progressive supranuclear palsy. Nat. Genet. 2011;43:699–705. doi: 10.1038/ng.859. [DOI] [PMC free article] [PubMed] [Google Scholar]
- 3.Houlden H., Baker M., Morris H.R., MacDonald N., Pickering-Brown S., Adamson J., Lees A.J., Rossor M.N., Quinn N.P., Kertesz A., et al. Corticobasal degeneration and progressive supranuclear palsy share a common tau haplotype. Neurology. 2001;56:1702–1706. doi: 10.1212/wnl.56.12.1702. [DOI] [PubMed] [Google Scholar]
- 4.Golbe L.I., Lazzarini A.M., Spychala J.R., Johnson W.G., Stenroos E.S., Mark M.H., Sage J.I. The tau A0 allele in Parkinson's disease. Mov. Disord. 2001;16:442–447. doi: 10.1002/mds.1087. [DOI] [PubMed] [Google Scholar]
- 5.Lill C.M., Roehr J.T., McQueen M.B., Kavvoura F.K., Bagade S., Schjeide B.M., Schjeide L.M., Meissner E., Zauft U., Allen N.C., et al. Comprehensive research synopsis and systematic meta-analyses in Parkinson's disease genetics: the PDGene Database. PLoS Genet. 2012;8:e1002548. doi: 10.1371/journal.pgen.1002548. [DOI] [PMC free article] [PubMed] [Google Scholar]
- 6.Nalls M.A., Plagnol V., Hernandez D.G., Sharma M., Sheerin U.M., Saad M., Simon-Sanchez J., Schulte C., Lesage S., Sveinbjornsdottir S., et al. Imputation of sequence variants for identification of genetic risks for Parkinson's disease: a meta-analysis of genome-wide association studies. Lancet. 2011;377:641–649. doi: 10.1016/S0140-6736(10)62345-8. [DOI] [PMC free article] [PubMed] [Google Scholar]
- 7.Gerrish A., Russo G., Richards A., Moskvina V., Ivanov D., Harold D., Sims R., Abraham R., Hollingworth P., Chapman J., et al. The role of variation at AbetaPP, PSEN1, PSEN2, and MAPT in late onset Alzheimer's disease. J. Alzheimers Dis. 2012;28:377–387. doi: 10.3233/JAD-2011-110824. [DOI] [PMC free article] [PubMed] [Google Scholar]
- 8.Myers A.J., Kaleem M., Marlowe L., Pittman A.M., Lees A.J., Fung H.C., Duckworth J., Leung D., Gibson A., Morris C.M., et al. The H1c haplotype at the MAPT locus is associated with Alzheimer's disease. Hum. Mol. Genet. 2005;14:2399–2404. doi: 10.1093/hmg/ddi241. [DOI] [PubMed] [Google Scholar]
- 9.Stefansson H., Helgason A., Thorleifsson G., Steinthorsdottir V., Masson G., Barnard J., Baker A., Jonasdottir A., Ingason A., Gudnadottir V.G., et al. A common inversion under selection in Europeans. Nat. Genet. 2005;37:129–137. doi: 10.1038/ng1508. [DOI] [PubMed] [Google Scholar]
- 10.Goedert M., Spillantini M.G., Jakes R., Rutherford D., Crowther R.A. Multiple isoforms of human microtubule-associated protein tau: sequences and localization in neurofibrillary tangles of Alzheimer's disease. Neuron. 1989;3:519–526. doi: 10.1016/0896-6273(89)90210-9. [DOI] [PubMed] [Google Scholar]
- 11.Goedert M., Spillantini M.G., Potier M.C., Ulrich J., Crowther R.A. Cloning and sequencing of the cDNA encoding an isoform of microtubule-associated protein tau containing four tandem repeats: differential expression of tau protein mRNAs in human brain. EMBO J. 1989;8:393–399. doi: 10.1002/j.1460-2075.1989.tb03390.x. [DOI] [PMC free article] [PubMed] [Google Scholar]
- 12.Zody M.C., Jiang Z., Fung H.C., Antonacci F., Hillier L.W., Cardone M.F., Graves T.A., Kidd J.M., Cheng Z., Abouelleil A., et al. Evolutionary toggling of the MAPT 17q21.31 inversion region. Nat. Genet. 2008;40:1076–1083. doi: 10.1038/ng.193. [DOI] [PMC free article] [PubMed] [Google Scholar]
- 13.Pittman A.M., Myers A.J., Duckworth J., Bryden L., Hanson M., Abou-Sleiman P., Wood N.W., Hardy J., Lees A., de Silva R. The structure of the tau haplotype in controls and in progressive supranuclear palsy. Hum. Mol. Genet. 2004;13:1267–1274. doi: 10.1093/hmg/ddh138. [DOI] [PubMed] [Google Scholar]
- 14.Fung H.C., Evans J., Evans W., Duckworth J., Pittman A., de Silva R., Myers A., Hardy J. The architecture of the tau haplotype block in different ethnicities. Neurosci. Lett. 2005;377:81–84. doi: 10.1016/j.neulet.2004.11.072. [DOI] [PubMed] [Google Scholar]
- 15.Pittman A.M., Myers A.J., Abou-Sleiman P., Fung H.C., Kaleem M., Marlowe L., Duckworth J., Leung D., Williams D., Kilford L., et al. Linkage disequilibrium fine mapping and haplotype association analysis of the tau gene in progressive supranuclear palsy and corticobasal degeneration. J. Med. Genet. 2005;42:837–846. doi: 10.1136/jmg.2005.031377. [DOI] [PMC free article] [PubMed] [Google Scholar]
- 16.Feany M.B., Mattiace L.A., Dickson D.W. Neuropathologic overlap of progressive supranuclear palsy, Pick's disease and corticobasal degeneration. J. Neuropathol. Exp. Neurol. 1996;55:53–67. doi: 10.1097/00005072-199601000-00006. [DOI] [PubMed] [Google Scholar]
- 17.Luk C., Giovannoni G., Williams D.R., Lees A.J., de Silva R. Development of a sensitive ELISA for quantification of three- and four-repeat tau isoforms in tauopathies. J. Neurosci. Methods. 2009;180:34–42. doi: 10.1016/j.jneumeth.2009.02.015. [DOI] [PubMed] [Google Scholar]
- 18.Goedert M. Tau protein and neurodegeneration. Semin. Cell Dev. Biol. 2004;15:45–49. doi: 10.1016/j.semcdb.2003.12.015. [DOI] [PubMed] [Google Scholar]
- 19.Sergeant N., Wattez A., Delacourte A. Neurofibrillary degeneration in progressive supranuclear palsy and corticobasal degeneration: tau pathologies with exclusively ‘exon 10’ isoforms. J. Neurochem. 1999;72:1243–1249. doi: 10.1046/j.1471-4159.1999.0721243.x. [DOI] [PubMed] [Google Scholar]
- 20.Trabzuni D., Ryten M., Walker R., Smith C., Imran S., Ramasamy A., Weale M.E., Hardy J. Quality control parameters on a large dataset of regionally dissected human control brains for whole genome expression studies. J. Neurochem. 2011;119:275–282. doi: 10.1111/j.1471-4159.2011.07432.x. [DOI] [PMC free article] [PubMed] [Google Scholar]
- 21.Gibbs J.R., van der Brug M.P., Hernandez D.G., Traynor B.J., Nalls M.A., Lai S.L., Arepalli S., Dillman A., Rafferty I.P., Troncoso J., et al. Abundant quantitative trait loci exist for DNA methylation and gene expression in human brain. PLoS Genet. 2010;6:e1000952. doi: 10.1371/journal.pgen.1000952. [DOI] [PMC free article] [PubMed] [Google Scholar]
- 22.Boutajangout A., Boom A., Leroy K., Brion J.P. Expression of tau mRNA and soluble tau isoforms in affected and non-affected brain areas in Alzheimer's disease. FEBS Lett. 2004;576:183–189. doi: 10.1016/j.febslet.2004.09.011. [DOI] [PubMed] [Google Scholar]
- 23.Luk C., Vandrovcova J., Malzer E., Lees A., de Silva R. Brain tau isoform mRNA and protein correlation in PSP brain. Trans. Neurosci. 2010;1:30–36. [Google Scholar]
- 24.Myers A.J., Gibbs J.R., Webster J.A., Rohrer K., Zhao A., Marlowe L., Kaleem M., Leung D., Bryden L., Nath P., et al. A survey of genetic human cortical gene expression. Nat. Genet. 2007;39:1494–1499. doi: 10.1038/ng.2007.16. [DOI] [PubMed] [Google Scholar]
- 25.Myers A.J., Pittman A.M., Zhao A.S., Rohrer K., Kaleem M., Marlowe L., Lees A., Leung D., McKeith I.G., Perry R.H., et al. The MAPT H1c risk haplotype is associated with increased expression of tau and especially of 4 repeat containing transcripts. Neurobiol. Dis. 2007;25:561–570. doi: 10.1016/j.nbd.2006.10.018. [DOI] [PubMed] [Google Scholar]
- 26.Naiser T., Ehler O., Kayser J., Mai T., Michel W., Ott A. Impact of point-mutations on the hybridization affinity of surface-bound DNA/DNA and RNA/DNA oligonucleotide-duplexes: comparison of single base mismatches and base bulges. BMC Biotechnol. 2008;8:48. doi: 10.1186/1472-6750-8-48. [DOI] [PMC free article] [PubMed] [Google Scholar]
- 27.Caffrey T.M., Joachim C., Wade-Martins R. Haplotype-specific expression of the N-terminal exons 2 and 3 at the human MAPT locus. Neurobiol. Aging. 2008;29:1923–1929. doi: 10.1016/j.neurobiolaging.2007.05.002. [DOI] [PMC free article] [PubMed] [Google Scholar]
- 28.Gibb G.M., de Silva R., Revesz T., Lees A.J., Anderton B.H., Hanger D.P. Differential involvement and heterogeneous phosphorylation of tau isoforms in progressive supranuclear palsy. Brain Res. Mol. Brain Res. 2004;121:95–101. doi: 10.1016/j.molbrainres.2003.11.007. [DOI] [PubMed] [Google Scholar]
- 29.Chen J., Kanai Y., Cowan N.J., Hirokawa N. Projection domains of MAP2 and tau determine spacings between microtubules in dendrites and axons. Nature. 1992;360:674–677. doi: 10.1038/360674a0. [DOI] [PubMed] [Google Scholar]
- 30.Frappier T.F., Georgieff I.S., Brown K., Shelanski M.L. tau Regulation of microtubule-microtubule spacing and bundling. J. Neurochem. 1994;63:2288–2294. doi: 10.1046/j.1471-4159.1994.63062288.x. [DOI] [PubMed] [Google Scholar]
- 31.Lee G. Tau and src family tyrosine kinases. Biochim. Biophys. Acta. 2005;1739:323–330. doi: 10.1016/j.bbadis.2004.09.002. [DOI] [PubMed] [Google Scholar]
- 32.Lee G., Newman S.T., Gard D.L., Band H., Panchamoorthy G. Tau interacts with src-family non-receptor tyrosine kinases. J. Cell Sci. 1998;111:3167–3177. doi: 10.1242/jcs.111.21.3167. [DOI] [PubMed] [Google Scholar]
- 33.Zhong Q., Congdon E.E., Nagaraja H.N., Kuret J. Tau isoform composition influences the rate and extent of filament formation. J Biol Chem. 2012;287:20711–20719. doi: 10.1074/jbc.M112.364067. [DOI] [PMC free article] [PubMed] [Google Scholar]
- 34.Ittner L.M., Ke Y.D., Delerue F., Bi M., Gladbach A., van E.J., Wolfing H., Chieng B.C., Christie M.J., Napier I.A., et al. Dendritic function of tau mediates amyloid-beta toxicity in Alzheimer's disease mouse models. Cell. 2010;142:387–397. doi: 10.1016/j.cell.2010.06.036. [DOI] [PubMed] [Google Scholar]
- 35.Benovoy D., Kwan T., Majewski J. Effect of polymorphisms within probe-target sequences on olignonucleotide microarray experiments. Nucleic Acids Res. 2008;36:4417–4423. doi: 10.1093/nar/gkn409. [DOI] [PMC free article] [PubMed] [Google Scholar]
- 36.Alberts R., Terpstra P., Li Y., Breitling R., Nap J.-P., Jansen R.C. Sequence polymorphisms cause many false cis eQTLs. PLoS ONE. 2007;2:e622. doi: 10.1371/journal.pone.0000622. [DOI] [PMC free article] [PubMed] [Google Scholar]
- 37.Millar T., Walker R., Arango J.C., Ironside J.W., Harrison D.J., MacIntyre D.J., Blackwood D., Smith C., Bell J.E. Tissue and organ donation for research in forensic pathology: the MRC Sudden Death Brain and Tissue Bank. J. Pathol. 2007;213:369–375. doi: 10.1002/path.2247. [DOI] [PubMed] [Google Scholar]
- 38.Beach T.G., Sue L.I., Walker D.G., Roher A.E., Lue L., Vedders L., Connor D.J., Sabbagh M.N., Rogers J. The Sun Health Research Institute Brain Donation Program: description and experience, 1987–2007. Cell Tissue Bank. 2008;9:229–245. doi: 10.1007/s10561-008-9067-2. [DOI] [PMC free article] [PubMed] [Google Scholar]
- 39.Hernandez D.G., Nalls M.A., Moore M., Chong S., Dillman A., Trabzuni D., Gibbs J.R., Ryten M., Arepalli S., Weale M.E., et al. Integration of GWAS SNPs and tissue specific expression profiling reveal discrete eQTLs for human traits in blood and brain. Neurobiol. Dis. 2012;47:20–28. doi: 10.1016/j.nbd.2012.03.020. [DOI] [PMC free article] [PubMed] [Google Scholar]
- 40.Barbosa-Morais N.L., Dunning M.J., Samarajiwa S.A., Darot J.F., Ritchie M.E., Lynch A.G., Tavare S. A re-annotation pipeline for Illumina BeadArrays: improving the interpretation of gene expression data. Nucleic Acids Res. 2010;38:e17. doi: 10.1093/nar/gkp942. [DOI] [PMC free article] [PubMed] [Google Scholar]
- 41.Li Y., Willer C., Sanna S., Abecasis G. Genotype imputation. Annu. Rev. Genomics Hum. Genet. 2009;10:387–406. doi: 10.1146/annurev.genom.9.081307.164242. [DOI] [PMC free article] [PubMed] [Google Scholar]
- 42.Li Y., Willer C.J., Ding J., Scheet P., Abecasis G.R. MaCH: using sequence and genotype data to estimate haplotypes and unobserved genotypes. Genet. Epidemiol. 2010;34:816–834. doi: 10.1002/gepi.20533. [DOI] [PMC free article] [PubMed] [Google Scholar]
- 43.RDC-Team. RDC Team (R Development Core Team). R: A Language and Environment for Statistical Computing. Vienna, Austria: R Foundation for Statistical Computing; 2011. [Google Scholar]
- 44.Hanger D.P., Gibb G.M., de Silva R., Boutajangout A., Brion J.P., Revesz T., Lees A.J., Anderton B.H. The complex relationship between soluble and insoluble tau in tauopathies revealed by efficient dephosphorylation and specific antibodies. FEBS Lett. 2002;531:538–542. doi: 10.1016/s0014-5793(02)03611-6. [DOI] [PubMed] [Google Scholar]
- 45.de Silva R., Lashley T., Gibb G., Hanger D., Hope A., Reid A., Bandopadhyay R., Utton M., Strand C., Jowett T., et al. Pathological inclusion bodies in tauopathies contain distinct complements of tau with three or four microtubule-binding repeat domains as demonstrated by new specific monoclonal antibodies. Neuropathol. Appl. Neurobiol. 2003;29:288–302. doi: 10.1046/j.1365-2990.2003.00463.x. [DOI] [PubMed] [Google Scholar]
- 46.Dickson D.W., Hauw J.-J., Agid Y., Litvan I. Neurodegeneration: The Molecular Pathology of Dementia and Movement Disorders. Wiley-Blackwell; 2011. pp. 135–155. [Google Scholar]
- 47.Braak H., Braak E. Neuropathological staging of Alzheimer-related changes. Acta Neuropathol. 1991;82:239–259. doi: 10.1007/BF00308809. [DOI] [PubMed] [Google Scholar]
- 48.Compta Y., Parkkinen L., O'Sullivan S.S., Vandrovcova J., Holton J.L., Collins C., Lashley T., Kallis C., Williams D.R., de Silva R., et al. Lewy- and Alzheimer-type pathologies in Parkinson's disease dementia: which is more important? Brain. 2011;134:1493–1505. doi: 10.1093/brain/awr031. [DOI] [PMC free article] [PubMed] [Google Scholar]
Associated Data
This section collects any data citations, data availability statements, or supplementary materials included in this article.