

Abstract
Objectives
Use three-dimensional (3D) facial laser scanned images from children with fetal alcohol syndrome (FAS) and controls to develop an automated diagnosis technique that can reliably and accurately identify individuals prenatally exposed to alcohol.
Methods
A detailed dysmorphology evaluation, history of prenatal alcohol exposure, and 3D facial laser scans were obtained from 149 individuals (86 FAS; 63 Control) recruited from two study sites (Cape Town, South Africa and Helsinki, Finland). Computer graphics, machine learning, and pattern recognition techniques were used to automatically identify a set of facial features that best discriminated individuals with FAS from controls in each sample.
Results
An automated feature detection and analysis technique was developed and applied to the two study populations. A unique set of facial regions and features were identified for each population that accurately discriminated FAS and control faces without any human intervention.
Conclusion
Our results demonstrate that computer algorithms can be used to automatically detect facial features that can discriminate FAS and control faces.
Keywords: fetal alcohol syndrome, geometric feature extraction, image analysis, machine learning, pattern classification
Introduction
Prenatal alcohol exposure is one of the most common non-hereditary causes of mental retardation in the Western world. The adverse effects of alcohol on the developing humans represent a broad spectrum of effects, collectively termed fetal alcohol spectrum disorders (FASD). Fetal alcohol syndrome (FAS) is a subset of FASD and is defined by recognizable facial dysmorphology, growth deficits, and cognitive and behavioral problems. FAS lies at one end of the FASD spectrum, whereas alcohol-related neurodevelopmental disorder defined as neurobehavioral impairment associated with prenatal alcohol exposure in patients having apparent normal growth and structural development, falls toward the other end (1–3).
It is estimated that the prevalence of FAS in the general US population is between 0.5 and 2.0 per 1000 live births and FASD is 10 per 1000 live births (4). Importantly, studies outside the United States have found even higher prevalence in particular geographic regions. For example, in the Western Cape Province of the South Africa the prevalence of FASD was estimated to be 68 to 89 per 1000 in first grade school children (5) and 39.2 to 46.4 using the Hoyme et al. diagnostic classifications (3).
Individuals with FAS are identifiable because they typically present with growth deficiency, structural abnormalities of the central nervous system and / or neurobehavioral deficits as well as a pattern of minor facial anomalies including short palpebral fissures, smooth philtrum, thin vermilion border of the upper lip, and midfacial hypoplasia (6). The ongoing clinical challenge for the last three decades has been to expand the recognizable phenotype so that individuals suffering from less readily recognized effects of intrauterine alcohol exposure can be identified. As mentioned, this group may be 10 times as large as the FAS group (7, 8).
Although facial changes are required for the diagnosis of FAS, neurobehavioral deficits occur in children with or without these cardinal features. Overall, deficits are worse in dysmorphic than non-dysmorphic children but many studies have reported no significant differences between these groups in neuropsychological functioning (9, 10). Specific functional profiles are being sought to aid diagnosis of affected individuals along the spectrum of FASD. Currently, physical features are used to identify children with FAS, but even in dysmorphic individuals, clinical expertise is still poor (11, 12). Adding to the difficulty in diagnosing FASD is the fact that the relevant phenotype is known to change as the child grows to adulthood (13) and there are likely to be population or ethnic differences in the expression of the facial features associated with the syndrome (14, 15). Therefore, many children with FASD may not be diagnosed until they are older and they miss out on important early interventions. Except for severe FAS cases, the best time considered to diagnose is at age of five. However, the diagnosis becomes difficult during adolescence and in adulthood. Although no known interventions have been shown to change the course of FAS like other syndromes, the children do benefit from special programs and education.
Given that the effective management of FASD is dependent on the timely and reliable diagnosis of affected individuals, there is a need for newer techniques, which in combination with a clinician’s assessment would provide rapid and accurate pre-screening and early diagnosis of children suffering from the effects of prenatal alcohol exposure. Three-dimensional (3D) technologies offer the unique opportunity to develop novel image analysis techniques to objectively identify the facial features. We proposed that this technique may be helpful in identifying patients with FAS and a wider range of FASD patients. For example, automated diagnostic techniques can be readily applied to 3D data and provide a quantitative model for distinguishing individuals with FAS from controls. More importantly, this could lead to an objective model for identifying children with FASD – which would be beneficial, both for clinical and scientific reasons. In addition, these automated techniques could be readily adapted for telemedicine applications, particularly in situations where clinical expertise is lacking and travel to and from specialized centers is limited. Using this automatic technique, pre-screening can be performed remotely with little effort and expertise required.
Several techniques can be employed in automated facial feature analyses. The traditional and most common approach is to extract surface data (typically, polygon mesh surface representation) from volumetric images such as computerized tomography and magnetic resonance imaging (16, 17). However, volumetric scans are expensive, non-portable, and often invasive. We propose a new solution of combining facial features analysis with 3D laser scanning technology. 3D laser scanning captures images that contain detailed surface geometry (polygon mesh) and texture information. This technology has become more tenable as the equipment to collect the images has become less expensive, faster, more portable, and the resulting image has gained high resolution. Many of the newest models of laser scanners are eye safe, which is essential for human studies, particularly with infants and children.
As facial features are necessary for diagnosing FAS, this syndrome is an ideal model to use for the development and testing of novel automated 3D facial feature analysis. Our approach uses the polygon mesh surfaces of 3D facial scans of children with FAS and non-FAS to develop and test an automated feature detection and classification model. The goal of our study was to develop a computational model that can automatically compute facial features from 3D scans and use this data to accurately identify children with FAS.
Methods
Data collection
Data for this study were collected as part of an ongoing international consortium, Collaborative Initiative on Fetal Alcohol Spectrum Disorders (CIFASD). One hundred and forty nine participants from two sites: Cape Town, South Africa and Helsinki, Finland were included in this study, among which 82 (50 FAS, 32 controls) were from Finland and 67 (36 FAS, 31 controls) were from Cape Town. This study was approved by the Institutional Review Board at each site and at the grantee institutions (Indiana University School of Medicine, Wayne State University School of Medicine, University of Cape Town Faculty of Health Sciences, San Diego State University, and Hospital District of Helsinki and Uusimaa, Hospital for Children and Adolescents, Helsinki, Finland). Either the participants or their parent(s) / legal guardian(s) provided written informed consent.
As part of the study visit, each participant was examined by one or two members of the CIFASD Dysmorphology Core, who completed a standardized, uniform assessment as described by Jones et al. (11). The majority (86%) of the subjects from South Africa was examined independently by two dysmorphologists and the remainder were seen by only one. In Finland, the majority (73%) of the subjects was seen by only one dysmorphologist and the remainder were seen by two. In those rare instances when the dysmorphologists did not agree in their diagnosis, the two dysmorphologists discussed the case to reach an agreement for a final diagnosis. Particular care was taken to exclude patients with a recognizable craniofacial syndrome other than FAS. An objective classification system solely on the basis of structural features (palpebral fissure, philtrum, and vermillion border) and growth deficiency (head size and height and / or weight) consistent with the revised Institute of Medicine criteria (3) was used to determine preliminary diagnosis. Under this scheme, a participant could receive a preliminary diagnosis of FAS, no FAS, or deferred (11). Alcohol exposure data were collected through a standard questionnaire consisting of four questions. Collection took place at the interview or from a review of available study data. The extent of reported prenatal alcohol exposure information was then classified into one of three categories: none, minimal, and greater than minimal. Only individuals designated as FAS with prenatal alcohol exposure (minimal or greater than minimal) and subjects classified as no FAS with no prenatal alcohol exposure were included in this study. Individuals designated as no FAS also did not have evidence of growth deficiency or any of the key facial features associated with FAS. To provide the greatest power for discrimination, this study only included in the analyses participants designated as either FAS or no FAS. The no FAS participants served as study controls. Race and ethnicity were reported by the participant or the parent/guardian as part of the study visit. As analyses focused on population differences only participants reporting themselves to be either Finnish Caucasian (FC) or Cape-colored (CC) were included in the analysis. Analyses were performed in each of the two ethnic groups separately as well as in a combined group.
A standard protocol was employed to collect 3D facial images at the two study sites using the same type of Minolta Vivid 910 laser scanners (Konica Minolta Sensing Americas, Inc., Ramsey, NJ, USA). Each participant was seated approximately 660 mm from the scanner and six scans were collected: two frontal, two 45° to the right of the frontal axis, and two 45° to the left of the frontal axis. The three views ensured that the entire facial area was covered and the repeat scans allowed for the selection of the best set of views. The total scan time for each image was approximately 0.6 s. A semi-automatic stitching process using a commercially available software package, RAPIDFORM™ 2004 (INUS Technology Incorporated, Seoul, Korea) was then applied to merge the best scans of each of the three views into one single 3D surface image.
Facial feature analysis
For this study, we developed a novel automated facial feature analysis technique that compared mathematically defined surface features within selected regions of FAS and control faces and then extracted a subset of these features that yielded the most discriminatory power to identify the FAS subjects (Fig. 1). Initially, the FAS and control faces were aligned so that corresponding features across different faces could be easily identified and compared. An initial set of features was computed using geometric feature computation algorithms and simple statistical evaluation. Then, pattern recognition and machine learning algorithms were applied to the initial feature set to generate the optimal diagnostic features and classifiers that best discriminated the FAS and control faces.
Fig. 1.
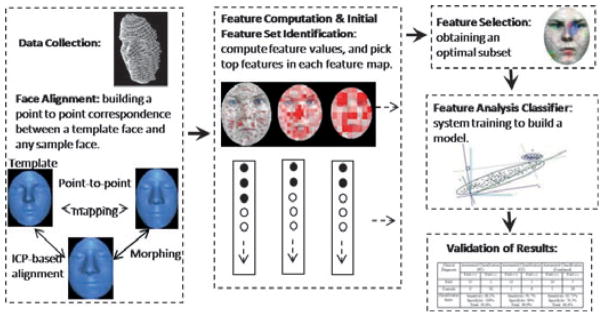
An overview of the 3D face analysis method.
Face alignment
Each participant’s face dataset was represented as one single polygon mesh surface consisting of a set of polygons (usually triangles) connected like a mesh to form a surface (see Fig. 1). To properly compare 3D facial images and their features, all scans were precisely aligned in a common coordinate system. This ensured that features (e.g. points, lines, and regions) defined on one face (e.g. a standard face dataset) could be properly and accurately mapped to the same features on all other faces so that a one-to-one correspondence was automatically established. The alignment was carried out by first defining a template face and then aligning each new dataset with the template face. The template face is a standard face dataset usually selected randomly from the control group, which we used as a common platform to define and register facial features.
The alignment defined the correspondence of facial features on different faces by mapping a feature on the template face to any other face that had been aligned with the template. The basic idea of the alignment algorithm is to gradually adjust the orientation and position of the face dataset so as to minimize the total distance between the face dataset and the template face. We employed a popular and highly effective solution, Iterative Closest Point (ICP) algorithm (18, 19) which computes the optimal geometric transformation of the dataset to match the template face by iteratively finding a local minimum of a mean-square distance metric.
Because of size and shape differences between faces, ICP-based alignment can lead to the misalignment of certain local features. To avoid local feature misalignment, we applied an additional morphing process by interpolating a set of feature landmarks to generate a morphed intermediate face between the template face and the aligned faces. The feature landmarks were prominent and easily identifiable points on the face (e.g. the corners of the eyes) and were manually selected on both the template face and the aligned face. The template face was then morphed into the aligned face by interpolating their corresponding landmark points. The morphing was implemented using the Hardy’s scattered data interpolation function (20, 21).
The morphed face served as an intermediate step in building a feature-preserving correspondence between points across different faces. This alignment process builds a correspondence function that maps a vertex on the template face to a point on an aligned face. This allowed us to define features (e.g. regions) on the template face, which could then be automatically mapped to all other face datasets and enabled us to compute features for a large number of face datasets automatically.
Feature computation
Feature values were defined and computed within facial regions. A facial region is defined as a surface area of the face represented by closed boundary lines. A region can first be defined on the template face, and then mapped to each sample face where features were computed. Here, feature computation refers to the definition and computation of feature values (or measurements) of each region. Many measurements (such as curvatures and moments of inertia, etc.) can be computed for a given region to represent the geometric properties and shape information of the surface within the region. For our study, four feature measurements were computed within each region: Area, Aspect Ratio, Flatness, and Curvatures.
Area: It measures the surface area of the region. Because a region on a face is defined by its mapping to the corresponding region on the template face through an intermediate morphed face, the differences in areas of various regions reflect the shape differences (primarily in size) of the faces in a given facial region.
Aspect Ratio: It measures the ratio of the width to the height of a region. Similar to ‘area’, differences in aspect ratio reflect shape differences.
Flatness: It measure show flat the surface is within the region. It can be computed by fitting a planar surface to the region using a least square minimization.
Curvatures: Curvatures measure the local curving of the surface at each point within a region. The average curvatures for all points in a region provide information about the shape variation within the region. For polygon mesh surfaces, curvatures are computed using discrete differential geometry operators (22). Two typical types of curvatures were computed: Gaussian curvature κG = κ1 × κ2 and Mean Curvature κH = (κ1 + κ2)/2, where κ1 and κ2 are called Principal Curvatures representing the maximum and minimum curvatures, and the directions in which these two curvatures are defined are called principal directions.
The features computed over the selected regions formed a feature vector which was then further filtered and analyzed to establish the diagnostic feature set.
Initial feature set identification
To successfully identify a reliable set of features to discriminate individuals with FAS from controls, it was essential to start with a larger set of potential features which were evaluated and their number reduced as part of the system training process. As our features were defined with respect to regions, we first needed to derive a way to systematically generate and evaluate various regions on a face. This was carried out by subdividing the face into uniform grids of several different sizes and then computing the four feature measurements within each grid area. By evaluating the ability of the feature measurements within each grid area to separate FAS and control faces, we found the best combination of neighboring grid areas to form optimal regions (consisting of potentially multiple grid areas) which discriminated FAS and control subjects.
To identify the initial feature set to be used in the system training process, we first computed a likelihood value at each point on the face that measured the overall difference between the FAS and control groups in terms of given feature values at this point. We defined a feature as a pair (r,v), where r is a region defined on a face surface and v is a quantity (measurement, statistics, etc.) computed within region r that represented a given geometric property of the region. We call v a feature value. For a given initial region r, k types of feature values can be computed:
For a set of pre-defined regions, the feature selection process determined a set of optimal pairs, {(ri,vj)}, that had the best discriminatory power between the FAS and control groups.
A feature map is a visualization of a color-coded face representing the ‘feature differences’ with respect to a given type of feature value (curvature, moment, etc.). If there are k types of feature values, k feature maps can be generated. The feature values in each feature map were computed within individual regular regions that were generated by a uniform subdivision of the face at a given resolution. Therefore, a feature map could be visualized in different resolutions, i.e. different sizes of regular regions. The use of different sizes of regions was important as feature values in a neighborhood of smaller regions do not necessarily reflect the feature value of the combined larger region. The ‘feature difference ’ represented the mean difference of feature values in a given region between two groups. The visualization allowed the user to examine the regions or areas of the face that exhibited the greatest differences between the two groups. The ‘feature difference’ value was computed using a T-value. The correspondence function mapped a region onto each facial image and the feature value was computed for all faces. The ‘difference’ was defined by the T-value:
where V̄1 and V̄2 were the means of the feature values in the region over the FAS and control groups, respectively, and s1 and s2 were their respective SDs.
There are several advantages in the selection of regions rather than individual points with high T-values. First, the correspondence across different datasets is not accurate up to the single point level. Therefore, automatically generated point features are generally not very reliable because of the inaccuracy of the feature mappings. Only when these points form a concentrated region, can we be reasonably sure that such a concentration is significant. Second, human vision is more sensitive to concentrated regions than scattered point patterns, so regions are an easier and more reliable unit for user interaction. Third, it is easier to interpret biologically the meaning of regional rather than point differences.
Feature selection
A systematic approach was employed to generate the initial set of features for feature analysis. We computed on each face a set of all possible features, {( , vj)}, where m indicated the different resolutions of region subdivision, i represented the list of all regions at a given resolution, and j represented the different types of feature values computed in each region. As these features needed to be defined and computed as corresponding feature vectors across all sample faces, we used the template face to define the base feature vector. For each face, the distance map was applied to find the corresponding regions.
The T-value of a feature represents a measure of ‘difference’ of this feature with respect to the given two groups of datasets, and therefore can be used to automatically filter out the less important features. For each feature type and each resolution of the region subdivision, the T-values of all the regular regions were sorted in decreasing order into a feature list. A T-value threshold approach was employed to select the top features from each list. In each list, let the minimum and maximum T-value be a and b, respectively. For a given percentage thresholding p (e.g. 10% for p = 10), a feature with a T-value t will be selected if it satisfies the condition:
i.e. the features with top p% of T-values were selected.
Feature analysis classifier
This initial feature vector was too large for the feature classification algorithms. In pattern recognition, more features do not necessarily lead to better classification results [i.e. ‘curse of dimensionality’ (23)]. Thus, a subset of this feature vector needed to be selected. As shown by Hua et al. (24), the optimal number of features used in a machine learning process often depends on the statistical distribution of the datasets and the specific classifier. But the general rule of thumb is that the ratio of the sample size to the number of features should be greater than 3.
To reduce the size of the feature vector to about one-third the size of the sample, an additional feature selection process was applied to determine an optimal subset of the existing feature vector that had the best discriminatory (diagnostic) power. A very effective and commonly used method is the Correlation-based Best First search algorithm. The Best First search starts with an empty set of features and generates all possible single feature expansions. The subset with the highest evaluation is chosen and is expanded in the same manner by adding single features. If expanding a subset results in no improvement in discrimination of the two datasets, the search drops back to the next best unexpanded subset and continues from there.
The Correlation-based Feature Selection (CFS) approach uses a search algorithm along with a function to evaluate the merit of the feature subsets. The heuristic by which CFS measures the ‘goodness’ of feature subsets takes into account the usefulness of individual features for predicting the class label along with the level of inter-correlation among them. It is based on the hypothesis that ‘Good feature subsets contain features highly correlated with (predictive of) the class, yet uncorrelated with (not predictive of) each other’ (25).
In feature analysis, the selected feature vector was analyzed using pattern classifiers on the same training set (two-thirds of the total data sets). The other one-third was used as a test set for validation. There are many powerful machine learning based data classifiers. Radial basis function networks (RBFN) classifier was used in our study. We had also experimented with other classifiers (e.g. Support vector machine) and found that results are quite similar. RBFN is a special neural network classifier for supervised learning. It is a multilayer, feed-forward neural network that is well suited to applications such as pattern discrimination and classification.
Validation of results
A Test-set (TS) approach was used to validate the results. In this approach, one-third of the images were randomly selected and put aside as a test set to be used to validate the diagnostic function generated from the analysis. The remaining two-thirds of the images were treated as a training set and used to select the features and derive a function for best separating FAS faces from control faces. This ensured that data in the test set were never involved at any stage of the feature selection and analysis processes.
Results
A total of 149 images were analyzed of which 55% were FC and 45% were CC. The majority (54.4%) of participants was female and the age of the participants ranged from 2.8 to 21 years. The age of study participants varied between the two sites; however, the age of the FAS and control patients at the same site did not differ significantly (p = 0.4 for the FC sample; p = 0.2 for the CC sample). The age variation between the FAS and control groups for the combined sample (combining FC and CC together) was also small (p = 0.73). Summary statistics for the two population groups are provided in Table 1.
Table 1.
Subject demographics
| FC (n = 82) | CC (n = 67) | |||
|---|---|---|---|---|
|
| ||||
| FAS | Control | FAS | Control | |
| Number of subjects | 50 (61%) | 32 (39%) | 36 (54%) | 31 (46%) |
| Number of females | 29 (58%) | 19 (59%) | 17 (47%) | 16 (52%) |
| Mean age (SD) | 13.12 (3.5) | 13.75 (3.6) | 5.09 (1.9) | 4.48 (2.0) |
FAS, fetal alcohol syndrome; FC, Finnish Caucasian; CC, Cape-colored.
A different feature set was identified for each of the two samples that can automatically discriminate FAS and controls. Table 2 shows the classification results using the TS validation with both FC and CC samples, as well as a combined sample. They had excellent ability to correctly classify FAS and controls for both the FC and CC samples. Within the FC sample, this automated technique correctly classified 88.2% of the FAS faces and 100% of the control faces. Within the CC sample, the automated technique was able to correctly classify 90.9% of FAS faces and 90% of the control faces. A total of 15 features were selected for the FC analysis, among which six were curvatures, four were flatness, three were aspect ratios, and two were areas. For the CC sample, a total of 19 features were selected, among which seven were curvatures, six were flatness, three were aspect ratios, and three were areas.
Table 2.
Classification results
| Clinical diagnosis | Automated classification (FC)
|
Automated classification (CC)
|
Automated classification (Combined)
|
|||
|---|---|---|---|---|---|---|
| FAS (+) | FAS (−) | FAS (+) | FAS (−) | FAS (+) | FAS | |
| FAS | 15 | 2 | 11 | 1 | 24 | 5 |
| Controls | 0 | 10 | 1 | 9 | 5 | 16 |
| Classification rates | Sensitivity: 88.2% | Sensitivity: 91.7% | Sensitivity: 82.75% | |||
| Specificity: 100% | Specificity: 90% | Specificity: 76.2% | ||||
| Overall: 92.6% | Overall: 90.9% | Overall: 80.0% | ||||
FAS, fetal alcohol syndrome; FC, Finnish Caucasian; CC, Cape-colored.
These tests were carried out on the set that was not used for feature selection (see Methods).
The ability of this method to discriminate FAS and controls when using the combined FC and CC data was substantially poorer (Table 2). Among the misclassified cases, seven were from the CC sample and three were from the FC sample. All false-positive cases (controls classified into FAS) were from the CC sample, and all five misclassified FC faces were false-negative cases (FAS classified into controls).
Discussion
We developed a method that automatically computes facial features from 3D images and used them to discriminate subjects with FAS from controls. We demonstrated that this new mechanism when used in conjunction with our analytical approaches can distinguish individuals with FAS from ethnically similar controls. However, our results also found that facial features automatically selected by the algorithm to distinguish FAS and control faces vary among different ethnic populations. Prenatal alcohol exposure not only leads to the specific dysmorphic features outlined in the criteria for FAS – short palpebral fissure, thin upper lip and vermillion border – but also to other more subtle yet, by 3D imaging, identifiable features that make the overall gestalt of a FASD face. For the purpose of comparison, we tested whether the classification rate would improve if the FC and CC samples were combined to gain a larger sample. We found that the classification rate was lower with a sample of mixed races, indicating that ethnicity plays a significant role in the features that help to identify individuals who are prenatally exposed to alcohol. Our study population included a wide age distribution and, therefore, we cannot conclusively determine whether the unique features that distinguish FAS and controls in each population can be attributed to ethnic differences or the effects of age on the facial features of FAS or the pattern of maternal alcohol use. However, the mean ages of the FAS group and the control group for each of the samples (FC, CC, and combined) were not significantly different (with p-values of 0.4, 0.2, and 0.7, respectively). To further verify this notion, we added age as a new feature in the analyses. The computer algorithm did not pick age in the final feature set for the FC and CC samples. Although age was in the final feature set in the analysis for the combined sample, it did not improve the classification rate. Therefore, we postulate that age did not have a significant effect on our results.
The accuracy of the classification obtained in this study is substantially improved from those obtained in an earlier study (26), which also employed facial recognition technique but utilized 2D photographs. The results in this study, though requiring more expensive and less portable technology, clearly demonstrate the superiority of 3D images as a means to discriminate FAS subjects and controls. These results suggest 3D images are a useful addition to the current dysmorphology and clinical evaluation of individuals suspected of prenatal alcohol exposure. Importantly, this approach shows great promise as part of growing efforts to develop novel telemedicine applications which would allow better clinical care in remote locations. The TS validation approach we employed in this technique provides accurate prediction for its clinical performance as the test set was never used in any of the training and data processing steps, i.e. it was treated the same as any new clinical data (of the same ethnic population).
In our method, several different pattern classification techniques (e.g. Neural Networks, Support Vector Machines, etc.) can be applied to derive the computational models for FAS classifications. Whereas the classification rates remain high with different techniques, the specific feature selected for these computational models, however, are not always the same. As pattern classification algorithms select only independent features, we speculate that this inconsistency could be the result of feature correlations for FAS faces, and each time a different set of independent features among the correlated features could be selected. We believe as a future work that further study is needed to better understand this phenomenon before making meaningful biological interpretations from the specific feature set. Another future direction will be to apply this technique to other syndromes that may also have facial characteristics.
Factors such as age, ethnicity, and pattern of maternal alcohol ingestion may play a role in the detection of facial features associated with FASD. Therefore, when additional samples are collected, we intend in future studies to perform analyses evaluating the effects of age and maternal alcohol ingestion patterns on the ability to classify FAS (and ultimately FASD). These analyses may provide additional evidence for determining whether the unique features that distinguish FAS and controls in each population can be attributed to ethnicity, age or pattern of maternal alcohol intake.
Greater understanding of the phenotypic characteristics associated with prenatal alcohol exposure, particularly if these differences can be reliably and objectively defined, will assist in the more efficient diagnosis of prenatally exposed individuals. More importantly such phenotypic markers and analytical techniques may allow clinicians to ‘expand the phenotype’ to detect individuals who may not meet the more stringent criteria of FAS but who nonetheless suffer from clinically significant effects of prenatal alcohol exposure. These individuals occur with a much greater frequency than FAS, but currently remain largely undetected because they fail to express clinically evident facial dysmorphology meeting the diagnostic criteria. Identification of FAS in early childhood is important as research suggests that early identification of alcohol exposed children fosters positive outcomes and reduces the likelihood of secondary disabilities (27).
Clinical relevance.
A new 3D facial image analysis technique was developed to identify children with FAS. Laser scans of facial images were collected, processed, and analyzed using computer graphics, machine learning, and pattern recognition techniques to determine the facial features that best discriminate FAS and control subjects. It provides an automated and potentially more accurate and efficient means to identify individuals with FAS. We hope this application can be further developed to detect a wider range of individuals with FASD and believe it may be suitable in the future for telemedicine applications.
Acknowledgments
The authors acknowledge Dr Ting-Kai Li who developed and initiated this project while still at Indiana University. The authors also acknowledge the following people for assistance with this project: Leena Neuvonen, Kirsi Mallea, and Leena Loimu (Helsinki); and Christopher D. Molteno, Joseph L. Jacobson, Margaret September, Mandy van Niekerk, Mariska Pienaar, Jan Chamberlain, and Lisa Aitken (Cape Town); and Jeffrey Rogers (Indianapolis).
Sources of support: This international collaborative study is supported by grants from the National Institute on Alcohol Abuse and Alcoholism (NIAAA): U24AA014809 (to T.F.), U01AA014790 (to S.J.), U24AA014815 (to K.J.), U01AA014786 (to P.M.), U01AA014834 (to S.M.), U24AA014828 (to E.R.), U24AA014830 (to E.R.), and an administrative supplement to R01AA09524 (to S.J.). Additional funds were provided by the National Institutes of Health Office of Research on Minority Health, the Indiana Genomics Initiative (INGEN), and the Joseph Young, Sr., Fund from the State of Michigan (to S.J.).
Contributor Information
Shiaofen Fang, Department of Computer Science, Purdue University, Indianapolis, IN, USA.
Jason McLaughlin, Department of Computer Science, Purdue University, Indianapolis, IN, USA.
Jiandong Fang, Department of Computer Science, Purdue University, Indianapolis, IN, USA.
Jeffrey Huang, Department of Computer Science, Purdue University, Indianapolis, IN, USA.
Ilona Autti-Rämö, Department of Child Neurology, HUCH Hospital for Children and Adolescents, Helsinki, Finland and Finnish Office for Health Technology, Assessment/STAKES.
Åse Fagerlund, Folkhälsan Research Center, Helsinki, Finland and Department of Psychology, Åbo Akademi University, Turku, Finland.
Sandra W. Jacobson, Department of Psychiatry and Behavioral Neurosciences, Wayne State University School of Medicine, Detroit, MI, USA
Luther K. Robinson, State University of New York at Buffalo School of Medicine and Biomedical Sciences, Buffalo, NY, USA
H. Eugene Hoyme, Stanford University School of Medicine, Stanford, CA, USA.
Sarah N. Mattson, Department of Psychology, San Diego State University, San Diego, CA, USA
Edward Riley, Department of Psychology, San Diego State University, San Diego, CA, USA.
Feng Zhou, Indiana University School of Medicine, Indianapolis, IN, USA.
Richard Ward, Indiana University School of Liberal Arts, Indianapolis, IN, USA.
Elizabeth S. Moore, Indiana University School of Liberal Arts, Indianapolis, IN, USA. St. Vincent Women’s Hospital, Indianapolis, IN, USA
Tatiana Foroud, Indiana University School of Medicine, Indianapolis, IN, USA.
References
- 1.Autti-Ramo I, Fagerlund A, Ervalahti N, Loimu L, Korkman M, Hoyme HE. Fetal alcohol spectrum disorders in Finland: clinical delineation of 77 older children and adolescents. Am J Med Genet A. 2006;140:137–43. doi: 10.1002/ajmg.a.31037. [DOI] [PubMed] [Google Scholar]
- 2.Bertrand J, Floyd LL, Weber MK. Guidelines for identifying and referring persons with fetal alcohol syndrome. MMWR Recomm Rep. 2005;54:1–14. [PubMed] [Google Scholar]
- 3.Hoyme HE, May PA, Kalberg WO, Kodituwakku P, Gossage JP, Trujillo PM, et al. A practical clinical approach to diagnosis of fetal alcohol spectrum disorders: clarification of the 1996 institute of medicine criteria. Pediatrics. 2005;115:39–47. doi: 10.1542/peds.2004-0259. [DOI] [PMC free article] [PubMed] [Google Scholar]
- 4.May PA, Gossage JP. Estimating the prevalence of fetal alcohol syndrome: a summary. Alcohol Res Health. 2001;25:159–67. [PMC free article] [PubMed] [Google Scholar]
- 5.May PA, Gossage JP, Marais AS, Adnams CM, Hoyme HE, Jones KL, et al. The epidemiology of fetal alcohol syndrome and partial FAS in a South African community. Drug Alcohol Depend. 2007;88:259–71. doi: 10.1016/j.drugalcdep.2006.11.007. [DOI] [PMC free article] [PubMed] [Google Scholar]
- 6.Jones KL, Smith DW. Recognition of the fetal alcohol syndrome in early infancy. Lancet. 1973;2:999–1001. doi: 10.1016/s0140-6736(73)91092-1. [DOI] [PubMed] [Google Scholar]
- 7.Sampson PD, Streissguth AP, Bookstein FL, Little RE, Clarren SK, Dehaene P, et al. Incidence of fetal alcohol syndrome and prevalence of alcohol-related neurodevelopmental disorder. Teratology. 1997;56:317–26. doi: 10.1002/(SICI)1096-9926(199711)56:5<317::AID-TERA5>3.0.CO;2-U. [DOI] [PubMed] [Google Scholar]
- 8.May PA, Brooke L, Gossage JP, Coxford J, Adnams C, Jones KL, et al. Epidemiology of fetal alcohol syndrome in a South African community in the Western Cape Province. Am J Public Health. 2000;90:1905–12. doi: 10.2105/ajph.90.12.1905. [DOI] [PMC free article] [PubMed] [Google Scholar]
- 9.Mattson SN, Riley EP, Gramling L, Delis DC, Jones KL. Neuropsychological comparison of alcohol-exposed children with or without physical features of fetal alcohol syndrome. Neuropsychology. 1998;12:146–53. doi: 10.1037//0894-4105.12.1.146. [DOI] [PubMed] [Google Scholar]
- 10.Mattson SN, Riley EP, Gramling L, Delis DC, Jones KL. Heavy prenatal alcohol exposure with or without physical features of fetal alcohol syndrome leads to IQ deficits. J Pediatr. 1997;131:718–21. doi: 10.1016/s0022-3476(97)70099-4. [DOI] [PubMed] [Google Scholar]
- 11.Jones KL, Robinson LK, Bakhireva LN, Marintcheva G, Storojev A, Strahova VA, et al. Accuracy of the diagnosis of physical features of fetal alcohol syndrome by pediatricians after specialized training. Pediatrics. 2006;118:1734–8. doi: 10.1542/peds.2006-1037. [DOI] [PubMed] [Google Scholar]
- 12.Little BB, Snell LM, Rosenfeld CR, Gilstrap LC, 3rd, Gant NF. Failure to recognize fetal alcohol syndrome in newborn infants. Am J Dis Child. 1990;144:1142–6. doi: 10.1001/archpedi.1990.02150340088030. [DOI] [PubMed] [Google Scholar]
- 13.Streissguth AP, Aase JM, Clarren SK, Randels SP, LaDue RA, Smith DF. Fetal alcohol syndrome in adolescents and adults. JAMA. 1991;265:1961–7. [PubMed] [Google Scholar]
- 14.Douglas TS, Viljoen DL. Eye measurements in 7-year-old black South African children. Ann Hum Biol. 2006;33:241–54. doi: 10.1080/03014460600619161. [DOI] [PubMed] [Google Scholar]
- 15.Autti-Raämö I, Gaily E, Granström M-L. Dysmorphic features in offspring of alcoholic mothers. Arch Dis Child. 1992;67:712–6. doi: 10.1136/adc.67.6.712. [DOI] [PMC free article] [PubMed] [Google Scholar]
- 16.Fang S, Adada M. Multi-scale iso-surface extraction for volume visualization. Int J Image Graph. 2006;6:173–86. [Google Scholar]
- 17.Lorensen WE, Cline HE. Marching cubes: a high resolution 3D surface construction algorithm. Computer Graphics. 1987;21:163–9. [Google Scholar]
- 18.Besl PJ, McKay ND. A method for registration of 3-D shapes. IEEE Trans Pattern Anal Mach Intell. 1992;14:239–56. [Google Scholar]
- 19.Lu X, Colbry D, Jain AK. Matching 2.5D Scans for Face Recognition. In: Zhang D, Jain A, editors. Biometric Authentication. Heidelberg: Springer Verlag; 2004. pp. 30–6. [Google Scholar]
- 20.Hardy RL. Multiquadric equations of topography and other irregular surfaces. J Geophys Res. 1971;76:1905–15. [Google Scholar]
- 21.Fang S, Srinivasan R, Raghavan R, Richtsmeier J. Volume morphing and rendering – an integrated approach. Computer Aided Geometric Design. 2000;17:59–81. [Google Scholar]
- 22.Meyer M, Desbrun M, Schroder P, Barr A. Discrete differential geometry operators for triangulated 2-manifolds. In: Hege HC, Polthier K, editors. Visualization and Mathematics III. Heidelberg: Springer Verlag; 2003. pp. 35–57. [Google Scholar]
- 23.Bellman RE. Adaptive Control Processes: A Guided Tour. Princeton, NJ, USA: Princeton University Press; 1961. [Google Scholar]
- 24.Hua J, Xiong Z, Lowey J, Suh E, Dougherty E. Optimal number of features as a function of sample size for various classification rules. Bioinformatics. 2005;21:09–15. doi: 10.1093/bioinformatics/bti171. [DOI] [PubMed] [Google Scholar]
- 25.Hall MA. Correlation-based feature selection for discrete and numeric class machine learning. In: Langley P, editor. ICML 2000. Stanford, CA: Morgan Kaufmann; 2000. pp. 359–66. [Google Scholar]
- 26.Huang J, Jain A, Fang S, Riley EP. Using facial images to diagnose fetal alcohol syndrome (FAS) In: Hersch RD, Andre J, Brown H, editors. Proceedings of the International Conference on Information Technology: Coding and Computing (ITCC 2005) Los Alamitos, CA: IEEE Computer Society; 2005. pp. 66–71. [Google Scholar]
- 27.Streissguth AP, Barr HM, Kogan J, Bookstein FL. Understanding the occurrence of secondary disabilities in clients with fetal alcohol syndrome (FAS) and fetal alcohol effects (FAE) In: Stratton K, Howe C, Battaglia F, editors. Fetal Alcohol Syndrome Conference. Seattle, WA: Fetal Alcohol Drug Unit; 1996. pp. 4–8. [Google Scholar]