

Abstract
Objective
To compare the incidental radiographic findings in the maxillofacial structures and the pharyngeal airway between moderate/severe Obstructive Sleep Apnea (OSA) subjects and mild OSA/normal subjects using Cone-Beam Computed Tomography (CBCT) scans.
Study Design
53 moderate/severe OSA subjects (with a Respiratory Disturbance Index [RDI]≥15 events/hr) and 33 mild OSA/normal subjects, (RDI<15) based on ambulatory somnographic assessment were recruited. Supine CBCT’s were taken and sent for radiological report. The incidental findings were compared between the two groups.
Results
Moderate/severe subjects had larger prevalence of conchae bullosa, hypertrophic turbinates, hypertrophic tonsils, elongated or posteriorly placed soft palate, narrower airway, enlarged tongue, and focal calcifications, though no significant differences were found.
Conclusions
CBCT is useful in identifying maxillofacial and airway anomalies that could interfere with normal breathing. However, no significant difference was found in prevalence of incidental findings between moderate/severe OSA and mild/normal subjects. Further studies are necessary to generalize our results.
Keywords: Obstructive sleep apnea, cone-Beam CT, radiological report, incidental findings
1. Introduction
Cone-beam CT (CBCT) has been used for many maxillofacial applications such as for implant site imaging and diagnosis and treatment planning for craniofacial surgery and orthodontics, assessment of the three-dimensional nature of periodontal bone topography1, and various endodontic applications2. CBCT is very helpful in procedures such as surgical exposure of impacted canines, localizing the mandibular canal for third molar extraction, visualizing the maxillary sinus, airway structures, aids in orthognathic surgery in patients with facial asymmetry, and temporomandibular joint (TMJ) disorders.3,4,5,6,7,8
We have been using CBCT to investigate the airway in Obstructive Sleep Apnea (OSA) patients and controls in several studies. 9, 10, 11 Risk factors for OSA include adenotonsillar hypertrophy (particularly in children and young adults) and craniofacial skeletal abnormalities (particularly in non-obese adults and children). Two-dimensionsal cephalometric imaging has been used to investigate anatomic differences in OSA patients for the last 15 years.12 Schwab reviewed the cephalometric literature and reported that the most common skeletal abnormalities in OSA patients were: 1) mandibular and maxillary deficiency; 2) reduced dimension of the posterior airway space (measured at the base of the tongue); 3) enlarged tongue; 4) enlarged soft palate; and 5) caudally displaced hyoid.
While working with CBCT in our previous sleep apnea projects, we realized that there might be some relevant incidental findings in 3D CBCT’s taken from these sleep apnea patients. Anatomic differences associated with sleep apnea identified by Schwab and others are airway narrowing, enlarged tonsils, long or enlarged soft palate, and enlarged tongue. Other incidental findings we decided to study are: sinus findings, nasal findings, TMD, and focal calcifications. We will endeavor to briefly explain why.
OSA is associated with several systemic diseases. In previous studies, the relationship of OSA with obesity, calcified carotid artery atheroma and hypercalcemia has been well-documented.13,14,15,16 These reports suggest that OSA is related with metabolic syndrome, mineral metabolism disorders and cardiovascular disease. Therefore, we included focal calcifications in our report.
In 2011, Maestre-Ferrin et al. 17 assessed the prevalence of radiographic signs of maxillary sinus pathology in patients undergoing dental implant treatment. They concluded that CT can be considered a reliable method for the diagnosis of maxillary sinus pathology. Multilevel anatomic obstruction is often present in snoring and OSA. As the nose is the first anatomical boundary of the upper airway, nasal obstruction may contribute to sleep apnea. In 2011, Georgalas18 described the role of the nose in snoring and OSA. When the nasal airway is almost completely obstructed, a switch from nose to mouth breathing occurs, but at a high physiological cost. Mouth breathing is associated with up to 2.5 times higher total resistance19 and with narrowing of the pharyngeal lumen, decreasing the retroglossal diameter as a result of an additional posterior retraction of the tongue and an increase in the oscillation of the soft palate and the redundant pharyngeal tissue,20 all factors which lead to SDB.
Oral appliances have been applied to mild/moderate OSA patients. 21 In 2003, Ringqvist et al.22 investigated the dental and skeletal changes after 4 years of obstructive sleep apnea treatment with a mandibular advancement device Commonly reported minor and temporary side effects include TMJ pain, myofascial pain, tooth pain, salivation, TM joint sounds, dry mouth, gum irritation and morning-after occlusal changes. These phenomena were observed in a wide range of frequency from 6% to 86% of patients. Occasionally, these phenomena prevented continued use of the appliance.23 Therefore, TMD findings are important for selecting the therapy and predicting an adverse reaction with OA therapy.
The aim of this study was to evaluate the location, nature, and prevalence of incidental findings in the airway and maxillofacial structures in moderate/severe OSA cases compared to mild OSA/normal patients using 3D CBCT scans evaluated by commercial board certified maxillofacial oral radiologists.
2. Methods and Materials
Study design
The study presented in this paper is part of a larger study conducted at the University of XXX which goal was to predict sleep apnea based on CBCT imaging. In this paper we evaluate the location, nature, and occurrence of incidental findings in maxillofacial structures using supine 3-dimensional cone-beam volumetric scans taken on moderate/severe OSA patients and mild OSA/normal subjects.
Subjects
This study included all subjects who completed the study. Of 87 subjects recruited only one did not successfully complete the sleep study and was not included. In total, 53 moderate to severe OSA patients with Respiratory Disturbance Index1 [RDI]≥15 events/hr (8 females and 45 males, mean age: 58.4 ± 10.35 years/old) and 33 mild/normal patients with RDI<15 (12 females and 21 males, mean age: 47.6± 12.74 years/old) were enrolled between June 2006 and December 2009 through mail, flyers and oral communication among Dr XXX’s private patients and Faculty and staff at XXX. Dr. XXX’s patients who had sleep apnea as part of their diagnosis were contacted through mail and invited to participate in the study. Faculty and staff at the school were contacted through email and flyers. Flyers were published in the school and in the internal magazine. During the study subjects were referred to the principal investigators by colleagues, other dentists attending courses at the school, faculty or staff working at the school or by subjects enrolled prior. Our “control” group was subjects who participated in the study and had a RDI<15, and were recruited by the same means: flyers, mail and oral communication. A subject with an RDI>5 and RDI<15 can be considered to have mild sleep apnea. After signing informed consent, all subjects had a supine 3-dimensional CBCT scan taken. This study was approved by the Institutional Review Board of the University of Southern California HSC-051050.
Device and Software
The maxillofacial scans were performed on the supine NewTom 3G (QA sri, Via Silvestrini 20, 37135 Verona, Italy). The device was operated at the 110 kV (peak) and 3.5 mA settings that are fixed by the manufacturer. All patients were scanned with the 12” sensor, and it acquires 360 images at 1-degree intervals in 36 seconds, with a resolution of 512*512 pixels and 12 bits per pixel. The pixel size was 0.33mm with the 12” sensor. The raw data from the scans was processed to obtain a series of images with slice thickness standardized at 0.33 mm, and the resolution of the image was 0.25 mm. The absorbed dose from a full volume scan is 36.9 to 50.3 µSv, 13, 14 which is lower than most CBCT’s. Imaging software Vworks 5.0 (Cybermed, Korea) was used to analyze the data. The scans were saved in DICOM (Digital Imaging and Communications in Medicine) files and sent to a commercial radiological maxillofacial service (Advanced Dental Board, Las Vegas, NV) for evaluation by a board certified maxillofacial radiologist.
Methods
A blinded operator (MN) entered the final reports into a database and categorized the findings into main categories: ethmoidal/maxillary sinus findings, nasal findings, airway narrowing findings, soft palate/tongue findings, focal calcification findings, and TMD findings. The main categories were suggested by an Orofacial and Oral Medicine expert (GTC), who trained the blinded operator. Subcategories were also created under these main categories. The prevalence rates of the main categories are calculated as the number of subjects who had that incidental finding divided by the number of subjects in that group.
Statistical analysis
Differences between OSA and control groups in terms of race, ethnicity, gender and prevalence of incidental findings were analyzed with the Chi-square test. Continuous variables (age, BMI, RDI and Apnea Index2) were analyzed for normality with the Kolmogorov-Smirnov test. Differences in normal variables were analyzed with t-tests. We used Wilcoxon Rank Sum test to compare non-parametric continuous variables. Statistical software SAS System for Windows (Version 9.0 or later, SAS Institute, Cary, NC) was used for analysis with significance level of 0.05
3. Results
In total, 53 moderate to severe OSA patients with AHI≥15 (8 females and 45 males, mean age: 58.4 ± 10.35 years/old) and 33 mild/normal patients with RDI<15 (12 females and 21 males, mean age: 47.6± 12.74 years/old) participated in the study.
In general, the moderate/severe OSA cases had larger prevalence of conchae bullosa, turbinate hypertrophy, hypertrophic tonsils, elongated or posteriorly placed soft palate, narrower airway, enlarged tongue, and focal calcifications though no statistically significant differences were found compared to the mild OSA/normal subjects. (Figure 1) The prevalence in mild/normal group was larger than in moderate/severe cases for the ethmoidal/ maxillary sinus finding and TMJ findings.
Figure 1. Incidental findings.


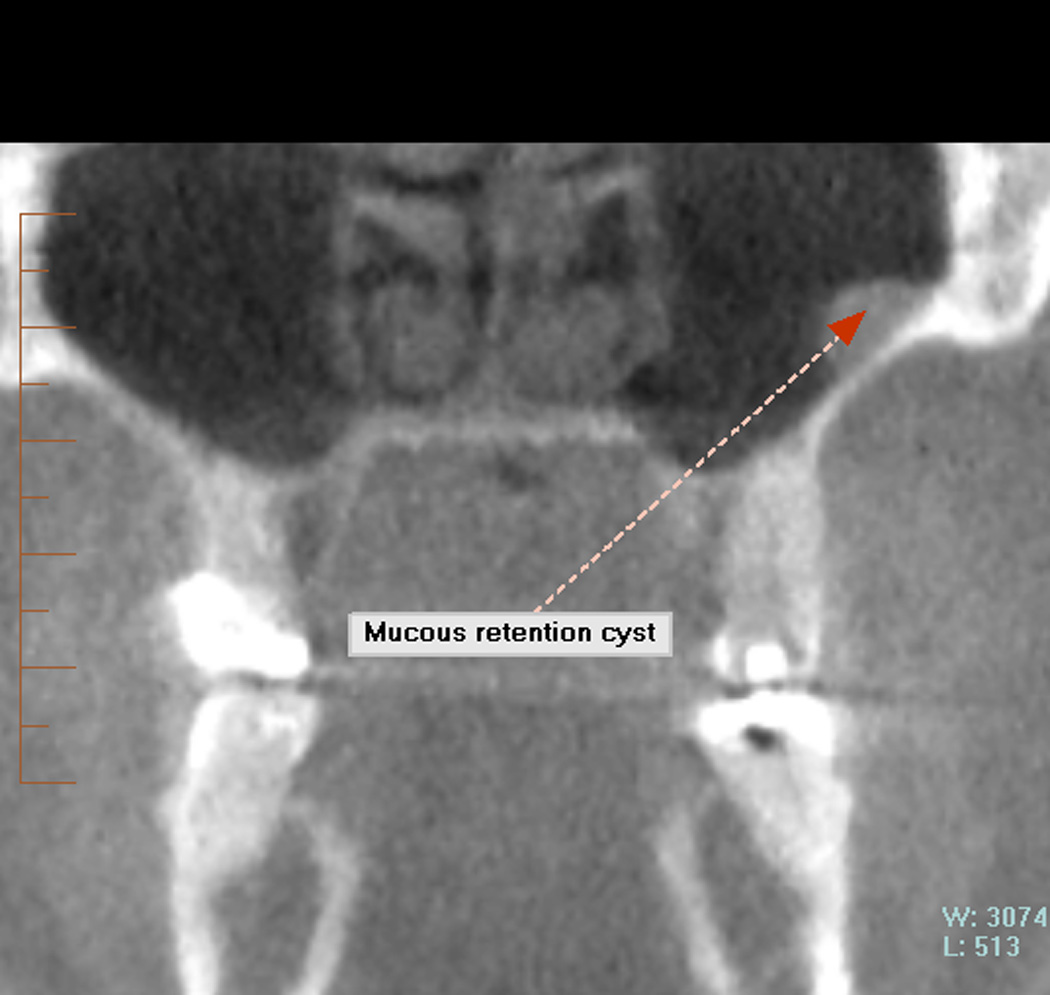


A: Turbinate hypertrophy. B: Ethmoidal sinus polypoidal mass. C: Mucus cyst. D: Concha bullosa. E: Tosillolith. F: Hypertrophic tonsils
4. Discussion
This paper mainly reports the radiographic incidence of various findings of the head and neck of normal/mild sleep apnea patients compared to moderate/severe sleep apnea patients. The main focus of this paper was not to investigate the correlation between what was found radiographically on the CBCT scan with the clinical symptoms of these patients. Therefore, no medical questionnaire relating to these findings was provided to these patients.
ETHMOIDAL/MAXILLARY SINUS
According to our results, 37.8% of the cases have ethmoidal or maxillary sinus findings compared to 45.5% of the controls. Havas et al.24, reports a rate of incidental opacification as high as 42.5%, and Flinn et al.25 reports a rate of 27%. Our rates are within their range from 27% to 42.5%. Our data shows an incidence of 3.8 % of mucous cyst in the cases and 12.12% in the controls. Kanagalingam et al.26, in their prospective study of computed tomography (CT) found an overall 35.6% of ophthalmic patients studied had radiologic evidence of at least one maxillary mucosal cyst. Our patient pool is different than Kanagalingam’s because their patients were undergoing scans of the orbits for ophthalmic reasons. Their patients being medical patients might not represent the general public and have a higher prevalence than our subjects.
NASAL FINDINGS
Pérez-Piñas et al.27 studied the CT anatomical variants observed in the nasal fossae and paranasal sinuses in 110 Spanish suspected of inflammatory sinus pathology. They found great anatomical variability, and a high percentage (67%) presented one or more anatomical variants. In absolute percentage terms, the highest degree of variability was for the nasal septum (55%), followed by the middle nasal concha (25%), the ethmoidal air cells (10%), the ethmoidal uncinate process (4%) and other sites (6%). In our study, we found septum deviated/ maxillary bony septum/ osteoma present in 18.87 % of the cases and 18.18 % of the controls. We also found on the scans the presence of concha bullosa, enlarged conchae in turbinate, turbinate hypertrophy, pneumatized middle nasal concha in 15.09 % of the cases and 6.06% of the controls. Because the population studied by the Spanish authors were suspected of sinus pathology, the prevalence of nasal pathology was larger than in our study.
TONSIL FINDINGS
Tonsillar enlargement is a more common cause of obstructive sleep apnea (OSA) in the pediatric population than it is in adults. In adults with OSA, tonsillar hypertrophy is a known but less frequent cause. The available literature contains only a few small series of adult patients with obstructive apnea related to excessive tonsillar tissue. In our study, we found a rate of 5.06% in the cases (aged 29 to 80 years old) and 3.03 % in the controls (aged 24 to 68 years old).
According to Mesolella et al.28, large oropharyngeal concretions--giant tonsillolith--are not very common. Ben Salem et al.29 studied retrospectively a total of 515 CT scans for calcifications of the posterior wall of the nasopharynx. The simultaneous presence of nasopharyngeal tonsil and palatine tonsil calcifications in three patients were considered as tonsilloliths in their study and represented 6% of the CTs in their series. They defined nasopharyngeal tonsilloliths as stones of less than 1 cm in the pharyngeal tonsils frequently detected on CT with no clinical symptoms. In our study, we found tonsillolith in 15.09% of the cases and 9.09 % of the controls. Our incident rate (15.09% and 9.09%) are higher compared to the 6% rate in Ben Salem et al.
AIRWAY NARROWING
Sixty percent of the cases in our study had narrow airway compared to 52% of the controls. Structural upper airway narrowing is detectable with CT in awake patients with obstructive sleep apnea according to Haponik’s study30. Using a rigid endoscope, Reda et al.31 discovered habitual snorers statistically have a narrower oropharyngeal isthmus compared to the healthy volunteers. However, the high prevalence of airway narrowing in the control group can be explained in part by self-selection bias. Subjects with sleep apnea family members or very mild sleep apnea are more prone to participate in a research study with free imaging than a healthy normal volunteer.
Another risk factor for OSA is a longer upper airway. In 2011, Kim et al. 32 measured the upper airway length (UAL), which was defined as the vertical distance from the hard palate to the hyoid in the mid-sagittal plane. They reported that the adjusted UAL was a significant variable for predicting the AHI of OSA patients. The radiologists in this study did not consider airway length in their reports so we cannot evaluate that factor in this paper.
SOFT PALATE/TONGUE FINDINGS
One local airway factor proposed as a causative agent of obstructive sleep apnea is the long soft palate. In 1999, Johnston and Richardson reported that the soft palate became longer and thicker over time between early and middle adult life. 33 Several additional studies report increased length of the soft palate in apnea patients versus non-apnea subjects and in obese OSA patients compared with snorers and non-obese patients. 34,35 In this study, we found that 30% of the cases and 21% of the controls had soft palate/uvula elongated or posteriorly positioned. Using a rigid endoscope, Reda et al.36 discovered habitual snorers statistically have a longer soft palate and a longer wide uvula compared to the healthy volunteers. Shigeta et al.37 investigated the differences in soft palate and airway length between OSA and non-OSA patients in 45 consecutive patients and found OSA patients had a longer soft palate in proportion to their oropharyngeal airway compared to controls as well as men compared to women.
Considering the tongue, only one case in this study had hypertrophic tongue. In 2011, Shigeta et al. 38 investigated the influence on the upper airway of the tongue and mandible size with 3D reconstructed models from CT data. They concluded that the tongue increases with BMI and that decreases the airway volume which is likely to be involved in the development of OSA.
FOCAL CALCIFICATIONS
In this study, the prevalence of calcification of the stylohoid ligament was 13.21% in the cases and 3.03 % in the controls. Rizzatti-Barbosa et al.39 found a calcified stylohyoid ligament complex in 20% of the patients using panoramic radiographs, and Ferrario et al.40 discovered the total incidence of calcification of stylohyoid ligament to be 84.4%. The number and the length of calcifications increased with age. O Carroll 41 found a sharp increase in incidence of calcification of the stylohoid ligament during the first three decades of age. Because our cases were older than the controls, it might account for their higher incident rate of calcification.
We found the calcification rate of thyroid cartilage and of fax celebri the same, 1.89% for the cases and 0% for the controls. Mupparapu et al.42 evaluated the lateral cephalometric radiographs and found among 173 patients in the first 2 decades, evidence of thyroid ossification in 2 male patients (1.1%). So, it makes sense that the calcification rate of thyroid cartilage in our cases is larger than our controls’ because our controls are younger.
The calcification rate of pineal gland in our study was 3.77% for the controls and 3.03% for the cases. With Brain_CT, Admassie et al. 43 found the incidence of normal calcification of pineal gland in Ethiopia patients without pathology about 72.0%. The rate was higher in males than in females by 13.1%. The frequency of pineal gland calcification showed a steady increase with age on both sex groups. Kwak et al.44 found a calcification rate of 67.7% in pineal region in CT scans and concluded that calcification in pineal region increases with aging. Our incident rate of pineal calcification is significantly lower than those above studies, and it might be due to the differences in race and ethnicity.
We found 1.89% of the cases have falx cerebri calcification, and none of the controls has this. Daghighi et al.45 studied the CT scans of 1569 Iranian patients without any pathological conditions and found 71.0% had pineal calcification; 7.3% had tentorium cerebelli, sagittal sinus or falx cerebri calcifications; 6.6% had vascular calcification. According to Weins and Stenbeg46, by simple radiography, calcification of sagittal sinus and falx calcification are found in 7–9% of adults. Our incident rates of falx celebri seem to be low compared to the two studies above. However, the number showed in their study included not only falx celebri, but also included other structures like tentorium cerebelli, sagittal sinus, etc.
Pornprasertsuk-Damrongsri et al.47 studied the panoramic radiographs of the patients 50 and older and found 2.5% of the 1,370 patients had 1 or more carotid artery calcification (CACs). In our study we found 3.77% of the cases had carotid calcification while 0% of the controls had this. Our incidence rate is similar to their study.
TMD
There are many kind of Temporomandibular joint disorders (TMD). In this study, we found 11% of the cases and 18% of the controls had radiographic signs of degenerative joint disease or osteoarthritis. Celiker et al. 48 studied the frequency and character of TMD in asymptomatic rheumatoid arthritis patients (RA) using CT and MRI. Among the 20 patient, 45% had TMJ involvement. It is not clear if our patients (cases and controls) had rheumatoid arthritis and are assumed normal. Thus, it is reasonable that the incident rates of TMD for both the cases and controls are significant lower compared to 45% in Celiker et al. where all patients are asymptomatic rheumatoid arthritis patients.
Limitation
Though there were no significant differences in race or ethnicity between the two groups and all races and ethnicities were welcomed, most of the subjects enrolled were White non-hispanic, so the results in this paper might not be generalized to other races or ethnicities, or to patients younger than 32 or older than 80 year’s old. Recruitment was limited by design and financial considerations to Dr. XXX’s patients or faculty/staff/students or family members at XXX School of Dentistry as opposed to the general population for OSA cases and controls. Most of the subjects were recruited by direct mail or flyers but towards the end of the study the subjects referred their friends or family members to participate in the study. All subjects who had a CBCT and had at least two family members were included in the study regardless of age, gender and BMI. The board certified sleep physician and maxillofacial radiologists creating the sleep and pathological reports were blinded to outcome status, so we do not expect observer bias in those measurements.
Persons with a specific combination of exposure (family history or craniofacial anomalies) and outcome (sleep apnea) may self-select themselves to participate in a case-control study. It could create bias if those who participated were different from those that did not in terms of exposures analyzed in the study.
Also, no detailed medical questionnaire related to the above pathologies was provided to the patients to ascertain symptoms. The aim of this study was to look for differences in radiographic findings between mild OSA/normal and moderate/severe OSA patients regardless of their other medical problems.
5. Conclusions
Mostly no statistically significant difference at 95% confidence level was found between the moderate/severe OSA cases and mild OSA/normal subjects, however the OSA patients in general had higher percentage of conchae bullosa, turbinate hypertrophy, hypertrophic tonsils, elongated or posteriorly placed soft palate, narrower airway, enlarged tongue, and focal calcifications. Further studies with larger sample size are necessary to generalize our results.
Figure 2. Incidental findings.
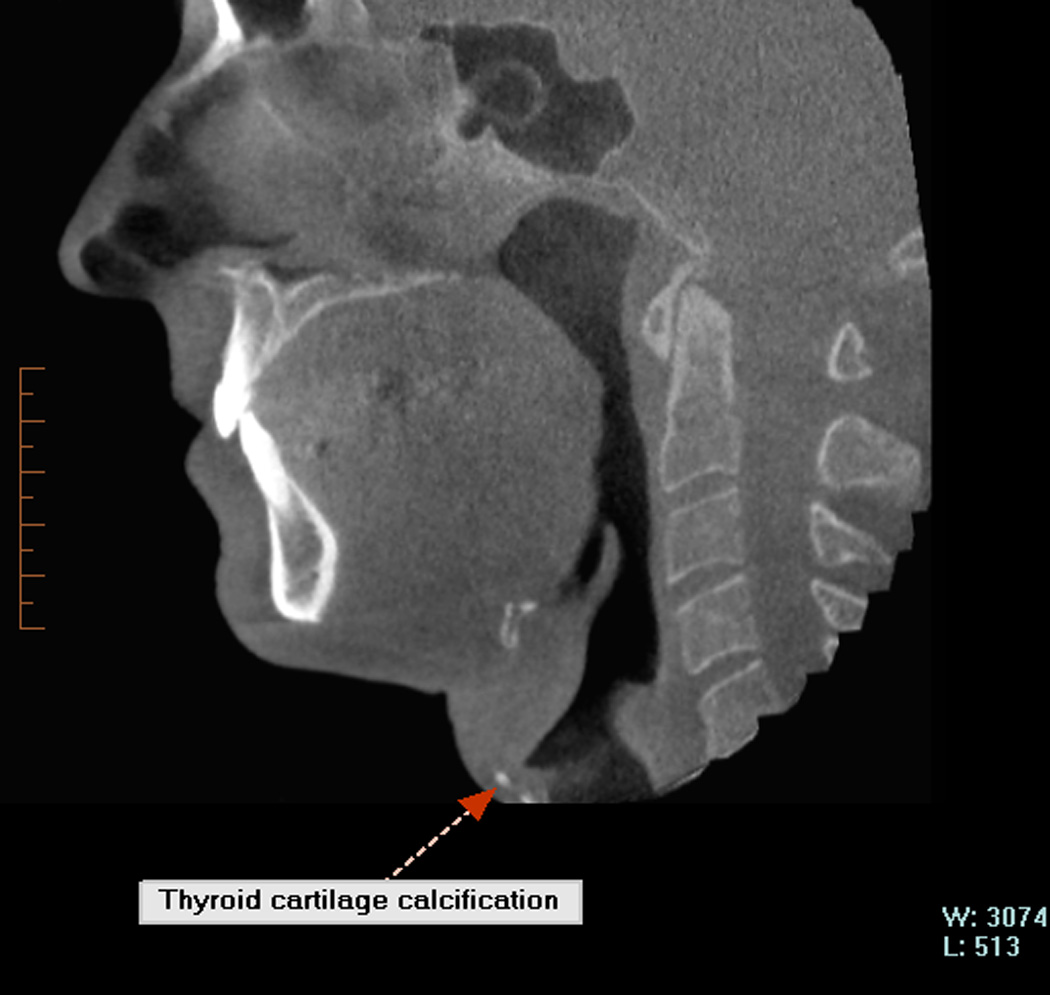


G: calcification of thyroid cartilage. H: calcification of carotid. I: calcification of stylohyoid ligament. J: calcification of pineal gland
Figure 3. Incidental findings.


K: calcification of lymph node. L: hypertrophic uvula. M: flatten osteoarthritis TMJ. N: TMD (degenerative joint)
Table 1.
Descriptive statistics for OSA and control groups.
| Parameters | OSA patients Mean ± SD (N=53) |
Controls Mean ± SD (N=33) |
T-Test p-value |
|---|---|---|---|
| Gender | 45M : 8F | 21M : 12F | 0.023a |
| Age (yrs) | 58.0 ± 10.35 Range:[29.0–80.0] |
47.6 ± 12.74 Range:[24.0–68.0] |
<.0001 |
| Body Mass Index (kg/m2) | 27.6 ± 3.74 Range:[21.5–36.0] |
25.0± 3.65 Range:[18.2–33.7] |
.0025 |
| Respiratory Disturbance Index (events/hour) |
33.9 ± 16.30 Range:[15–79] |
8.0 ± 3.61 Range:[2–14] |
<.0001b |
| Apnea Index (events/hour) | 14.2 ± 15.5 Range:[0–68] |
1.2 ± 1.48 Range:[0–5] |
<.0001b |
Chi-square test
Wilcoxon Rank Sum test
Table 2.
Comparison of race distribution between OSA and control groups.
| Race | OSA (N=53) |
Controls (N=33) |
Chi-square p-value |
|---|---|---|---|
| 1=American Indian or Alaska native | 0 | 1 | 0.356 |
| 2=Asian | 11 | 4 | |
| 3=Native Hawaiian / Pacific islander | 0 | 0 | |
| 4=Black or African American | 1 | 0 | |
| 5=White | 41 | 28 |
Table 3.
Comparison of ethnicity distribution between OSAs and controls.
| Ethnicity | OSA (N=53) |
Controls (N=33) |
Chi-square p-value |
|---|---|---|---|
| 1=Hispanic | 7 | 1 | 0.114 |
| 2=Non Hispanic | 46 | 32 |
Table 4.
Number of people with incidental findings in that category
| Cases N=53 N (%) |
Controls N=33 N (%) |
Chi- square p-value |
|
|---|---|---|---|
| ETHMOIDAL/MAXILLARY SINUS FINDINGS | 20 (37.74%) | 15 (45.45%) | 0.506 |
| NASAL FINDINGS | 18 (33.96%) | 7 (21.21%) | 0.2319 |
| TONSIL FINDINGS | 11 (20.75%) | 4 (12.12%) | 0.3884 |
| AIRWAY NARROWING | 32 (60.38%) | 17 (51.52%) | 0.5035 |
| SOFT PALATE/TONGUE FINDINGS | 19 (35.85%) | 10 (30.30%) | 0.6455 |
| FOCAL CALCIFICATIONS | 11 (20.75%) | 4 (12.12%) | 0.3884 |
| TMD (Degenerative joint disease/osteoarthritis) | 6 (11.32%) | 6 (18.18 %) | 0.5235 |
Table 5.
Incidental findings per subcategory.
| Cases N=53 N (%) |
Controls N=33 N (%) |
p-value Chis- square |
|
|---|---|---|---|
| ETHMOIDAL & MAXILLARY SINUS | |||
| Sinusitis/ mucosal thickening/ enlarged mucous membrane | 20 (37.74%) | 14 (42.42%) | 0.82 |
| Mucous cyst | 2 (3.77%) | 4 (12.12%) | 0.20 |
| Soft tissue polyps | 4 (7.55%) | 0 (0%) | 0.29 |
| NASAL FINDINGS | |||
| Septum deviated/ maxillary bony septum/ osteoma | 10 (18.87%) | 6 (18.18%) | 1.00 |
| Concha bullosa/ turbinate hypertrophy/ pneumatized concha | 8 (15.09%) | 2 (6.06%) | 0.30 |
| TONSIL FINDINGS | |||
| Hypertrophic | 3 (5.66%) | 1 (3.03%) | 1.00 |
| Tonsillolith | 8 (15.09%) | 3 (9.09%) | 0.52 |
| AIRWAY NARROWING | 32 (60.38%) | 17 (51.52%) | 0.50 |
| SOFT PALATE/TONGUE FINDINGS | |||
| Soft palate/ uvula elongated or posterior position | 16 (30.19%) | 7 (21.21%) | 0.46 |
| Tongue Hypertrophic | 1 (1.89%) | 0 (0%) | 1.00 |
| Elongated epiglottis | 2 (3.77%) | 3 (9.09%) | 0.37 |
| FOCAL CALCIFICATIONS | |||
| Stylohyoid ligament/ C1 ligament | 7 (13.21%) | 1 (3.03%) | 0.15 |
| Thyroid cartilage | 1 (1.89%) | 0 (0%) | 1.00 |
| Falx celebri | 1 (1.89%) | 0 (0%) | 1.00 |
| Carotid | 2 (3.77%) | 0 (0%) | 0.52 |
| Pineal gland | 2 (3.77%) | 1 (3.03%) | 1.00 |
| Lymph node at C4 | 0 (0%) | 2 (6.06%) | 0.14 |
| TMD (Degenerative joint disease/ osteoarthritis) | 6 (11.32%) | 6 (18.18 %) | 0.52 |
Acknowledgements
Dr. Enciso was partially supported by the National Institute of Dental and Craniofacial Research grant # K25 DE016391.
Footnotes
Publisher's Disclaimer: This is a PDF file of an unedited manuscript that has been accepted for publication. As a service to our customers we are providing this early version of the manuscript. The manuscript will undergo copyediting, typesetting, and review of the resulting proof before it is published in its final citable form. Please note that during the production process errors may be discovered which could affect the content, and all legal disclaimers that apply to the journal pertain.
RDI = Respiratory Disturbance Index is the number of events per hour when there is at least a 50% reduction of the air-flow signal combined with a decrease in hemoglobin oxygen saturation of at least 1%.
Apnea event is defined in this paper as cessation of respiratory air flow for a minimum of 10 seconds. The apnea index (AI) is defined as the average number of apneas per hour of sleep
The authors declare that they have no conflict of interest.
Contributor Information
Reyes Enciso, Division of Dental Public Health and Pediatric Dentistry, Ostrow School of Dentistry, University of Southern California, Los Angeles, USA.
Yuko Shigeta, Department of Fixed Prosthodontic, School of Dental Medicine, Tsurumi University, Yokohama, Japan.
Manuel Nguyen, Division of Dental Public Health and Pediatric Dentistry, Ostrow School of Dentistry, University of Southern California, Los Angeles, USA.
Glenn T. Clark, Orofacial Pain/Oral Medicine Center, Division of Diagnostic Sciences, School of Dentistry, University of Southern California, Los Angeles, USA
REFERENCES
- 1.Hatcher DC, Dial C, Mayorga C. Cone beam CT for pre-surgical assessment of implant sites. J Calif Dent Assoc. 2003;31:825–833. [PubMed] [Google Scholar]
- 2.Tyndall DA, Rathore S. Cone-beam CT diagnostic applications: caries, periodontal bone assessment, and endodontic applications. Dent Clin North Am. 2008 Oct;52(4):825–841. doi: 10.1016/j.cden.2008.05.002. [DOI] [PubMed] [Google Scholar]
- 3.Mah J, Enciso R, Jorgensen M. Management of impacted cuspids using 3-D volumetric imaging. J Calif Dent Assoc. 2003;31:835–841. [PubMed] [Google Scholar]
- 4.Erickson M, Caruso JM, Leggitt L. Newtom QR-DVT 9000 imaging used to confirm a clinical diagnosis of iatrogenic mandibular nerve paresthesia. J Calif Dent Assoc. 2003;31:843–845. [PubMed] [Google Scholar]
- 5.Bouquet A, Coudert JL, Bourgeois D, Mazoyer JF, Bossard D. Contributions of reformatted computed tomography and panoramic radiography in the localization of third molars relative to the maxillary sinus. Oral Surg Oral Med Oral Pathol Oral Radiol Endod. 2004;98:342–347. doi: 10.1016/S1079210404002173. [DOI] [PubMed] [Google Scholar]
- 6.Schmuth GP, Freisfeld M, Koster O, Schuller H. The application of computerized tomography (CT) in cases of impacted maxillary canines. Eur J Orthod. 1992;14:296–301. doi: 10.1093/ejo/14.4.296. [DOI] [PubMed] [Google Scholar]
- 7.Khambay B, Nebel JC, Bowman J, Walker F, Hadley DM, Ayoub A. 3D stereophotogrammetric image superimposition onto 3D CT scan images: the future of orthognathic surgery. A pilot study. Int J Adult Orthod Orthognath Surg. 2002;17:331–341. [PubMed] [Google Scholar]
- 8.Tsiklakis K, Syriopoulos K, Stamatakis HC. Radiographic examination of the temporomandibular joint using cone beam computed tomography. Dentomaxillofac Radiol. 2004;33:196–201. doi: 10.1259/dmfr/27403192. [DOI] [PubMed] [Google Scholar]
- 9.Ogawa T, Enciso R, Shintaku WH, Clark GT. Evaluation of cross-section airway configuration of obstructive sleep apnea. Oral Surg Oral Med Oral Pathol Oral Radiol Endod. 2007 Jan;103(1):102–108. doi: 10.1016/j.tripleo.2006.06.008. [DOI] [PMC free article] [PubMed] [Google Scholar]
- 10.Shigeta Y, Enciso R, Ogawa T, Shintaku WH, Clark GT. Correlation between retroglossal airway size and body mass index in OSA and non-OSA patients using cone beam CT imaging. Sleep Breath. 2008 Nov;12(4):347–352. doi: 10.1007/s11325-008-0186-6. [DOI] [PubMed] [Google Scholar]
- 11.Enciso R, Nguyen M, Shigeta Y, Ogawa T, Clark GT. Comparison of cone-beam CT parameters and sleep questionnaires in sleep apnea patients and control subjects. Oral Surg Oral Med Oral Pathol Oral Radiol Endod. 2010 Feb;109(2):285–293. doi: 10.1016/j.tripleo.2009.09.033. [DOI] [PMC free article] [PubMed] [Google Scholar]
- 12.Schwab RJ. Upper airway imaging. Clin Chest Med. 1998;19:33–54. doi: 10.1016/s0272-5231(05)70430-5. [DOI] [PubMed] [Google Scholar]
- 13.Kooh SW, Binet A. Hypercalcemia in infants presenting with apnea. Can Med Assoc J. 1990;143(6):509–512. [PMC free article] [PubMed] [Google Scholar]
- 14.Friedlander AH, Yueh R, Littner MR. The prevalence of calcified carotid artery atheromas in patients with obstructive sleep apnea syndrome. J Oral Maxillofac Surg. 1998;56(8):950–954. doi: 10.1016/s0278-2391(98)90657-7. [DOI] [PubMed] [Google Scholar]
- 15.Friedlander AH, Golub MS. The significance of carotid artery atheromas on panoramic radiographs in the diagnosis of occult metabolic syndrome. Oral Surg Oral Med Oral Pathol Oral Radiol Endod. 2006;101(1):95–101. doi: 10.1016/j.tripleo.2005.04.027. [DOI] [PubMed] [Google Scholar]
- 16.Schwartz AR, Patil SP, Laffan AM, Polotsky V, Schneider H, Smith PL. Obesity and obstructive sleep apnea: pathogenic mechanisms and therapeutic approaches. Proc Am Thorac Soc. 2008;5(2):185–192. doi: 10.1513/pats.200708-137MG. [DOI] [PMC free article] [PubMed] [Google Scholar]
- 17.Maestre-Ferrin L, Galan-Gil S, Carrillo-Garcia C, Penarrocha-Diago M. Radiographic findings in the maxillary sinus: comparison of panoramic radiography with computed tomography. Int J Oral Maxillofac Implants. 2011 Mar-Apr;26(2):341–346. [PubMed] [Google Scholar]
- 18.Georgalas C. The role of the nose in snoring and obstructive sleep apnoea: an update. Eur Arch Otorhinolaryngol. 2011 Sep;268(9):1365–1373. doi: 10.1007/s00405-010-1469-7. [DOI] [PMC free article] [PubMed] [Google Scholar]
- 19.Fitzpatrick MF, McLean H, Urton AM, et al. Effect of nasal or oral breathing route on upper airway resistance during sleep. Eur Respir J. 2003;22(5):827–832. doi: 10.1183/09031936.03.00047903. [DOI] [PubMed] [Google Scholar]
- 20.Meurice JC, Marc I, Carrier G, Sériès F. Effects of mouth opening on upper airway collapsibility in normal sleeping subjects. Am J Respir Crit Care Med. 1996;153(1):255–259. doi: 10.1164/ajrccm.153.1.8542125. [DOI] [PubMed] [Google Scholar]
- 21.Lettieri CJ, Paolino N, Eliasson AH, Shah AA, Holley AB. Comparison of adjustable and fixed oral appliances for the treatment of obstructive sleep apnea. J Clin Sleep Med. 2011 Oct 15;7(5):439–445. doi: 10.5664/JCSM.1300. [DOI] [PMC free article] [PubMed] [Google Scholar]
- 22.Ringqvist M, Walker-Engström ML, Tegelberg A, Ringqvist I. Dental and skeletal changes after 4 years of obstructive sleep apnea treatment with a mandibular advancement device: a prospective, randomized study. Am J Orthod Dentofacial Orthop. 2003 Jul;124(1):53–60. doi: 10.1016/s0889-5406(03)00240-3. [DOI] [PubMed] [Google Scholar]
- 23.Ferguson KA, Cartwright R, Rogers R, Schmidt-Nowara W. Oral appliances for snoring and obstructive sleep apnea: a review. Sleep. 2006 Feb;29(2):244–262. doi: 10.1093/sleep/29.2.244. [DOI] [PubMed] [Google Scholar]
- 24.Havas TE, Motbey JA, Gullane PJ. Prevalence of incidental abnormalities on computed tomography scans of the paranasal sinuses. Arch Otolaryngol Head and Neck Surg. 1998;114:856–859. doi: 10.1001/archotol.1988.01860200040012. [DOI] [PubMed] [Google Scholar]
- 25.Flinn J, Chapman NE, Wightman AJ. A Prospective analyses of incidental paranasal sinus abnormalities on CT head scan. Clin. Otolaryngol. 1994;19:287–289. doi: 10.1111/j.1365-2273.1994.tb01232.x. [DOI] [PubMed] [Google Scholar]
- 26.Kanagalingam J, Bhatia K, Georgalas C, Fokkens W, Miszkiel K, Lund VJ. Maxillary mucosal cyst is not a manifestation of rhinosinusitis: results of a prospective three-dimensional CT study of ophthalmic patients. Laryngoscope. 2009 Jan;119(1):8–12. doi: 10.1002/lary.20037. [DOI] [PubMed] [Google Scholar]
- 27.Pérez-Piñas, Sabaté J, Carmona A, Catalina-Herrera CJ, Jiménez-Castellanos J. Anatomical variations in the human paranasal sinus region studied by CT. J Anat. 2000 Aug;197(Pt 2):221–227. doi: 10.1046/j.1469-7580.2000.19720221.x. [DOI] [PMC free article] [PubMed] [Google Scholar]
- 28.Mesolella M, Cimmino M, Di Martino M, Criscuoli G, Albanese L, Galli V. Tonsillolith. Case report and review of the literature. Acta Otorhinolaryngol Ital. 2004 Oct;24(5):302–307. [PubMed] [Google Scholar]
- 29.Ben Salem D, Guiu B, Duvillard C, Couaillier JF, Ricolfi F. Nasopharyngeal tonsillolith: a report of 31 cases. J Radiol. 2007 Feb;88(2):259–262. doi: 10.1016/s0221-0363(07)89812-x. [DOI] [PubMed] [Google Scholar]
- 30.Haponik EF, Smith PL, Bohlman ME, Allen RP, Goldman SM, Bleecker ER. Computerized tomography in obstructive sleep apnea. Correlation of airway size with physiology during sleep and wakefulness. Am Rev Respir Dis. 1983 Feb;127(2):221–226. doi: 10.1164/arrd.1983.127.2.221. [DOI] [PubMed] [Google Scholar]
- 31.Reda M, Sims AJ, Collins MM, McKee GJ, Marshall H, Kelly PJ, et al. Morphological assessment of the soft palate in habitual snoring using image analysis. Laryngoscope. 1999 Oct;109(10):1655–1660. doi: 10.1097/00005537-199910000-00020. [DOI] [PubMed] [Google Scholar]
- 32.Kim EJ, Choi JH, Kim YS, Kim TH, Lee SH, Lee HM, et al. Upper airway changes in severe obstructive sleep apnea: upper airway length and volumetric analyses using 3D MDCT. Acta Otolaryngol. 2011 May;131(5):527–532. doi: 10.3109/00016489.2010.535561. [DOI] [PubMed] [Google Scholar]
- 33.Johnston CD, Richardson A. Cephalometric changes in adult pharyngeal morphology. Eur J Orthod. 1999;21:357–362. doi: 10.1093/ejo/21.4.357. [DOI] [PubMed] [Google Scholar]
- 34.Rodenstein DO, Dooms G, Thomas Y, Liistro G, Stanescu DC, Culee C, Aubert-Tulkens G. Pharyngeal shape and dimension in healthy subjects, snorer and patients with obstructive sleep apnea. Thorax. 1990;45:722–727. doi: 10.1136/thx.45.10.722. [DOI] [PMC free article] [PubMed] [Google Scholar]
- 35.Yu X, Fujimoto K, Urushibata K, Matsuzawa Y, Kubo K. Cephalometric analysis in obese and nonobese patients with obstructive sleep apnea syndrome. Chest. 2003;124:212–218. doi: 10.1378/chest.124.1.212. [DOI] [PubMed] [Google Scholar]
- 36.Reda M, Sims AJ, Collins MM, McKee GJ, Marshall H, Kelly PJ, et al. Morphological assessment of the soft palate in habitual snoring using image analysis. Laryngoscope. 1999 Oct;109(10):1655–1660. doi: 10.1097/00005537-199910000-00020. [DOI] [PubMed] [Google Scholar]
- 37.Shigeta Y, Ogawa T, Tomoko I, Clark GT, Enciso R. Soft palate length and upper airway relationship in OSA and non-OSA subjects. Sleep Breath. 2010 Dec;14(4):353–358. doi: 10.1007/s11325-009-0318-7. [DOI] [PMC free article] [PubMed] [Google Scholar]
- 38.Shigeta Y, Ogawa T, Ando E, Clark GT, Enciso R. Influence of tongue/mandible volume ratio on oropharyngeal airway in Japanese male patients with obstructive sleep apnea. Oral Surg Oral Med Oral Pathol Oral Radiol Endod. 2011;111:239–324. doi: 10.1016/j.tripleo.2010.10.013. [DOI] [PMC free article] [PubMed] [Google Scholar]
- 39.Rizzatti-Barbosa CM, Ribeiro MC, Silva-Concilio LR, Di Hipolito O, Ambrosano GM. Is an elongated stylohyoid process prevalent in the elderly? A radiographic study in a Brazilian population. Gerodontology. 2005 Jun;22(2):112–115. doi: 10.1111/j.1741-2358.2005.00046.x. [DOI] [PubMed] [Google Scholar]
- 40.Ferrario VF, Sigurtá D, Daddona A, Dalloca L, Miani A, Tafuro F, Sforza C. Calcification of the stylohyoid ligament: incidence and morphoquantitative evaluations. Oral Surg Oral Med Oral Pathol. 1990 Apr;69(4):524–529. doi: 10.1016/0030-4220(90)90390-e. [DOI] [PubMed] [Google Scholar]
- 41.O Carroll MK. Calcification in the stylohyoid ligament. Oral Surg Oral Med Oral Pathol. 1984 Nov;58(5):617–621. doi: 10.1016/0030-4220(84)90089-6. [DOI] [PubMed] [Google Scholar]
- 42.Mupparapu M, Vuppalapati A. Ossification of Laryngeal Cartilages on Lateral Cephalometric Radiographs. The Angle Orthodontist. 2005;75(2):196–201. doi: 10.1043/0003-3219(2005)075<0192:OOLCOL>2.0.CO;2. [DOI] [PubMed] [Google Scholar]
- 43.Admassie D, Mekonnen A. Incidence of normal pineal and chroids plexus calcification on brain CT (computerized tomography) at Tikur Anbessa Teaching Hospital Addis Ababa, Ethiopia. Ethiop Med J. 2009 Jan;47(1):55–60. [PubMed] [Google Scholar]
- 44.Kwak R, Takeuchi F, Ito S, Kadoya S. Intracranial physiological calcification on computed tomography (Part 1): Calcification of the pineal region. No To Shinkei. 1988 Jun;40(6):569–574. [PubMed] [Google Scholar]
- 45.Daghighi MH, Rezaei V, Zarrintan S, Pourfathi H. Intracranial physiological calcifications in adults on computed tomography in Tabriz, Iran. Foli Morpho (Warsz.) 2007 May;66(2):115–119. [PubMed] [Google Scholar]
- 46.Freyschmidt J, Brossman J, Wiens J, Sternberg A. Borderlands of Normal and Early Pathological Findings in Skeletal Radiography. 5th ed. New York: Thieme; 2003. [Google Scholar]
- 47.Pornprasertsuk-Damrongsri S, Thanakun S. Carotid artery calcification detected on panoramic radiographs in a group of Thai population. Oral Surg Oral Med Oral Patho Oral Rad Endotology. 2006 Jan;101(1):110–115. doi: 10.1016/j.tripleo.2005.04.002. [DOI] [PubMed] [Google Scholar]
- 48.Celiker R, Gökçe-Kutsal Y, Eryilmaz M. Temporomandibular joint involvement in rheumatoid arthritis. Relationship with disease activity. Scand J Rheumatol. 1995;24(1):22–25. doi: 10.3109/03009749509095149. [DOI] [PubMed] [Google Scholar]