

Abstract
Most applications of therapeutic ultrasound (US) for intracellular delivery of drugs, proteins, DNA/ RNA and other compounds would benefit from efficient uptake of these molecules into large numbers of cells without killing cells in the process. In this study we tested the hypothesis that efficient intracellular uptake of molecules can be achieved with high cell viability after US exposure in vitro. A search of the literature for studies with quantitative data on uptake and viability yielded 26 published papers containing 898 experimental data points. Analysis of these studies showed that just 7.7% of the data points corresponded to relatively efficient uptake (>50% of cells exhibiting uptake). Closer examination of the data showed that use of Definity US contrast agent (as opposed to Optison) and elevated sonication temperature at 37°C (as opposed to room temperature) were associated with high uptake, which we further validated through independent experiments carried out in this study. Although these factors contributed to high uptake, almost all data with efficient uptake were from studies that had not accounted for lysed cells when determining cell viability. Based on retrospective analysis of the data, we showed that not accounting for lysed cells can dramatically increase the calculated uptake efficiency. We further argue that if all the data considered in this study were re-analyzed to account for lysed cells, there would be essentially no data with efficient uptake. We therefore conclude that the literature does not support the hypothesis that efficient intracellular uptake of molecules can be achieved with high cell viability after US exposure in vitro, which poses a challenge to future applications of US that require efficient intracellular delivery.
Keywords: Cell viability, Contrast agent, Drug delivery, Intracellular uptake efficiency, Therapeutic ultrasound
INTRODUCTION
Ultrasound (US) is used for a variety of medical applications and has the potential for use in many more (Ng and Liu 2002). Drug and gene delivery achieved using therapeutic US has received considerable attention both in vitro and in vivo (Azuma et al. 2003; Bekeredjian et al. 2003; Hynynen 2008; Liu et al. 2010; Miao et al. 2005; Mitragotri 2005; Pitt 2003). Such applications typically benefit from delivery of bioactive molecules into cells with high efficiency and without significant loss of cell viability. This study seeks to assess the ability of US to achieve the goal of efficient intracellular delivery by using a set of 898 experimental data points taken from 26 published studies to test the hypothesis that efficient intracellular uptake of molecules can be achieved with high cell viability after US exposure in vitro.
Mechanistically, it is not clear that efficient uptake can be achieved by US exposure. Like other methods of intracellular delivery, such as chemical methods like cationic lipids and physical methods like electroporation, there is usually a trade-off between high uptake and high viability (Barry 2004; Davalos et al. 2000; Osada and Kataoka 2006). Mild conditions preserve cell viability, but typically lead to low levels of uptake. Stronger conditions enable uptake into a large fraction of those cells that remain viable after the procedure but kill many cells in the process. For this reason, many studies have sought to optimize US conditions to find conditions that are gentle enough to maintain cell viability, but aggressive enough to efficiently load cells with molecules of interest.
In this study, we looked for papers in the literature that contain quantitative data measuring the fraction of cells with intracellular uptake and the fraction of cells remaining viable after US exposure, and found 26 such studies (Cochran and Prausnitz 2001; Forbes et al. 2011; Guzman et al. 2001, 2002, 2003; Hallow et al. 2007; Han et al. 2007; Hassan et al. 2010; Hutcheson et al. 2010; Karshafian et al. 2004, 2005, 2007, 2009, 2010; Keyhani et al. 2001; Kinoshita and Hynynen 2005; Lai et al. 2006; Larina et al. 2005; Li et al. 2008; Mehier-Humbert et al. 2005; Miller et al. 1999; Miller and Dou 2009; Sundaram et al. 2003; Tata et al. 1997; van Wamel et al. 2002). The 898 data points from these studies were collected using a variety of cell types and tissues, sizes of molecules and types of US apparatus and conditions.
We combined and replotted these data as uptake efficiency (i.e., the number of viable cells exhibiting uptake of a marker compound divided by the total number of cells originally in the sample) vs. cell viability (i.e., the number of viable cells divided by the total number of cells originally in the sample). Using this analysis, the highest possible uptake efficiency is equal to the cell viability because, by definition, only viable cells can be uptake cells. This study sought to find literature data exceeding a target of 50% uptake efficiency, which implicitly also required cell viabilities to be at least as large.
This analysis is strongly affected by correct determination of cell viability. To make this determination, some nonviable cells are detected as intact cells that are stained with a marker of nonviability, such as propidium iodide (PI). These nonviable cells are relatively easy to account for by flow cytometry, microscopy or other methods. Sometimes, however, cells can be lysed during US exposure and present as cellular debris. These nonviable cells are more difficult to account for, because each cell can be lysed into a variable number of pieces of debris. Not accounting for cells reduced to debris may underestimate the total number of cells killed by US exposure, which leads to an overestimate of both uptake efficiency and cell viability.
MATERIALS AND METHODS
Cell sample preparation
DU145 human prostate cancer cells (American Type Culture Collection, Manassas, VA, USA; item no. HTB-81) in RPMI-1640 medium (Cellgro, Mediatech, Herndon, VA, USA) were cultured as monolayers in a humidified atmosphere of 95% air and 5% CO2 at 37°C, as described previously (Liu et al. 2010). The medium was supplemented with 10% heat-inactivated fetal bovine serum (FBS; Atlanta Biologicals, Atlanta, GA, USA) and 1% penicillin/streptomycin (Cellgro).
DU145 cells were harvested by trypsin/EDTA (Cellgro) digestion, resuspended in RPMI-1640 medium at the final concentration of 1×10⁶ cells/mL and mixed with 10 mM FITC-labeled dextran (70 kDa, Sigma, St. Louis, MO, USA) and 2 vol% Optison (GE Healthcare, Princeton, NJ) or 0.1 vol% Definity (Bristol-Myers Squibb Medical Imaging, North Billerica, MA, USA) before US exposure. Cell concentration was determined by a Multisizer 3 Coulter Counter (Beckman Coulter, Fullerton, CA, USA).
Ultrasound apparatus
The US transducer was an immersible, focused, piezoceramic transducer (Sonic Concepts, Woodinville, WA, USA; model no. H-101) supplied with a matching resistance network allowing production of sound at 1 MHz, as described previously (Liu et al. 2010). The transducer had a diameter of 70 mm, a 52-mm focal length and a 1.5-mm focal width at half-amplitude (−6 dB). A sinewave was provided by two programmable waveform generators (Stanford Research Instruments, Sunnyvale, CA, USA, model no. DS345; and Agilent, Austin, TX, USA, model no. 33120A) and amplified by an RF broadband power amplifier (Electronic Navigation Industries, Rochester, NY, USA; model no. 3100LA).
The transducer was submerged in deionized and partially degassed water at room temperature (~23°C) or 37°C in a polycarbonate tank (30.5 × 29 × 37 cm) to sonicate a 375-μL sample of cells in suspension held within a disposable micropipette that was acoustically transparent (Samco, San Fernando, CA, USA). A 5-cmthick acoustic absorber (SC-501 Acoustic Rubber, Sonic Concepts) was placed opposite the transducer in the tank to minimize standing-wave formation. A three-axis positioning system (10-mm resolution, Velmex, Bloomfield, NY, USA) was mounted on top of the tank to position samples and a hydrophone at desired locations in the tank.
The desired location for sample placement in the acoustic field was found using a polyvinylidene fluoride membrane hydrophone (NTR Systems, Seattle, WA, USA; model no. HMA-0200) to be approximately 1 cm out of the focus toward the transducer. This location had a broader acoustic beam than at the focus, which enabled a more uniform acoustic exposure across the sample. The US transducer was calibrated vs. the peak-to-peak voltage of the signal by the hydrophone at a distance of 1 cm from the transducer. Sonication was carried out at the peak amplitude pressure of 0.39 MPa and the total treatment time of 1 s with a burst length of 0.25 ms and a duty cycle of 25%. The corresponding acoustic energy density was 1.3 J/cm2.
Quantification of bioeffects
After US exposure, samples were incubated at 37°C for 5 min and washed with phosphate-buffered saline (PBS) three times to remove extracellular FITC-dextran. A 5-min incubation time was used based on previous studies showing that cell membranes largely repair within that time (Schlicher et al. 2006). Cells were then resuspended in PBS. Propidium iodide (PI, Invitrogen, Carlsbad, CA, USA) was added to cell samples at a final concentration of 1 vol% to determine the cell viability after US exposure.
The uptake efficiency and cell viability were determined by a BD LSR benchtop flow cytometer (BD LSR, Becton Dickinson, San Jose, CA, USA) and data were analyzed by FCS Express V3 software (De Novo Software, Los Angeles, CA, USA), as described previously (Hallow et al. 2006). Typical analysis sampled approximately 10,000 cells. Samples were excited with a 488-nm laser to measure FITC-dextran (green fluorescence) with a 530/30-nm bandpass filter for emission. A 575/20-nm bandpass filter was used for emission to determine the number of intact cells lacking red fluorescence caused by PI staining compared with the background fluorescence of untreated control cells. Cell populations were first elucidated by gating, and histogram data were then analyzed to determine the percentage of cells with fluorescence greater than a threshold value based on untreated control cells (i.e., “uptake cells”).
Cell viability after US exposure was determined by dividing the concentration of viable cells in each sample after sonication by the concentration of viable cells in nonsonicated control samples. Cell concentration was determined as the number of viable cells counted by the flow cytometer in a given volume of solution. Because we operated the flow cytometer at a constant flow rate, cell viability was functionally determined as the number of viable cells detected in a sonicated sample within a given period of time divided by the number of viable cells detected in nonsonicated samples within the same period of time.
This approach to determining cell viability accounts for all cells rendered nonviable during sonication, including intact nonviable cells that are detected by the flow cytometer as PI-positive cells, as well as cells lysed into fragments or debris that are each detected by the flow cytometer as multiple small events, as addressed in previous studies (Hallow et al. 2006; Hutcheson et al. 2010). Some other studies in the literature have instead determined cell viability by accounting only for intact nonviable cells (e.g., PI-positive cells) as the dead-cell population and have not accounted for cells lysed during sonication. We believe the approach used in this study, which also accounts for the large number of cells that can be lysed during sonication, correctly determines cell viability, whereas the methods that do not account for these cells overestimate cell viability.
Statistical analysis of experimental data
A minimum of three replicates were performed for all the samples. Replicates were used for calculation of experimental means and standard deviations. Student’s t-test or analysis of variance (ANOVA) was applied to the data. A value of p < 0.05 was interpreted as significant.
Analysis of data from literature
Cell viability and uptake efficiency data from 26 different studies using a variety of cell types and tissues, sizes of molecules and types of US apparatus and conditions were combined and plotted as uptake efficiency vs. cell viability using the data reported in those studies. The papers and their corresponding methods are summarized in Table 1.
Table 1.
Summary of the methods used in the reference studies
| Reference | Cell/tissue type | Uptake molecules (MW) | US frequency |
Contrast agent used (concentration) |
Sonication temperature |
MI† | US energy density (J/cm2) |
Accounted for cell debris‡ |
|---|---|---|---|---|---|---|---|---|
| Karshafian et al. 2010 | KHT-C murine fibrosarcoma cells | Dextrans (10 kDa, 70 kDa, 500 kDa, 2 MDa) |
500 kHz | Definity (0.067–13.2 vol%), Optison (0.067–13.2 vol%) |
37°C | 0.2–0.8 | 1.5–32 | N |
| Hutcheson et al. 2010 | DU145 human prostate cancer cells | Calcein (623 Da) | 24 kHz | None | RT* | 2.3, 3.4 | 8.6, 19.4 | Y |
| Hallow et al. 2007 | Porcine artery (endothelial and smooth muscle cells) |
TO-PRO-1 (645 Da) | 1.1 MHz | Optison (1.7 vol%) | 37°C | 0.7–2.4 | 5.0–630 | Y |
| Hallow et al. 2006 | DU145 human prostate cancer cells, human aortic smooth muscle cells (AoSMC) |
Calcein (623 Da) | 1.1, 3.1 MHz | Optison (0.25, 1.7, 14.3 vol%) | RT | 0.5–2 | 0.03–405 | Y |
| Mehier-Humbert et al. 2005a | Rat mammary carcinoma cells | Dextrans (77 kDa, 167 kDa, 464 kDa) |
1.15 MHz | Fluorocarbon phospholipid-stabilized microbubbles (25–30 particles/cell) |
37°C | 0.37 | 27 | N |
| Larina et al. 2005 | MCF7 human breast adenocarcinoma, SK-BR-3 breast adenocarcinoma, HepG2 hepatocellular carcinoma, HeLa cervix epithelial adenocarcinoma, A549 lung carcinoma, T84 colorectal carcinoma, KM20 colon carcinoma |
Dextrans (10 kDa, 70 kDa, 2 MDa) |
3 MHz | Optison (20 vol%) | 37°C | 0.17 | 180 | N |
| Guzman et al. 2003 | DU145 human prostate cancer cells | Calcein (623 Da) | 500 kHz | Optison (0.0056 - 14.4 vol%) | RT | 0.9–4.2 | 2–817 | Y |
| Guzman et al. 2002 | DU145 human prostate cancer cells | Dextrans (42 kDa, 464 kDa), BSA (66 kDa), Calcein (623 Da) |
500 kHz | Optison (1.7 vol%) | RT | 0.9–4.2 | 2–817 | Y |
| Keyhani et al. 2001 | DU145 human prostate cancer cells | Calcein (623 Da) | 24 kHz | None | RT | 3–5.86 | 1–114 | Y |
| Guzman et al. 2001 | DU145 human prostate cancer cells, aoric smooth muscle cells |
Calcein (623 Da) | 500 kHz | Optison (1.7 vol%) | RT | 0.9–4.2 | 2–817 | Y |
| Cochran and Prausnitz 2001 | DU145 human prostate cancer cells | Calcein (623 Da) | 24 kHz | None | RT | 0.65 | 0.003–32 | Y |
| Miller et al. 1999 | Chinese hamster ovary cells (CHO) | Dextran (850 kDa) | 2.25 MHz | Albunex (0–20 vol%) | 37°C | 0.13 | 80 | Y |
| Tata et al. 1997 | LnCap and PC-3 human prostate cancer cells |
Plasmid DNA (~3 MDa) | 932.7 kHz | None | 37°C | 0.1 | 7.9 | N |
| Li et al. 2008 | HeLa cells | Dextran (42 kDa) | 1 MHz | SonoVue (4.68 × 10⁷ bubbles/ml), or none |
RT | 0.34 | 270 | N |
| Miller and Dou 2009 | HL-60 cells, CHO cells | Dextran (500kDa) | 2.25 MHz | Definity (0.1 vol%) | 37°C | 0–0.6 | 160, 640, 1440 | Y |
| Han et al. 2007 | F. nucleatum bacteria | Dextran (70 kDa) | 1 MHz | Definity (33 vol%), or none | RT | 1 | 375 | Y |
| Karshafian et al. 2009 | KHT-C cells | Dextran (70 kDa) | 500 kHz | Definity (3.3 vol%) | 37°C | 0–0.8 | 3.12 | N |
| Forbes et al. 2011 | CHO cells | Dextran (500kDa) | 0.92, 3.2, 5.6 MHz |
Definity (0.15 vol%) | RT | 0–4.7 | 0–1.1 | N |
| Sundaram et al. 2003 | 3T3 mouse cells | Calcein (623 Da) | 20, 57, 76, 93 kHz |
None | RT | NA | 0–105 | N |
| Hassan et al. 2010 | HeLa cells | Dextran (4 kDa) | 1 MHz | Levovist (1 mg/mL) | RT | 0.08–0.44 | 1.05–21 | N |
| Lai et al. 2006 | HeLa cells | DNA-FITC (~3 kDa) | 1 MHz | Levovist (1.12–11.2 × 10⁶ bubbles/mL) |
RT | 0.48–1.32 | 0–3.5 | Y |
| Karshafian et al. 2007 | KHT-C cells | Dextran (70 kDa) | 500 kHz, 2, 5 MHz |
Definity (3.5 vol%) | 37°C | 0–.65 | 0–124 | N |
| van Wamel et al. 2002 | CHO cells | Dextran (70 kDa) | 1 MHz | None | 37°C | 0.1–1.4 | 0–44 | Y |
| Karshafian et al. 2004 | KHT-C cells | Dextran (70 kDa) | 1, 3.5 MHz | Optison (1–10 vol%), or none | 37°C | 0.1–0.9 | 0–387 | N |
| Karshafian et al. 2005 | KHT-C cells | Dextran (10 kDa–2 MDa) | 500 kHz | Optison (7 vol%), or Definity (3.5 vol%) |
37°C | 0.18–0.8 | 6–125 | N |
| Kinoshita and Hynynen 2005 | HeLa cells | Calcein (623 Da) | 1.696 MHz | Optison (2 vol%) | RT | 0.5 | 1.8–73 | N |
RT, room temperature.
MI, mechanical index.
Y, yes; N, no.
RESULTS
Uptake efficiency vs. cell viability
Data from 26 published papers were combined and replotted in Figure 1 to assess the ability of US to efficiently enable uptake of molecules into cells in vitro. The diagonal line on the graph corresponds to conditions where uptake efficiency equals cell viability, above which no data can lie because uptake efficiency can by definition never exceed cell viability. At very low viability, the uptake efficiency is close to this line, which means that the few remaining live cells have molecule uptake. At higher viability, the uptake efficiency generally diverts from the line, which means that although the US exposure did not cause as much cell death, only some of the live cells had molecule uptake.
Fig. 1.
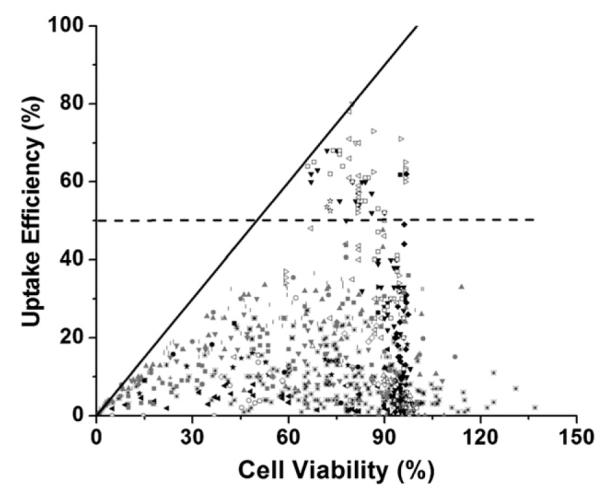
Intracellular uptake efficiency vs. cell viability after US exposure. Data points were obtained from literature: (a) + (Tata et al. 1997); × (Miller et al. 1999); (Cochran and Prausnitz 2001); |,
  ,
,  , (Guzman et al. 2001, 2002, 2003);
  (Keyhani et al. 2001); ◁ (Larina et al. 2005); ✫ (Mehier-Humbert et al. 2005); *,
  (Hallow et al. 2006, 2007); – (Hutcheson et al. 2010); ◁ (Karshafian et al. 2010); ∎ (Li et al. 2008); ◯ (van Wamel et al. 2002); ◆ (Forbes et al. 2011); ◀ (Sundaram et al. 2003); ● (Miller and Dou 2009); ▶ (Hassan et al. 2010); ◻, ▽, (Karshafian et al. 2007, 2005); ★ (Lai et al. 2006); ▽ (Karshafian et al. 2009); ▲ (Han et al. 2007); ◇ (Kinoshita and Hynynen 2005); △ (Karshafian et al. 2004). Each data point represents the average of n ≥3 replicates collected at various experimental conditions as described in the original papers and summarized in Table 1. The solid line is where uptake efficiency equals cell viability. The dashed line is where the uptake efficiency equals 50%.
As a general measure of efficiency, we defined data with >50% of cells exhibiting uptake as “efficient” uptake (see dashed line in Fig. 1). The data in Figure 1 show that achieving this level of efficiency appears to be difficult. Among the 898 data points, there are just 69 (i.e., 7.7% of the data points) showing “efficient” uptake. It is notable that the vast majority of data points (i.e., 92.3%) correspond to “inefficient” uptake (i.e., <50% uptake efficiency). Thus, US conditions that enable efficient uptake appear to be rare.
To characterize the conditions that lead to efficient uptake, we considered several factors that may be associated with these data points: the molecule size and other properties, the US conditions used, the cell type, the US contrast agent, the sonication temperature and the method of calculating cell viability (i.e., whether it accounted for cell debris generated by lysed cells). The 26 papers that served as the source of these data points used a variety of cell types and tissues (e.g., DU145 human cells, rat mammary carcinoma cells, porcine carotid artery endothelium); molecule sizes (e.g., calcein [623 Da] and dextrans [10 kDa to 2 MDa]); US conditions (e.g., acoustic energy density up to ~800 J/cm2 and mechanical index up to ~6); US contrast agents (e.g., Albunex, Optison, Definity) and sonication temperatures (room temperature 37°C); as well as differences in the methods to calculate cell viability (i.e., accounting for cell debris or not). These characteristics of each study are summarized in Table 1.
The data in Figure 1 are replotted in Figure 2 with a coloring scheme that facilitates visually identifying which characteristics are most associated with efficient uptake conditions. For example, in Figure 2a, black data points correspond to sonication at low-energy density (<100 J/cm2) and white data points correspond to sonication at high-energy density (>100 J/cm2). Visual observation suggests no association of either subset of the data with efficient uptake cells above the dashed line. The remaining graphs in Figure 2 allow comparisons on the basis of other characteristics.
Fig. 2.

Intracellular uptake efficiency vs. cell viability after US exposure. Data points were obtained from literature, as described in Fig. 1 and Table 1. The solid line is where uptake efficiency equals cell viability. The dashed line is where the uptake efficiency equals 50%. The graphs exhibit the same data presented to distinguish between experiments using (a) US energy density less than (●) and higher than (◇)100 J/cm2; (b) mechanical index less than (●) and higher than (◇) 0.7; (c) megahertz US (●) and kilohertz US (◇); (d) large molecules (●, MW >1 kDa, e.g., dextran, BSA and DNA) and small molecules (◇, MW <1 kDa, e.g., calcein); (e) KHCT cells (●), prostate cancer cells (◇), CHO cells (B), AoSMC cells (□), rat mammary cells (△), ex vivo artery (×) and other cell lines (+); (f) 37°C (●) and room temperature (◇); (g) Definity (●), Optison (◇) and other contrast agents (×); and (h) analysis not accounting (●) and accounting (◇) for cell debris to calculate cell viability.
The data in Figure 2 are summarized in Figure 3 in two different ways. In Figure 3a, we considered all the data points with a given characteristic and identified the fraction of data points that are in the efficient-uptake group. This analysis identifies whether certain characteristics are associated with efficient uptake data. In Figure 3b, we considered only the 69 efficient uptake data points and identified the fraction of these data points that have a given characteristic. This analysis identifies whether efficient uptake data share common characteristics.
Fig. 3.

Identification of US exposure characteristics associated with efficient intracellular uptake. (a) The fraction of data points in the efficient uptake group found among the data points having the given exposure characteristics. (b) The fraction of data points with given US exposure characteristics found among the data points in the efficient uptake group (i.e., uptake efficiency .50%). These graphs were generated based on the data shown in Figure 2.
As shown in Figures 2 and 3, there was no apparent discrimination between low (<100 J/cm2) vs. high (>100 J/cm2) acoustic energy density, low (<0.7) vs. high (>0.7) mechanical index or low (<1 MHz) vs. high (≥1 MHz) US frequency associated with efficient uptake data. Among the uptake molecules, there was a greater association of high (>1 kDa) vs. low (<1 kDa) molecular weight compounds and efficient uptake. We believe this difference, however, is an artifact of the dataset, in which the studies using conditions associated with efficient uptake happened to use high-molecularweight dextrans. The literature shows that uptake of high-molecular-weight molecules is not easier or more extensive than low-molecular-weight molecules (Guzman et al. 2002; Karshafian et al. 2010; Larina et al. 2005; Mehier-Humbert et al. 2005). Moreover, the inert compounds used in these studies are not expected to affect viability. Considering cell type, we believe that the efficient uptake data points are not associated with a particular cell type, although several studies from one research group generating much of the efficient uptake data happened to use KHT-C cells.
Although these first four characteristic do not appear to give valuable clues, the remaining three characteristics are more informative. For example, efficient uptake data are associated with sonication at an elevated temperature of 37°C rather than room temperature. We found that 25% of the data collected at 37°C correspond to efficient uptake (Fig. 3a) and 97% of the 69 efficient uptake data were generated at 37°C (Fig. 3b).
Efficient uptake data are also associated with use of Definity as a contrast agent. We found that 28% of the data from studies using Definity correspond to efficient uptake, whereas only 2.8% of the data from studies using Optison are above the uptake threshold (Fig. 3a). Among the 69 efficient uptake data points, 71% are from studies using Definity and 23% are from studies using Optison (Fig. 3b), suggesting that Definity and Optison may both be effective.
Finally, there was a strong association between efficient uptake data and whether the cell viability analysis accounted for cell debris. We found that 22% of data that did not account for cell debris correspond to efficient uptake, whereas none of the data that accounted for cell debris were above the uptake threshold (Fig. 3a). Among the 69 efficient uptake data, 100% did not account for cell debris (Fig. 3b). We believe this final observation that all efficient uptake data did not account for cell debris to be especially noteworthy.
The preceding analysis suggests that certain characteristics are associated with efficient uptake. This analysis, however, is not a rigorous statistical study because (i) it was based on a convenience sample of published data rather than a dataset designed specifically for this analysis and (ii) in most cases, we did not have access to the original data, but carried out this analysis by reading data from graphs provided in the published papers to the best of our abilities. Nonetheless, this analysis suggests that temperature, US contrast agent and method of determining cell viability are worth further examination as possible predictors of efficient uptake.
The effect of temperature and US contrast agents on uptake efficiency
To test the effect of sonication temperature and the type of contrast agent on uptake efficiency, we exposed DU145 prostate cancer cells incubated with FITC-dextran (70 kDa) as the uptake marker compound to 1 MHz US. As shown in Figure 4, US exposure at 37°C resulted in higher uptake efficiency in the presence of Definity (but not Optison). Definity led to higher uptake efficiency compared with Optison at both temperatures. Under all four of these sonication conditions, similar cell viability (~55%, p > 0.05) was achieved.
Fig. 4.
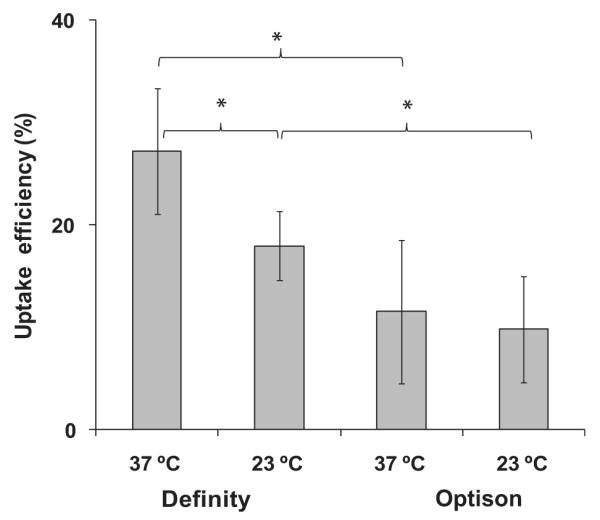
The effect of temperature and US contrast agent on intracellular uptake efficiency. DU145 prostate cancer cells were exposed to US as described in Materials and Methods at 37°C or 23°C with 0.1 vol% Definity or 2 vol% Optison (*p , 0.05, n 5 3 replicates, data points show average 6 standard deviation).
Figure 4 shows that increasing temperature to 37°C in the presence of Definity increased uptake efficiency by 51 ± 34% relative to cells sonicated at room temperature. This is in agreement with previous studies that showed enhanced uptake at elevated temperature (Kim et al. 1996; Nozaki et al. 2003; Poling et al. 2001; Zarnitsyn and Prausnitz 2004). Changing temperature in the presence of Optison did not have a significant effect on uptake efficiency.
Figure 4 also shows that 0.1% Definity led to 83–136% greater uptake efficiency than 2% Optison depending on the temperature. These concentrations were selected to provide an equal bubble concentration in both cases (~1.2 × 10⁷ bubbles/mL), because the native microbubble concentration in Definity is 20-fold higher than that in Optison (Karshafian et al. 2010). These concentrations were also in the range of what the reference studies used. Among the data from the prior studies using Optison (concentration spanned 0.067 to 20 vol%), 75% used a concentration of ~2% (0.67 to 3.3 vol%). Among the data from the prior studies using Definity (concentration spanned 0.067 to 13.2 vol%), 12% were using the concentration of ~0.1% (0.067 to 0.67 vol%).
The comparison between US contrast agents is complicated. Different contrast agent concentrations and different US frequencies and acoustic pressure amplitudes may lead to different results. Definity showed higher uptake efficiency in some previous studies (King et al. 2010; Li et al. 2004; Miller and Dou 2004; Moran et al. 2000). However, some other studies did not find statistically significant differences between these two contrast agents (Chen et al. 2002) or reported that Optison produced a larger effect at the same acoustic pressure (McDannold et al. 2007).
Accounting for cell debris in the calculation of uptake efficiency and viability
According to Figure 3, not accounting for cell debris in the calculation of cell viability is strongly associated with efficient uptake. Not accounting for cell debris produces artificially high cell viability, but also produces artificially high uptake efficiency, because cell debris are by definition nonuptake cells. We therefore sought to quantify the effect of not accounting for cell debris. It would be ideal to reanalyze the 69 efficient-uptake data points accounting for cell debris to see how much it would lower the uptake efficiency. However, we do not have access to those original data and even if we did, it would be difficult to account for cell debris if the data collection method was not designed for that purpose. However, we do have access to the original data for a portion of the data points that were generated by accounting for cell debris (i.e., data from our researchgroup) and can work backwards to find out how much the uptake efficiency and cell viability would be increased if cell debris had not been accounted for.
Using this approach, we replotted 280 data points from a large study using DU145 prostate cancer cells with calcein as the uptake marker using 1.1 and 3.1 MHz US in Figure 5a (Hallow et al. 2006). In this figure, these experimental data were plotted as white points using analysis that accounted for cell debris and as black points using analysis that did not account for cell debris. This graph shows that the white data points are all below the dashed efficient uptake threshold line and exhibit a broad range of cell viabilities. In contrast, the black data points are compressed within a narrower window of cell viability values and, notably, a fraction of the data points shifted above the efficient uptake threshold.
Fig. 5.

The effect of accounting for lysed cells when determining cell viability and uptake efficiency. (a) The uptake efficiency vs. cell viability after US exposure determined by accounting for cells lysed during US exposure (>, data obtained directly from Hallow et al. (2006)) and without accounting for lysed cells (C, reanalysis of data from Hallow et al. (2006)). Each data point represents the average of n $3 replicates. The solid line is where uptake efficiency equals cell viability. The dashed line is where uptake efficiency equals 50%. The differences between (b) intracellular uptake and (●) cell viability calculated with and without accounting for lysed cells. Differences were determined by subtracting the values calculated accounting for lysed cells from values calculated without accounting for lysed cells.
We next calculated the difference in uptake efficiency and cell viability for each of the pairs of data points with and without accounting for cell debris, as shown in Figure 5 (b, c). These graphs show that both uptake efficiency and cell viability can be increased by tens of percent if cell debris is not accounted for. In addition, the degree of deviation increases with increasing energy density for both uptake efficiency and cell viability (ANOVA, p < 0.01). Although the data are not explicitly shown in the graph, the absolute value for uptake efficiency (calculated without accounting for cell debris) also increases with increasing energy density (ANOVA, p < 0.05), which means that the greatest deviations are seen at the conditions with the highest uptake efficiency.
DISCUSSION
Intracellular uptake after US exposure is inefficient
Our analysis of 898 data points generated in 26 different studies (i.e., all studies we could find in the literature with quantitative uptake and viability data) from a number of different research groups (including ours) using a broad range of experimental conditions demonstrated that efficient uptake into cells in vitro is rare. Among these data, only 7.7% of experiments exhibited an uptake efficiency >50% according to the original data in the published papers, and almost no data show uptake efficiency close to 100%. Our further analysis suggests that if all data were analyzed to account for lysed cells, and thereby express uptake efficiency on the basis of all cells exposed to US, then there would be essentially no data points with high efficiency.
Strategies to address low efficiency of uptake
These observations present a challenge to the therapeutic US research community that typically seeks to achieve efficient intracellular uptake. The community can respond in a number of possible ways.
We might work harder to optimize US exposure conditions to increase efficiency, such as operating at elevated temperature (37°C) or using preferred US contrast agents (Definity). However, extensive optimization has already been carried out and reported in the literature, but efficient uptake has not yet been achieved. Additional optimization may not be effective.
We might recognize the limitations of translating in vitro findings into the in vivo environment and expect that uptake efficiency will be higher in vivo, where most applications seek to operate. There is evidence in the literature that cell viability is higher after US exposure in vivo (Danialou et al. 2002; Li et al. 2003), which suggests that more aggressive US conditions can be used in vivo to induce more efficient uptake while still maintaining cell viability. Because quantitative studies of uptake efficiency and cell viability in vivo are not available in the literature, this hypothesis remains to be fully tested.
We might limit applications of US for intracellular delivery to those where efficiency is not important such that uptake by only a relatively small fraction of cells is sufficient. Examples of this might include certain types of gene therapy, DNA vaccination and diagnostic scenarios.
We might similarly limit applications to those where cell viability is not important such that efficient uptake among those cells remaining viable after US exposure can be achieved at low cell viability. Examples of this might include in vitro applications where a pure cell population with uptake or transfection is desired and can subsequently be expanded to compensate for cell loss during sonication or in vivo applications, such as cancer chemotherapy, where cell death is the desired outcome.
Alternate strategies to increase uptake efficiency beyond US
Analysis from a mechanistic perspective may provide alternate strategies to increase uptake efficiency. US is believed to act indirectly on cells to increase uptake (Kimmel 2006; Miller et al. 1996). US first generates cavitation activity. These cavitation bubbles oscillate and, under most effective conditions, collapse to produce a shockwave, among other effects. The shockwave is believed to impact cells such that the plasma membrane is opened and subsequently resealed by the cell. While the plasma membrane is open, molecules can enter the cell.
Shockwaves from cavitation activity are emitted from point sources and dissipate during propagation away from the bubble (Kimmel 2006; Miller et al. 1996). Thus cells close to a bubble experience a stronger shockwave compared with cells located farther away. Previous studies have suggested that cells located too close to a collapsing cavitation bubble may be killed, those located a suitable distance away may experience intracellular uptake while remaining viable and those located still farther away have no noticeable effects (Guzman et al. 2003; Sundaram et al. 2003). Thus the spatial heterogeneity of shockwave pressure leads to heterogeneous bioeffects, including cells with uptake and cells that die. This heterogeneity may explain the difficulty to achieve efficient uptake using shockwaves generated by US-mediated cavitation.
A limitation of emitting shockwaves from transient cavitation activity is that cavitation bubble collapse occurs only above a threshold driving pressure. At low pressure, cavitation bubbles oscillate stably and only at higher pressure will they collapse to emit shockwaves that disrupt cell membranes for intracellular delivery. Thus it is difficult to have a “gentle” collapse because bubble collapse occurs only above this threshold. As a result, it appears that cell death always accompanies intracellular uptake. Although certain bioeffects, notably increased gene transfection, can be enhanced by stable cavitation activity (Mehier-Humbert et al. 2007; Newman and Bettinger 2007), it is not clear that the mechanism involves breaching the cell’s plasma membrane.
Given that interaction of cells with shockwaves is believed to be mechanistically responsible for intracellular uptake, we might consider other methods to generate a more controlled and “gentle” shockwave that does not cause much cell death. A more “gentle” shockwave may require lower peak pressure, slower pressure rise or other characteristics that are not yet known. This may be difficult to achieve using US-mediated cavitation because of its threshold nature, but studies in the literature offer possible alternatives.
One approach may involve shockwaves emitted from laser-ablation of a target membrane. In this photoacoustic approach, ultraviolet radiation leads to decomposition of polymers to small fragments. Although small, these fragments move away from the surface at high speed and generate high-peak stress waves (Srinivasan 1986). It has been demonstrated that the peak stress necessary for efficient cellular uptake is lower than that necessary for cell injury (Doukas et al. 1993), and the degree of cell injury is dependent on the rise time of the photomechanical waves (Doukas et al. 1995). This approach of generating shockwaves has been shown to enable intracellular uptake efficiency up to 55% with minimal damage to cells by using optimal parameters (Kodama et al. 2000, 2002). This approach has also been applied to increasing permeability of skin (Lee et al. 2001), cornea (Dehm et al. 1986) and tumors (Flotte et al. 1993; Holmes et al. 1990).
Another photoacoustic approach involves laser excitation of carbon nanoparticles. Here the near-infrared laser heats the carbon nanoparticles, which drives a chemical reaction between the carbon and surrounding water, C(s) + H2O(l) → H2(g) + CO(g) (Chen and Diebold 1995). By using a pulsed laser, the total energy absorbed by each nanoparticle during each pulse determines the extent of chemical reaction and thereby the bubble size. During each pulse, the bubble grows. After the laser turns off, the bubble collapses. In this way, bubble size and associated shockwave emission upon collapse can be carefully controlled. Using this approach, up to 90% uptake efficiency by cells has been reported with almost no loss of cell viability (Chakravarty et al. 2010).
Results from these two sets of photoacoustic studies demonstrate that shockwave conditions exist that are strong enough to permeabilize cells, but not so strong that they kill them. In addition to these examples, there are other ways to generate controlled shockwaves that may likewise be able to achieve this balanced effect. However, of significance to the ultrasound community, it is not clear that shockwaves generated by acoustic cavitation have been shown yet to achieve this balance.
CONCLUSIONS
A retrospective analysis of 898 data points from 26 different studies shows that efficient uptake of molecules by cells in vitro is rare. In most cases, <50% of cells exposed to US exhibit uptake and, if literature data are reanalyzed to account for lysed cells, it appears that essentially no experimental conditions in the literature yield efficient uptake. Elevated temperature (37°C) or preferred US contrast agents (Definity) can increase uptake efficiency. When determining uptake efficiency on the basis of all cells exposed to US, it is important to account for lysed cells among the nonviable cell population. Altogether, these findings impose constraints on possible applications of US-mediated delivery into cells, which may be addressed by improved methods of generating shockwaves that may not involve acoustic cavitation.
Acknowledgments
The authors thank Dr. Daniel Hallow for providing the original data for analysis in this study and Ms. Donna Bondy for administrative support.—This work was supported in part by the National Institutes of Health.
REFERENCES
- Azuma H, Tomita N, Kaneda Y, Koike H, Ogihara T, Katsuoka Y, Morishita R. Transfection of NFkappaB-decoy oligodeoxynucleotides using efficient ultrasound-mediated gene transfer into donor kidneys prolonged survival of rat renal allografts. Gene Ther. 2003;10:415–425. doi: 10.1038/sj.gt.3301882. [DOI] [PubMed] [Google Scholar]
- Barry PA. Efficient electroporation of mammalian cells in culture. Methods Mol Biol. 2004;245:207–214. doi: 10.1385/1-59259-649-5:207. [DOI] [PubMed] [Google Scholar]
- Bekeredjian R, Chen S, Frenkel PA, Grayburn PA, Shohet RV. Ultrasound-targeted microbubble destruction can repeatedly direct highly specific plasmid expression to the heart. Circulation. 2003;108:1022–1026. doi: 10.1161/01.CIR.0000084535.35435.AE. [DOI] [PubMed] [Google Scholar]
- Chakravarty P, Qian W, El-Sayed MA, Prausnitz MR. Delivery of molecules into cells using carbon nanoparticles activated by femtosecond laser pulses. Nat Nanotechnol. 2010;5:607–611. doi: 10.1038/nnano.2010.126. [DOI] [PMC free article] [PubMed] [Google Scholar]
- Chen HX, Diebold G. Chemical generation of acoustic-waves—A giant photoacoustic effect. Science. 1995;270:963–966. [Google Scholar]
- Chen Q, Zagzebski J, Wilson T, Stiles T. Pressure-dependent attenuation in ultrasound contrast agents. Ultrasound Med Biol. 2002;28:1041–1051. doi: 10.1016/s0301-5629(02)00546-x. [DOI] [PubMed] [Google Scholar]
- Cochran SA, Prausnitz MR. Sonoluminescence as an indicator of cell membrane disruption by acoustic cavitation. Ultrasound Med Biol. 2001;27:841–850. doi: 10.1016/s0301-5629(01)00382-9. [DOI] [PubMed] [Google Scholar]
- Danialou G, Comtois AS, Dudley RW, Nalbantoglu J, Gilbert R, Karpati G, Jones DH, Petrof BJ. Ultrasound increases plasmidmediated gene transfer to dystrophic muscles without collateral damage. Mol Ther. 2002;6:687–693. [PubMed] [Google Scholar]
- Davalos R, Huang Y, Rubinsky B. Electroporation: Bio-electrochemical mass transfer at the nano scale. Microscale Therm Eng. 2000;4:147–159. [Google Scholar]
- Dehm EJ, Puliafito CA, Adler CM, Steinert RF. Corneal endothelial injury in rabbits following excimer laser ablation at 193 and 248 nm. Arch Ophthalmol. 1986;104:1364–1368. doi: 10.1001/archopht.1986.01050210118037. [DOI] [PubMed] [Google Scholar]
- Doukas AG, McAuliffe DJ, Flotte TJ. Biological effects of laser-induced shock waves: Structural and functional cell damage in vitro. Ultrasound Med Biol. 1993;19:137–146. doi: 10.1016/0301-5629(93)90006-a. [DOI] [PubMed] [Google Scholar]
- Doukas AG, McAuliffe DJ, Lee S, Venugopalan V, Flotte TJ. Physical factors involved in stress-wave-induced cell injury: The effect of stress gradient. Ultrasound Med Biol. 1995;21:961–967. doi: 10.1016/0301-5629(95)00027-o. [DOI] [PubMed] [Google Scholar]
- Flotte TJ, Anderson T, Mcauliffe DJ, Hasan T, Doukas A. Laser-induced enhancement of drug cytotoxicity—A new approach to cancertherapy. P Soc Photo-Opt Ins. 1993;1882:122–129. [Google Scholar]
- Forbes MM, Steinberg RL, O’Brien WD., Jr Frequency-dependent evaluation of the role of definity in producing sonoporation of Chinese hamster ovary cells. J Ultrasound Med. 2011;30:61–69. doi: 10.7863/jum.2011.30.1.61. [DOI] [PMC free article] [PubMed] [Google Scholar]
- Guzman HR, McNamara AJ, Nguyen DX, Prausnitz MR. Bioeffects caused by changes in acoustic cavitation bubble density and cell concentration: A unified explanation based on cell-to-bubble ratio and blast radius. Ultrasound Med Biol. 2003;29:1211–1222. doi: 10.1016/s0301-5629(03)00899-8. [DOI] [PubMed] [Google Scholar]
- Guzman HR, Nguyen DX, Khan S, Prausnitz MR. Ultrasound-mediated disruption of cell membranes. II. Heterogeneous effects on cells. J Acoust Soc Am. 2001;110:597–606. doi: 10.1121/1.1376130. [DOI] [PubMed] [Google Scholar]
- Guzman HR, Nguyen DX, McNamara AJ, Prausnitz MR. Equilibrium loading of cells with macromolecules by ultrasound: Effects of molecular size and acoustic energy. J Pharm Sci. 2002;91:1693–1701. doi: 10.1002/jps.10156. [DOI] [PubMed] [Google Scholar]
- Hallow DM, Mahajan AD, McCutchen TE, Prausnitz MR. Measurement and correlation of acoustic cavitation with cellular bioeffects. Ultrasound Med Biol. 2006;32:1111–1122. doi: 10.1016/j.ultrasmedbio.2006.03.008. [DOI] [PubMed] [Google Scholar]
- Hallow DM, Mahajan AD, Prausnitz MR. Ultrasonically targeted delivery into endothelial and smooth muscle cells in ex vivo arteries. J Control Release. 2007;118:285–293. doi: 10.1016/j.jconrel.2006.12.029. [DOI] [PMC free article] [PubMed] [Google Scholar]
- Han YW, Ikegami A, Chung P, Zhang L, Deng CX. Sonoporation is an efficient tool for intracellular fluorescent dextran delivery and onestep double-crossover mutant construction in Fusobacterium nucleatum. Appl Environ Microbiol. 2007;73:3677–3683. doi: 10.1128/AEM.00428-07. [DOI] [PMC free article] [PubMed] [Google Scholar]
- Hassan MA, Buldakov MA, Ogawa R, Zhao Q-L, Furusawa Y, Kudo N, Kondo T, Riesz P. Modulation control over ultrasound-mediated gene delivery: Evaluating the importance of standing waves. J Control Release. 2010;141:70–76. doi: 10.1016/j.jconrel.2009.08.020. [DOI] [PubMed] [Google Scholar]
- Holmes RP, Yeaman LI, Li WJ, Hart LJ, Wallen CA, Woodruff RD, McCullough DL. The combined effects of shock waves and cisplatin therapy on rat prostate tumors. J Urol. 1990;144:159–163. doi: 10.1016/s0022-5347(17)39401-6. [DOI] [PubMed] [Google Scholar]
- Hutcheson JD, Schlicher RK, Hicks HK, Prausnitz MR. Saving cells from ultrasound-induced apoptosis: Quantification of cell death and uptake following sonication and effects of targeted calcium chelation. Ultrasound Med Biol. 2010;36:1008–1021. doi: 10.1016/j.ultrasmedbio.2010.03.011. [DOI] [PMC free article] [PubMed] [Google Scholar]
- Hynynen K. Ultrasound for drug and gene delivery to the brain. Adv Drug Deliv Rev. 2008;60:1209–1217. doi: 10.1016/j.addr.2008.03.010. [DOI] [PMC free article] [PubMed] [Google Scholar]
- Karshafian R, Bevan PD, Burns PN. Microbubble potentiated changes in cell permeability and viability. 2004 IEEE Ultrason Symp. 2004;1-3:1812–1815. [Google Scholar]
- Karshafian R, Samac S, Banerjee M, Bevan PD, Burns PN. Ultrasound-induced uptake of different size markers in mammalian cells. IEEE Ultrasonics Symp. 2005;1:13–16. [Google Scholar]
- Karshafian R, Bevan PD, Samac S, Burns PN. The effect of acoustic exposure parameters on cell membrane permeabilisation by ultrasound and microbubbles. Aip Conf Proc. 2007;911:498–504. [Google Scholar]
- Karshafian R, Bevan PD, Williams R, Samac S, Burns PN. Sonoporation by ultrasound-activated microbubble contrast agents: Effect of acoustic exposure parameters on cell membrane permeability and cell viability. Ultrasound Med Biol. 2009;35:847–860. doi: 10.1016/j.ultrasmedbio.2008.10.013. [DOI] [PubMed] [Google Scholar]
- Karshafian R, Samac S, Bevan PD, Burns PN. Microbubble mediated sonoporation of cells in suspension: clonogenic viability and influence of molecular size on uptake. Ultrasonics. 2010;50:691–697. doi: 10.1016/j.ultras.2010.01.009. [DOI] [PubMed] [Google Scholar]
- Keyhani K, Guzman HR, Parsons A, Lewis TN, Prausnitz MR. Intracellular drug delivery using low-frequency ultrasound: quantification of molecular uptake and cell viability. Pharm Res. 2001;18:1514–1520. doi: 10.1023/a:1013066027759. [DOI] [PubMed] [Google Scholar]
- Kim HJ, Greenleaf JF, Kinnick RR, Bronk JT, Bolander ME. Ultrasound-mediated transfection of mammalian cells. Hum Gene Ther. 1996;7:1339–1346. doi: 10.1089/hum.1996.7.11-1339. [DOI] [PubMed] [Google Scholar]
- Kimmel E. Cavitation bioeffects. Crit Rev Biomed Eng. 2006;34:105–161. doi: 10.1615/critrevbiomedeng.v34.i2.10. [DOI] [PubMed] [Google Scholar]
- King DA, Malloy MJ, Roberts AC, Haak A, Yoder CC, O’Brien WD., Jr Determination of postexcitation thresholds for single ultrasound contrast agent microbubbles using double passive cavitation detection. J Acoust Soc Am. 2010;127:3449–3455. doi: 10.1121/1.3373405. [DOI] [PMC free article] [PubMed] [Google Scholar]
- Kinoshita M, Hynynen K. Intracellular delivery of Bak BH3 peptide by microbubble-enhanced ultrasound. Pharm Res. 2005;22:716–720. doi: 10.1007/s11095-005-2586-7. [DOI] [PubMed] [Google Scholar]
- Kodama T, Doukas AG, Hamblin MR. Shock wave-mediated molecular delivery into cells. Biochim Biophys Acta MolCell Res. 2002;1542:186–194. doi: 10.1016/s0167-4889(01)00177-x. [DOI] [PubMed] [Google Scholar]
- Kodama T, Hamblin MR, Doukas AG. Cytoplasmic molecular delivery with shock waves: Importance of impulse. Biophys J. 2000;79:1821–1832. doi: 10.1016/S0006-3495(00)76432-0. [DOI] [PMC free article] [PubMed] [Google Scholar]
- Lai CY, Wu CH, Chen CC, Li PC. Quantitative relations of acoustic inertial cavitation with sonoporation and cell viability. Ultrasound Med Biol. 2006;32:1931–1941. doi: 10.1016/j.ultrasmedbio.2006.06.020. [DOI] [PubMed] [Google Scholar]
- Larina IV, Evers BM, Esenaliev RO. Optimal drug and gene delivery in cancer cells by ultrasound-induced cavitation. Anticancer Res. 2005;25:149–156. [PubMed] [Google Scholar]
- Lee S, McAuliffe DJ, Flotte TJ, Kollias N, Doukas AG. Photomechanical transdermal delivery: The effect of laser confinement. Lasers Surg Med. 2001;28:344–347. doi: 10.1002/lsm.1060. [DOI] [PubMed] [Google Scholar]
- Li P, Armstrong WF, Miller DL. Impact of myocardial contrast echocardiography on vascular permeability: Comparison of three different contrast agents. Ultrasound Med Biol. 2004;30:83–91. doi: 10.1016/j.ultrasmedbio.2003.09.004. [DOI] [PubMed] [Google Scholar]
- Li T, Tachibana K, Kuroki M. Gene transfer with echo-enhanced contrast agents: Comparison between Albunex, Optison, and Levovist in mice—Initial results. Radiology. 2003;229:423–428. doi: 10.1148/radiol.2292020500. [DOI] [PubMed] [Google Scholar]
- Li YS, Reid CN, McHale AP. Enhancing ultrasound-mediated cell membrane permeabilisation (sonoporation) using a high frequency pulse regime and implications for ultrasound-aided cancer chemotherapy. Cancer Lett. 2008;266:156–162. doi: 10.1016/j.canlet.2008.02.041. [DOI] [PubMed] [Google Scholar]
- Liu Y, Paliwal S, Bankiewicz KS, Bringas JR, Heart G, Mitragotri S, Prausnitz MR. Ultrasound-enhanced drug transport and distribution in the brain. AAPS PharmSciTech. 2010;11:1005–1017. doi: 10.1208/s12249-010-9458-0. [DOI] [PMC free article] [PubMed] [Google Scholar]
- McDannold N, Vykhodtseva N, Hynynen K. Use of ultrasound pulses combined with Definity for targeted blood-brain barrier disruption: a feasibility study. Ultrasound Med Biol. 2007;33:584–590. doi: 10.1016/j.ultrasmedbio.2006.10.004. [DOI] [PMC free article] [PubMed] [Google Scholar]
- Mehier-Humbert S, Bettinger T, Yan F, Guy RH. Plasma membrane poration induced by ultrasound exposure: implication for drug delivery. J Control Release. 2005;104:213–222. doi: 10.1016/j.jconrel.2005.01.007. [DOI] [PubMed] [Google Scholar]
- Mehier-Humbert S, Yan F, Frinking P, Schneider M, Guy RH, Bettinger T. Ultrasound-mediated gene delivery: Influence of contrast agent on transfection. Bioconjug Chem. 2007;18:652–662. doi: 10.1021/bc0602432. [DOI] [PubMed] [Google Scholar]
- Miao CH, Brayman AA, Loeb KR, Ye P, Zhou L, Mourad P, Crum LA. Ultrasound enhances gene delivery of human factor IX plasmid. Hum Gene Ther. 2005;16:893–905. doi: 10.1089/hum.2005.16.893. [DOI] [PubMed] [Google Scholar]
- Miller DL, Bao S, Morris JE. Sonoporation of cultured cells in the rotating tube exposure system. Ultrasound Med Biol. 1999;25:143–149. doi: 10.1016/s0301-5629(98)00137-9. [DOI] [PubMed] [Google Scholar]
- Miller DL, Dou C. Membrane damage thresholds for pulsed or continuous ultrasound in phagocytic cells loaded with contrast agent gas bodies. Ultrasound Med Biol. 2004;30:405–411. doi: 10.1016/j.ultrasmedbio.2003.11.013. [DOI] [PubMed] [Google Scholar]
- Miller DL, Dou C. Induction of apoptosis in sonoporation and ultrasonic gene transfer. Ultrasound Med Biol. 2009;35:144–154. doi: 10.1016/j.ultrasmedbio.2008.06.007. [DOI] [PMC free article] [PubMed] [Google Scholar]
- Miller MW, Miller DL, Brayman AA. A review of in vitro bioeffects of inertial ultrasonic cavitation from a mechanistic perspective. Ultrasound Med Biol. 1996;22:1131–1154. doi: 10.1016/s0301-5629(96)00089-0. [DOI] [PubMed] [Google Scholar]
- Mitragotri S. Healing sound: the use of ultrasound in drug delivery and other therapeutic applications. Nat Rev Drug Discov. 2005;4:255–260. doi: 10.1038/nrd1662. [DOI] [PubMed] [Google Scholar]
- Moran CM, Anderson T, Pye SD, Sboros V, McDicken WN. Quantification of microbubble destruction of three fluorocarbon-filled ultrasonic contrast agents. Ultrasound Med Biol. 2000;26:629–639. doi: 10.1016/s0301-5629(00)00148-4. [DOI] [PubMed] [Google Scholar]
- Newman CM, Bettinger T. Gene therapy progress and prospects: Ultrasound for gene transfer. Gene Ther. 2007;14:465–475. doi: 10.1038/sj.gt.3302925. [DOI] [PubMed] [Google Scholar]
- Ng KY, Liu Y. Therapeutic ultrasound: Its application in drug delivery. Med Res Rev. 2002;22:204–223. doi: 10.1002/med.10004. [DOI] [PubMed] [Google Scholar]
- Nozaki T, Ogawa R, Feril LB, Jr, Kagiya G, Fuse H, Kondo T. Enhancement of ultrasound-mediated gene transfection by membrane modification. J Gene Med. 2003;5:1046–1055. doi: 10.1002/jgm.445. [DOI] [PubMed] [Google Scholar]
- Osada K, Kataoka K. Drug and gene delivery based on supramolecular assembly of PEG-polypeptide hybrid block copolymers. In: Klok H-A, Schlaad H, editors. Peptide hybrid polymers. Springer; Berlin/ Heidelberg: 2006. pp. 113–153. [Google Scholar]
- Pitt WG. Defining the role of ultrasound in drug delivery. Am J Drug Deliv. 2003;1:27–42. [Google Scholar]
- Poling BE, Prausnitz JM, O’Connell JP. The properties of gases and liquids. 5th ed McGraw-Hill; New York: 2001. [Google Scholar]
- Schlicher RK, Radhakrishna H, Tolentino TP, Apkarian RP, Zarnitsyn V, Prausnitz MR. Mechanism of intracellular delivery by acoustic cavitation. Ultrasound Med Biol. 2006;32:915–924. doi: 10.1016/j.ultrasmedbio.2006.02.1416. [DOI] [PubMed] [Google Scholar]
- Srinivasan R. Ablation of polymers and biological tissue by ultravioletlasers. Science. 1986;234:559–565. doi: 10.1126/science.3764428. [DOI] [PubMed] [Google Scholar]
- Sundaram J, Mellein BR, Mitragotri S. An experimental and theoretical analysis of ultrasound-induced permeabilization of cell membranes. Biophys J. 2003;84:3087–3101. doi: 10.1016/S0006-3495(03)70034-4. [DOI] [PMC free article] [PubMed] [Google Scholar]
- Tata DB, Dunn F, Tindall DJ. Selective clinical ultrasound signals mediate differential gene transfer and expression in two human prostate cancer cell lines: LnCap and PC-3. Biochem Biophys Res Commun. 1997;234:64–67. doi: 10.1006/bbrc.1997.6578. [DOI] [PubMed] [Google Scholar]
- van Wamel A, Bouakaz A, ten Cate F, de Jong N. Effects of diagnostic ultrasound parameters on molecular uptake and cell viability. 2002 IEEE Ultrason Symp Proc. 2002;1-2:1419–1422. [Google Scholar]
- Zarnitsyn VG, Prausnitz MR. Physical parameters influencing optimization of ultrasound-mediated DNA transfection. Ultrasound Med Biol. 2004;30:527–538. doi: 10.1016/j.ultrasmedbio.2004.01.008. [DOI] [PubMed] [Google Scholar]