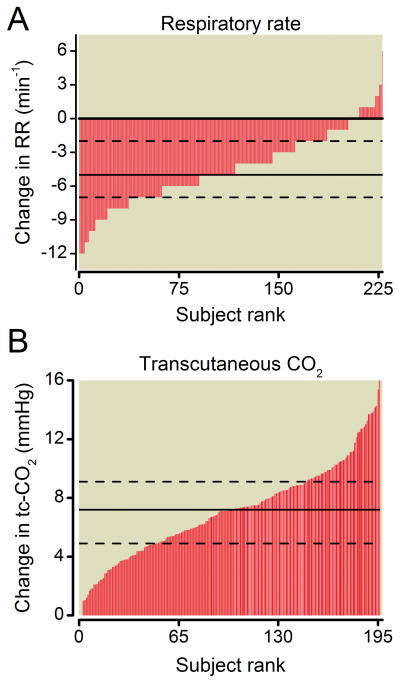
Figure 2.
Respiratory depression was assessed by measuring opioid-induced decreases in respiratory rate and increases in transcutaneous carbon dioxide (tc-CO2). Results are ranked from smallest to largest along the x-axis. The inter-individual differences in drug-induced changes in respiratory rate (A) varied widely and ranged from −12 to 3 breaths/min. Similarly, the increase in tc-CO2 varied widely (B), being absent in some and increasing by up to 18.6 mmHg in others. The solid and dashed lines indicate the median and the interquartile range, respectively.

