

Abstract
Using morpholino antisense oligonucleotide (MO) technology, we blocked leptin A or leptin receptor expression in embryonic zebrafish, and analyzed consequences of leptin knock-down on fish development. Embryos injected with leptin A or leptin receptor MOs (leptin A or leptin receptor morphants) had smaller bodies and eyes, undeveloped inner ear, enlarged pericardial cavity, curved body and/or tail and larger yolk compared to control embryos of the same stages. The defects persisted in 6-9 day old larvae. We found that blocking leptin A function had little effect on the development of early brain (1 day old), but differentiation of both the morphant dorsal brain and retinal cells was severely disrupted in older (2 day old) embryos. Despite the enlarged pericardial cavity, differentiation of cardiac cells appeared to be similar to control embryos. Formation of the morphants’ inner ear is also severely disrupted, which corroborates existing reports of leptin receptor expression in inner ear of both zebrafish and mammals. Co-injection of leptin A MO and recombinant leptin results in partial rescue of the wild-type phenotype. Our results suggest that leptin A plays distinct roles in zebrafish development.
Keywords: differentiation, central nervous system, metabolism, bone, auditory, visual
1. Introduction
Leptin’s discovery by Jeffrey Friedman’s laboratory in 1994 [60] set off a burst of research activity, which has produced tens of thousands of studies. That body of work revealed that leptin is a pleiotropic hormone, with well described effects on lipid metabolism, thermoregulation, immune function, reproductive maturation, angiogenesis, and bone remodeling (see [6, 14, 15,25, 47, 49] for reviews). The overwhelming majority of leptin characterization has been studied in mammalian systems, due both to the fact that humans are mammals, and also to the fact that identifying non-mammal leptin orthologues has been hampered by very low sequence conservation (e.g. 11-28% sequence identity between fish and mammals [38]). However, with Kurokawa’s ground-breaking advance in cloning Fugu leptin via gene synteny [31], several fish sequences have now been identified (including carp [22], Arctic charr, [18] and zebrafish [19]). These fish sequences, although markedly divergent in primary structure, appear to be similar in tertiary structure based on threading algorithm structure prediction [19] and cross-reactivity with anti-mammal leptin antibodies [24]. If indeed leptin signaling is intact in fishes, we are then in a position to apply to leptin biology what traditionally has been a very successful approach to thorny physiological problems- the comparative method. We assert that characterizing leptin signaling among evolutionarily divergent species will afford insight not easily gained by studying mammals alone. Knowing how leptin signaling is both similar and different among vertebrates will generate testable hypotheses as to the molecular mechanisms underlying leptin’s pleiotropic effects. Other systems have yielded important insights (e.g. the effects of leptin on limb development in Xenopus [12]). Fishes offer another robust model for comparative leptin study. Leptin expression is strongest in adipose tissue of mammals [1], but liver seems to be the predominant site of expression in fishes, with only weak expression in adipose tissue [48]. Is the pathway for leptin-mediated lipid mobilization from adipose stores conserved from fish (liver) to mammals (adipose)? Are there developmental systems that depend on leptin signaling, and can be more easily studied in non-mammals? Pursuing these questions could lead to new understanding about how the central nervous system censuses peripheral energy stores.
We are developing tools to identify and manipulate leptin in a fish model organism, the zebrafish (Danio rerio ). Zebrafish are ideal fish models due to their ease of husbandry and mating, fast generation time, transparent embryos, availability of mutants, sequenced genome and large literature database [56]. In addition, gene expression can be readily manipulated with the use of morpholino antisense oligonucleotides (MOs; e.g. [4, 5]). In this study, we used MOs against leptin A and the leptin receptor in zebrafish to describe the effects of reduced leptin A signaling on early zebrafish development. The morphant phenotypes are both consistent with the mammalian model of leptin action, while suggesting either unique aspects of leptin A signaling in fishes or as yet undiscovered aspects of leptin A signaling among vertebrates in general.
Methods
2.1 Zebrafish
All animal-related procedures were approved by the Care and Use of Animals in Research Committee at the University of Akron (IACUC Approval ID#08-6B). Zebrafish (Danio rerio, Hamilton, wild type) were maintained as described in the Zebrafish Book [56]. Zebrafish embryos were obtained from in house breeding of wild-type adult zebrafish. Embryos for whole-mount immunocytochemistry or in situ hybridization were raised in PTU (1-phenyl-2-thiourea, 0.003%) treated fish tank water to prevent melanization. Stages of embryonic or larval development are given as hours post-fertilization (hpf) or days post-fertilization (dpf).
2.2 Quantitative PCR
Total RNA was isolated from adult tissues or developing embryos using TriReagent (MRC, 50 embryos were pooled and frozen at −80°C for each stage; adult Cincinnati, OH). Approximately 20– tissues were extracted per individual (fresh tissue, immediately extracted). Samples were homogenized in a bead mill to avoid cross-contamination. RNA samples were digested with DNAse after extraction and quantified with a NanoDrop ND-1000 spectrophotometer (Nanodrop Technologies, Wilmington, DE). cDNA was synthesized from total RNA using a high-efficiency reverse transcriptase (Quanta Biosciences, Gaitherburg, MD), primed with random hexamers and oligo DT. Duplicate reactions without reverse transcriptase were performed for negative control-templates for quantitative PCR. Q-PCR analysis of leptin A temporal and tissue expression profiles was performed using lep primers (forward primer 5′ –ATC GTC AGA ATC AGG GAA CAC A-3′; reverse primer 5′-CCC AAT GAT GAG CGT TGG A -3′ based on ACC# NM_001128576.1), and primers for zebrafish ribosomal protein L13A (60s) as a reference gene (forward primer 5′-TCT GGA GGA CTG TAA GAG GTA TGC-3′; reverse primer 5′-AGA CGC ACA ATC TTG AGA GCA G-3′) as in [55]. L13A is a validated control gene for zebrafish, showing no significant change in expression among tissues or during early development [55]. cDNAs equivalent to 50 ng total RNA/reaction were amplified and quantified with SYBR green master mix (Sigma) on an Applied Biosystems 7300 (ABI).
2.3 Immunoblot
Full-length (minus the signal sequence), recombinant zebrafish leptin A (GeneID# 100150233) was expressed in a bacterial vector commercially (Genscript, Piscataway, NJ). This recombinant leptin A was then used as antigen for production of a polyclonal antibody in rabbits (Genscript), and for the co-injection rescue experiments (see section 2.4). Total immunoglobulins were isolated from the antisera via protein-A chromatography, and these IgGs were further purified by affinity chromatography with a zebrafish leptin-A immobilized column. Zebrafish embryos were euthanized with 0.2% MS222, and briefly sonicated (5sec at 5W on ice). Proteins were separated by SDS-PAGE as detailed in [36] with the following modifications: proteins were separated on 4-20% gradient gels, the primary antibody (affinity-purified anti-zebrafish leptin) was applied at 1:50 concentration, the secondary (monoclonal, HRP-labeled anti-rabbit IgG) at 1:1000 concentration, and the blot was developed with Millipore (Billerica, MA) Immobilon chemiluminescent substrate and imaged with a Syngene (Frederick, MD) gel documentation system. Anti-zebrafish leptin A antibody specificity was verified by its recognition of a single band of the appropriate mass, being able to compete the reaction away by pre-incubating the antibody with recombinant zebrafish leptin A protein, and by its recognition of recombinant leptin A, but not recombinant zebrafish leptin B (expressed in Expresso vector, Lucigen, Middleton, WI).
2.4 MOs and MO injections
Two zebrafish leptin-A translation blocking morpholino antisense oligonucleotides (MOs; leptin-A MO1 (lepMO1): 5′-TTG AGC GGA GAG CTG GAA AAC GCA T -3′, leptin-A MO2 (lepMO2): 5′- GCA TAC TTC CTG TAT ACT CTT TGC A -3′), a splice-blocking MO (lepsMO designed to bind to the boundary between exon 1 and intron 1(5′-GAG TTT TAA CTC ATT ACC CCG TCA A-3′), a control MO with five-mismatched nucleotides compared to lepMO1 (5-misMO: 5′- TTG AcC GcA GAc CTG cAA AAg GCA T -3′), and a translation blocking zebrafish receptor MO (lepRMO: 5′-TCA AGA CAG ACA TCA TTT CAC TTG C-3′) were used in the study. The above MOs were designed by and purchased from Gene Tools (Philomath, OR). Leptin A and leptin receptor MOs sequences showed no significant similarities to any sequences other than zebrafish leptin A and leptin receptor, respectively via BLAST (GenBank accession numbers: AM_920658, NP_001106841.1). The MOs were dissolved in Daneau buffer (58 mM NaCl, 0.7 mM KCl, 0.4 mM MgSO4, 0.6 mM Ca(NO3)2, 5.0 mM HEPES pH 7.6), and injected into one- to four-cell stage embryos (Table 1A) using a Narishige MI300 microinjector. Injected embryos were allowed to develop at 28.5°C until the embryos reached desired stages (e.g. 49 hpf), anesthetized in 0.02% MS-222 and fixed in 4% paraformaldehyde (dissolved in 0.1 M phosphate buffered saline, PBS, pH 7.4) and processed as described below.
Table 1.
Effects of LepMOs and LepRMO Injection on Zebrafish Development
| # embryos with slight gross defects (%) |
# embryos with moderate gross defects (%) |
# embryos with severe gross defects (%) |
# embryos examined at 48-50 hpf (# embryos with no phenotype) |
|
|---|---|---|---|---|
| Uninjected Control | 10 (2.0%)* | 6 (1.2%)* | 4 (0.8%)* | 500 (480) |
| 5-misMO (0.5 mM, 2 nl) | 9 (3.8%)* | 6 (2.5%)* | 4 (1.7%)* | 236 (220) |
| 5-misMO (1.0 mM, 2nl) | 5 ()* | 6 ()* | 3 ()* | 113 (109) |
| lepMO1 (0.5 mM, 2 nl) | 22 (7.2%) | 255 (83.6%) | 23 (7.5%) | 305 (6) |
| lepMO1 (1.0 mM, 2 nl) | 8 (3.8%) | 32 (15.4%) | 158 (76.0%) | 208 (10) |
| lepMO1 (1.2 mM, 2 nl) | 0 (0%) | 4 (1.8%) | 19 (8.3%) | 228 (7) (the rest dead) |
| lepMO2 (0.5 mM, 3 nl) | 41 (69%) | 5 (8.5%) | 2 (3.3%) | 59 (11) |
| lepMO2 (1.2 mM, 3 nl) | 61 (46.2%) | 24 (18.2%) | 12 (9.1%) | 132 (35) |
| lepMO2 (1.2 mM, 4 nl) | 19 (30.2%) | 30 (47.6%) | 7 (11.1%) | 63 (7) |
| lepsMO (0.5 mM, 2 nl) | 2 (2.5%)* | 0 (0.0%) | 1 (1.3%) | 79 (76) |
| lepsMO (1.0 mM, 2 nl) | 3 (3.5%)* | 1 (1.2%)* | 1 (1.2%) | 85 (80) |
| lepRMO1 (0.8 mM, 2 nl) | 22 (37.9%) | 26 (44.8%) | 2 (3.4%) | 58 (8) |
| lepRMO1 (0.8 mM, 3 nl) | 62 (33.2%) | 94 (50.3%) | 8 (4.3%) | 187 (23) |
| lepRMO1 (1.2 mM, 3 nl) | 14 (8.7%) | 135 (83.9%) | 6 (3.7%) | 161 (6) |
most of the gross morphological defects (e.g. truncated body or no head) were different from those of leptin morphants. Phenotypic analyses were conducted using embryos with moderate gross defects obtained using the MO dosages indicated by bold letters.
Recombinant zebrafish leptin A protein (synthesized by GenScript, see section 2.3) was co-injected with the leptin A morpholino (LepMO1) to ‘rescue’ the morphant phenotype. A leptin-A protein stock solution (30 μM in 50 mM Tris, pH 8.0, >90% pure) was diluted to 1:1, 1:4 and 1:25 in PBS, and each dilution injected with lepMO1 (0.5 mM, 2 nl) into one- to four-cell stage embryos as described above (Table 1A).
2.5 Tissue processing
To prepare tissue for whole mount in situ hybridization (ISH) or immunohistochemistry (ICC), the fixed embryos were rinsed in PBS, followed by placing the embryos in increasing concentrations of methanol, and stored in 100% methanol at −20°C until use.
2.6 ISH and ICC
Detailed procedures for synthesis of digoxigenin-labeled antisense cRNA probes and ISH were described previously [37]. The ISH cRNA probes used were cmlc2 [59], neuroD [27], krox20 [45], pax2a [29], shh [28], and vmhc [59]. For each cRNA probe, control embryos (uninjected or embryos injected with the 5-misMO) and leptin A or leptin receptor morphant embryos were processed at the same time, side by side. For immunocytochemical detection of the digoxigenin-labeled cRNA probes, anti-digoxigenin Fab fragment antibodies conjugated to alkaline phosphatase were used, followed by an NBT/BCIP color reaction step (Roche Molecular Biochemicals, Indianapolis, IN).
Primary antibodies used were anti-HuC/D (1:3,500, Molecular Probes/Invitrogen, Carlsbad, CA), and zn5 (1:1,000, Zebrafish International Resource Center, University of Oregon, Eugene, OR). A biotinylated secondary antibody (Vector Laboratories, Burlingame, CA) was used for immunoperoxidase methods, and visualization of the reaction was achieved by using a DAB kit (Vector Laboratories). Detailed procedures for the whole mount ICC were reported previously [34].
2.7 Microscopy and data analysis
Images of live or labeled whole mount embryos were obtained with an Olympus BX51 compound microscope equipped with a SPOT digital camera. Digitized images were processed with the same values of contrast, sharpening with Adobe Photoshop (Mountain View, CA). Measurements of eye size (circumference in micrometers) were taken using the SPOT software, and statistical analysis was performed using two-tailed unpaired Student t-test.
2. Results
3.1 Leptin A expression in developing and adult zebrafish
Leptin A mRNA (lepA) expression was detected throughout zebrafish embryonic and early larval development (Fig. 1A). lepA expression levels decreased from fertilization to 24 hpf, then increased in later development. lepA was also expressed in various adult tissues including the brain, skin, liver, gonads, and gill, with gonads having much higher expression levels than the other tissues (Fig. 1B). lepA expression levels were essentially undetectable in adipose, heart, muscle, and gut.
Figure 1. Expression of zebrafish leptin A as estimated by quantitative PCR.

cDNA for leptin A was amplified via qPCR and normalized against expression of ribosomal protein L13A. Values represent average of three samples/tissue (error bars are standard error). A) Relative expression in whole zebrafish embryos at five time points after fertilization. Leptin mRNA generally decreases post fertilization. B) Relative expression among adult tissues. Expression is highest in gonads.
3.2 Leptin A expression is knocked down in embryos injected with leptin MOs
Control embryos express a single band at 16 kDa during early development (Fig. 2). This band is virtually undetectable in embryos injected with the translation blocking MO (lepMO1). This is strong evidence that leptin A expression is significantly reduced in the morphants.
Figure 2. Leptin morphants show reduced expression of leptin.
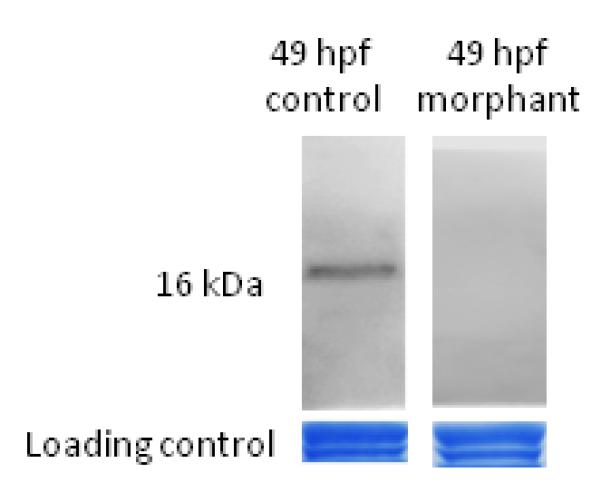
Immunoblots of equivalent amounts of total protein from control and morphant embryos at 49 hours post fertilization. Control embryos express a single 16 kDA band, and this band is greatly reduced in the morphants. Loading control is an image of total protein loaded in each lane stained with Coomassie Brilliant Blue (both bands used as loading control).
3.3 Leptin A function in overall zebrafish development
Morpholino antisense oligonucleotide (MO) technology effectively and selectively blocks gene function during development of model organisms such as Xenopus and zebrafish [2-4, 17, 26, 43]. Injection of translation blocking leptin A MOs into one- to four-cell stage zebrafish embryos resulted in embryos that were smaller (but with larger yolk) than 5-misMO injected embryos or (uninjected) control embryos (Fig. 3 A-H). The difference in body and yolk size between the control and morphant embryos was barely detectable at 24-26 hpf, but became obvious in older embryos (49 and 72 hpf, Fig. 3). Mean yolk circumference (μm) was not different between lepMO1 morphants and controls at 25 hpf (1868 ± 50 μm controls; at 1864 ± 78 μm morphants) but was significantly different by 49 hpf (1596 ± 79 μm controls; at 1762 ± 69 μm morphants). The leptin A morphants also had smaller eyes, enlarged pericardial cavity, reduced pigmentation, and many had a kinked (lateral, dorsal or ventral) body and/or tail (Figs. 3 and Sup. Fig. 1, Table 1B). In older morphants (36-72 hpf), the head and body trunk were apparently smaller than control embryos of the same developmental stages, but the head-trunk angle (the angle between a line drawn through the middle of the ear and eye, and a second line parallel to the notochord- a measure of development time [56]), appeared to be similar. The angle was smaller than 90° at 25 hpf (Fig. 3A and B), and by 49 hpf, the angle was around 140° in most control embryos (Fig. 3C) and lepMO morphants (Fig. 3D). Both leptin A MOs produced similar defects, with the lepMO1 a more effective MO (Table 1A). Injection of the splice-blocking leptin A MO resulted in most embryos that were indistinguishable from uninjected control embryos (Table 1A). This was not surprising because leptin A mRNA was detected in 0 hpf embryos (Fig. 1), and maternally derived leptin A mRNA should not be affected by any splice-blocking MO [16]. Injection of the leptin receptor MO resulted in embryos with similar gross morphological phenotype as that observed in the leptin A morphants, except that pigmentation in most of the leptin receptor morphants was less affected than leptin A morphants (Fig. 3D and F inserts). To make analysis and interpretation of results more consistent, phenotypes of leptin A morphants and leptin receptor morphants were examined on moderately affected embryos injected with lepMO1 (all lepMO related images were from moderately affected lepMO1 injected embryos) and lepRMO, respectively.
Figure 3. Gross morphological defects in leptin and leptin receptor morphants.

All images show lateral views of live embryos, with anterior to the left and dorsal up. Control embryos are shown in panels on the left column, with embryos injected with the 5-mismatched leptin MO (5- mis) shown as inserts in panels C and E. Embryos injected with the leptin MO1 (lepMO) are shown on the right column, with embryos injected with the leptin receptor MO (lepRMO) shown as inserts in panels D and F. Abbreviations: pc, pericardial cavity; sb, swim bladder; tr, body trunk. Panels A and B are of the same magnification, while remaining panels are of the same magnification as panel C. All scale bars = 200 μm.
Summary of Developmental Defects in Lep and/or LepR Morphants
| Body | smaller, curved or kink body trunks, and larger yolk |
| Brain | reduced differentiation of the dorsal optic tectum, dorsal cerebellum, and dorsal hindbrain |
| Ear | smaller otoliths and reduced semicircular canal structures |
| Eye | smaller and reduced pigmentation; reduced retinal cells differentiation |
| Spinal cord | thinner spinal nerves with less branching |
3.4 Injection of leptin Aprotein rescued wild-type phenotype in morphants (partially)
To further demonstrate lepMO1 specificity on zebrafish embryonic development, we injected recombinant zebrafish leptin A protein together with lepMO1 into one- to-four cell stage embryos, and analyzed gross morphology of resultant embryos at 49 hpf (Fig. 4). The gross morphological defects observed in lepMO1 morphants were partially rescued in the co-injected embryos, with the body shape and size, eye size, yolk size, pericardial cavity and pigmentation showing apparent rescuing effects (Fig. 4). Moreover, the effect of rescue was leptin-A protein dose dependant (Fig. 4B and C), with the best rescuing (most similar to control embryos) in those embryos injected with the highest concentration of leptin A protein, and no detectable difference from morphant embryos in those injected with the lowest amount of leptin A protein (Table 2). Closer examination of the rescued embryos revealed that they were still distinguishable from uninjected control embryos, with the rescued embryos (Fig. 4B) having smaller eyes, slightly larger yolk sac, and defective yolk extension (smaller) compared to the control embryos (Fig. 4A). Differentiation of retinal and spinal cord tissues in the rescued embryos was examined using zn5 antibody, showing similar staining patterns (Fig. 4F and H) compared to control embryos (Fig. 4E and G, for more see below), confirming effects of leptin A rescuing.
Figure 4. Rescuing leptin morphant defects using recombinant leptin.

Panels A-D show lateral views (anterior to the left and dorsal up) of live zebrafish embryos at 49 hpf. A rescued embryo (panel B) appears to be similar in gross morphology to an uninjected control embryo (panel A). Panels E-H show embryos processed for whole mount immunostaining using zn5 antibody. Panels E and F show ventral views (anterior to the top) of the head region while panels G and H show lateral views (anterior to the left) of the mid-trunk region. Abbreviations: 1:1 LepRes, 1 part recombinant leptin: 1 part lepMO1; 1:4 LepRes, 1 part recombinant leptin: 4 parts lepMO1; gcl, retinal ganglion cell layer; on, optic nerve; te, telencephalon; scd, spinal cord; sn, spinal nerves; ye, yolk extension. Other abbreviations are the same as in Figure 3. Scale bars = 250 μm for panels A-D, and 50 μm for panels E-H.
Table 2.
Effects of Recombinant Leptin Rescue on Zebrafish Development
| # embryos with slight gross defects (%) |
# embryos with moderate gross defects (%) |
# embryos with severe gross defects (%) |
# embryos examined at 48-50 hpf (# embryos with wild type phenotype) |
|
|---|---|---|---|---|
| Uninjected Control | 0 (0.0%) | 1 (2.0%) | 0 (0.0%) | 49 (98%) |
| lepMO1 (0.5 mM, 2 nl) | 3 (7.7%) | 20 (51.3%) | 16 (41.0%) | 0 (0%) |
| lepMO1 (0.5 mM, 2 nl) + 1:25 zleptin (40 nM, 2nl) |
1 (2.3%) | 25 (56.8%) | 18 (40.9%) | 0 (0%) |
| lepMO1 (0.5 mM, 2 nl) + 1:4 zleptin (7.5 μM, 2nl) |
5 (14.7%) | 28 (82.3%) | 1 (3.0%) | 0 (0%) |
| lepMO1 (0.5 mM, 2 nl) + 1:1 zleptin (30 μM, 2nl) |
48 (70.6%) | 19 (27.9%) | 1 (1.5%) | 0 (0%) |
3.5 Eye and inner ear development affected in leptin A and leptin receptor morphants
We measured the eye size of live control embryos and morphants eyes at three developmental stages (Fig. 5 showing 25 and 72 hpf, 49 hpf images not shown). In all cases morphant eyes were significantly smaller (p<0.001) in morphants vs. their control counterparts (25 hpf, leptin receptor morphants 509 + 12.6 vs. 645.5 + 14.9 controls, 49 hpf leptin receptor morphants 637.8 + 21.8 and leptin A morphants 669 + 41.3 vs. 830.9 + 22.9 for controls, 72 hpf leptin receptor morphants 688.8 + 17.4 vs. 904 + 20.7 controls, all measurements are circumference in microns; Fig 5A-F). It is interesting to note that the morphant eyes at 72 hpf were only slightly bigger than control embryo eyes at 25 hpf.
Figure 5. Blocking leptin function resulted in reduced eye size and altered inner ear development.

All panels show lateral views of the head region (anterior to the left and dorsal up) of live embryos with panels A-F focusing on the eyes and panels G-L focusing on the inner ear (otic vesicle). Control embryos are in the left row, while leptin morphants (LepMO) and leptin receptor morphants (LepRMO) are in the second and third rows, respectively. Other abbreviations: ot, otolith; ov, otic vesicle; sc, semicircular canal. All images are of the same magnification. Scale bar = 100 μm.
By 49 hpf, otoliths in control embryos have grown in size, and precursors of the developing semicircular canals (epithelial protrusions that grow out from anterior and posterior otic vesicle walls and extend into the otic vesicle lumen, [20] become readily discernable in the dorsal 1/3 of the otic vesicle. There were little or no semicircular canals in the morphant otic vesicle (data not shown). By 72 hpf, the otoliths in control larvae continued to grow, especially the posterior otolith (Fig. 5K), and the formation of the semicircular canals was almost complete [20]. The otoliths also grew in size in the morphants (Fig. 5L and M), but they remained smaller than those in the control larvae (Fig. 5K), especially the posterior otolith. Precursors of the semicircular canals were seen in some morphants (Fig. 5L). The morphants semicircular canals (at 72 hpf) were typically less developed compared to those in 49 hpf control embryos. There was little further development in the leptin A morphant otic vesicle in older larvae (4-7 days old), whereas the otic vesicle in control larvae continued to grow (data not shown).
3.6 Effects of leptin A knock-down on central nervous system development
Central nervous system (CNS) development in leptin and/or leptin receptor morphants was assessed by examining brain morphology in live embryos and staining patterns of several neural differentiating markers. At 25 hpf, the leptin A morphant brain (Fig.6 6D) looked similar to control brain (Fig. 6A), with distinct brain regions (e.g. cerebellum, hindbrain, optic tectum) recognizable and similar in appearance in both the control and morphant embryos. However, the dorsal portion of the posterior wall of the optic tectum and the dorsal cerebellum appeared to be thinner in the morphants, and the morphant eyes were noticeably smaller than control embryos (also see Fig. 5). Staining patterns of sonic hedgehog (shh, labels mainly the ventral forebrain, anterior and central diencephalon, ventral mid- and hindbrains, [28], pax2a (labels the boundary of the mid- and hind brains, [29]), and krox20 (labels rhombomeres 3 and 5,[45]) were similar between the control embryos (Fig. 6B and C, Table 3) and leptin A morphants (Fig. 6E and F, Table 3). The morphants brain differentiation was further analyzed in 49 hpf embryos using zn5 antibody (labels subset of neurons and their fibers in the brain) and anti-HuC/D antibody (labels differentiating neurons in the nervous system). Retinal ganglion cells (RGCs) begin to differentiate around 28 hpf in the anteroventral portion of the embryonic retina in zebrafish, and by 49 hpf, a well defined layer of RGCs has formed, and RGCs axons (optic nerve) have projected out of the retina and reached the optic tectum, the major target in the brain in the developing zebrafish [8, 53]. Developing RGCs and their axons can be labeled using several neural markers such as zn5 (labeling both RGC body and axons) and anti-HuC/D immunostaining (labeling RGC soma) [39, 40]. A distinct retinal ganglion cell layer (gcl) was observed in 2-day old control embryos (Fig. 6G and H) or embryos injected with the control 5-misMO (Fig. 6G insert and H insert). Expression of these two markers was either absent, or greatly reduced in leptin A and leptin receptor morphants retinae (Fig. 6K, L and their inserts; Table 3). In control embryos (uninjected or injected with the control 5-misMO), there was a distinct, thick optic nerve found exiting each retina, crossing at the base of the diencephalon (optic chiasm), and projecting toward the brain (Fig. 6G and insert), whereas in leptin A or leptin receptor morphants there was either no optic nerve detectable or there was only a very thin optic nerve (Fig. 6K and insert). Labeling of these markers in some other regions of the morphants (e.g. anti-HuC/D in the telencephalon) was less affected (Fig. 6L and insert). NeuroD is a transcription factor that plays a crucial role in the formation of the vertebrate retina [23, 42, 57]. NeuroD mRNA (neuroD) is strongly expressed in 2-day old embryonic zebrafish retina [27]. Its expression was reduced in leptin A morphant retina (Fig. 6P) compared to control retina (Fig. 6O).
Figure 6. Leptin function in central nervous system development.

All panels, except panels G, H, K and L (ventral views with anterior to the top), show lateral views (anterior to the left and dorsal up) of the zebrafish embryos. Panels A and D are from live embryos, while the remaining panels show images from embryos processed for whole mount in situ hybridization (panels B, C, E, F, O and P), or embryos processed for whole mount immunocytochemistry (panels G-N and their inserts, and Q and R). The arrowhead in panels A, B, D and E points to the boundary of the mid -hindbrains. No obvious CNS defects were detected in 25 hpf embryos (panels A-F). Apparent CNS defects were observed in 2-day old embryos (the remaining panels). Abbreviations: c, cerebellum; gcl; retinal ganglion cell layer; gv/ad, trigeminal ganglion and anterodorsal lateral line ganglion; gX, vagal ganglion; h, hindbrain; on, optic nerve; ot, optic tectum; r3 and r5, rhombomere 3 and 5, respectively; scd, spinal cord; sn, spinal nerves; te, telencephalon; tm, trunk muscles; 1-6, zn5 positive vertical bands 1-6 in the hindbrain. Other abbreviations are the same as previous figures. For panels A-F, each image in the top row has the same magnification as the one below it in the bottom row. Panels H, K and L have the same magnification as panel G, while panels J,M-R have the same magnification as panel I. Scale bars = 100 μm for panels A-F, 50 μm for the remaining panels.
Table 3.
Effects of LepMO or LepRMO Injections on Expression of Neural Markers
| forebrain and eye (%) | midbrain (%) | bmh (%) | cerebellum (%) | hindbrain (%) | spinal cord (%) | spinal nerves | |
|---|---|---|---|---|---|---|---|
| 25 hpf krox20 | |||||||
| Control (n=10) | 0 | ||||||
| LepMO1 (n=10) | 0 | ||||||
| 25 hpf pax2a & shh | |||||||
| Control (n=10) | 10.0 | 0 | 0 | ||||
| LepMO1 (n=9) | 0 | 11.0 | 0 | ||||
| 49 hpf anti-Hu | |||||||
| Control (n=26) | 7.7 | 7.7 | 0 | 3.8 | |||
| 5-misMO (n=12) | 16.7 | 8.3 | 8.3 | 0 | |||
| LepMO1 (n=15) | 100 | 100 | 100 | 100 | |||
| LepRMO (n=8) | 100 | 100 | 100 | 100 | |||
| 49 hpf zn5 | |||||||
| Control (n=25) | 0 | 8.0 | 12.0 | 12.0 | |||
| 5-misMO (n=15) | 0 | 13.3 | 20.0 | 12.0 | |||
| LepMO (n=15) | 100 | 13.3 | 40.0 | 100 | |||
| LepRMO (n=12) | 100 | 25.0 | 33.3 | 100 | |||
| 49 hpf neuroD | |||||||
| Control (n=10) | 0 | 0 | 0 | 0 | |||
| LepMO (n=10) | 100 | 100 | 100 | 100 |
n, number of embryos examined. %, percentages of obviously abnormally staining (e.g. reduced staining intensity or region within the structure compared to the majority of control embryos).
In control embryos or embryos injected with the control 5-misMO, zn5 staining showed that a vertical band in the cerebellum, and six vertical bands in the hindbrain (Fig. 6I and insert, Table 3). Similarly, six zn5 positive vertical bands were also seen in the hindbrain of leptin A or leptin receptor morphants (Fig. 6M and insert). However, there was little or no zn5 staining in the dorsal half of the morphant cerebellum. Most of the dorsal and central optic tectum, anterior half of the cerebellum, and most of the hindbrain were well-labeled with the anti-HuC/D immunostaining in the control embryos or 5-misMO injected embryos (Fig.6J and insert), but the staining was much weaker or absent in the dorsal and central optic tectum, the dorsal half of the cerebellum and dorsal portion of the hindbrain (Fig. 6N and insert). In addition to labeling the retina (see above) , neuroD also strongly labels differentiation brain cells of the developing zebrafish [27]. In control embryos, neuroD expressing cells were found in the central optic tectum, dorsal cerebellum and dorsal hindbrain (Fig. 6O, Table 3), whereas there was little staining in these regions in leptin A morphants (Fig. 6P, Table 3). In contrast, neuroD expression in some cranial and lateral line ganglia (e.g. the vagal ganglion) in the morphants was apparently not decreased (Fig. 6P). These results suggest that dorsal brain differentiation is affected in the leptin A or leptin receptor morphants.
Zn5 also labels motor neuron cell bodies (in the ventral spinal cord) and axons in the spinal nerves (Fig. 6Q). Similar labeling in the spinal cord was observed for both the control and morphant embryos, but the spinal nerves were thicker with several ventral branches originating at the level of myoseptum in the control (Fig. 6Q) or 5-misMO injected embryos (data not shown), whereas the morphant spinal nerves were thinner, branching at various levels, and/or less labeled in the posterior trunk and tail regions of the morphants. Both leptin A morphants (Fig. 6R) and leptin receptor morphants (image not shown, Table 3) showed similar spinal nerve defects.
3.7 Leptin A function in heart, body trunk and tail development
Most moderately affected leptin A (74.5%, n=110) or leptin receptor morphants (68.8%, n=125) had obviously enlarged pericardial cavity (Fig. 3D, H and inserts). We previously showed that differentiation of cardiac cells were disrupted in cadherin-2 mutants (glass onion) and morphants that also showed enlarged pericardial cavity [5]. Here we studied cardiac cell differentiation in leptin A morphants using markers that label developing cardiac cells. Ventricular myosin heavy chain gene ( vmhc ) [59], cardiac myosin light chain 2 gene (cmlc2) , and zn5 (all developmental indicators of the zebrafish embryonic myocardium) were all similarly expressed between morphants and controls for both leptin A and leptin receptor mutants (Supplementary Fig. 1). Heart looping, which becomes detectable around 30 hpf [58] is also similar between morphants and controls for both leptin A and leptin receptor mutants (Supplementary Fig. 1).
A subset of moderately affected leptin A morphants (58.6%, n=103) exhibited obvious body and/or tail kinks. The defects became noticeable at 25 hpf (Sup. Fig. 1K and L), and continued in older embryos (2-7 days old, data not shown). Similar body and/or tail defects were also seen in some moderately affected (60.3%, n=86) leptin receptor morphants (Sup. Fig. 1L insert). Expression of sonic hedgehog mRNA (shh), a major signaling molecule in the developing vertebrate notochord [7], appeared to be similar between the control and morphant embryos (Sup. Fig. 1 I-L).
3.Discussion
4.1 Leptin A and leptin receptor knockdown target reduced leptin A signaling
Our experiments were directed at characterizing the developmental consequences of reduced leptin A signaling in zebrafish. Cyprinid fishes (zebrafish, carps), salmonids, and medaka express 2 isoforms of leptin (A and B), whereas the puffers Tetraodon and Takifugu express a single isoform orthologous to leptin A [30, 50]. The multiple isoforms in cyprinids, salmonids and medaka are likely due to recent genome duplications [13]. Between the two isoforms, it appears that leptin A, and not B is orthologous to mammalian leptins [30], and therefore we designed our experiments to manipulate leptin A. To verify that the observed morphant phenotype was specific to leptin signaling, we also designed an anti leptin-receptor morpholino. The leptin receptor morpholino is directed at the start of ORF in exon 1; therefore all potential isoforms of leptin receptor should have their expression reduced. We recently characterized long-form leptin receptor expression in zebrafish [35].
Leptin expression is highest at fertilization, declines though 24 hpf, then increases (Fig.1A); most of the apparent effects of leptin A knockdown are in older embryos (49 and 72 hpf). This corresponds to higher leptin receptor expression during similar stages of development (24-72 hpf; [35]). Similarly, effects of leptin receptor knockdown are most pronounced in older embryos (Fig. 5). Atlantic salmon also display a peak of leptin A expression at a relatively similar point in their early development [41]. In adults, leptin A expression was detected in many tissues (Fig. 1B). However, the pattern of leptin A expression appears to be highly variable among fishes, exemplified by a general agreement between our results and those for Atlantic salmon leptin A1 [50]. Finally, the high expression leptin in ovary and in 0 hpf embryos is consistent with maternal loading of leptin message, although not definitive without further experimentation.
4.2 Multiple lines of evidence support specificity of leptin A knockdown
We assert that our lepMOs and lepRMO specifically affect translation of zebrafish leptin A and leptin receptor proteins, respectively, based on the following data: (i) Control embryos express a single protein band of the predicted size for zebrafish leptin, and that band is greatly diminished in leptin A morphants (Fig. 2). (ii) Despite great differences in the three MOs sequences, they produced similar phenotypes, while application of the 5-mismatched lepMO1 resulted in embryos that were indistinguishable from uninjected control embryos. We argue that this demonstration of MO’s specificity is rigorous, especially because we demonstrate two distinct MOs, one against a ligand (i.e. leptin A), the other against a receptor (i.e. leptin receptor), can generate almost identical embryonic defects. We did not get a morphological effect with the splice-blocking morpholino. We cannot distinguish if this result is due to maternally inherited transcripts rescuing the effect of the splice-blocker [16]), or that the splice-blocking morpholino is ineffective. In either case, it demonstrates that the morpholinos themselves are not generating these phenotypes through general toxicity. (iii) The sp ecificity of lepMO1 was further demonstrated by our leptin A protein rescuing experiments. Co-injecting recombinant zebrafish leptin A with lepMO1 largely restores the major lepMO1 morphant gross morphological defects (e.g. smaller eye, smaller and/or curved body, enlarged pericardial cavity and larger yolk; Fig. 4). Further, our recent experiments show that the leptin A morphants have a reduced metabolic rate, and co-injection of recombinant leptin A rescues metabolic rate (Dalman et al., in review). The degree of rescue was related to concentration of recombinant leptin A co-injected (Fig. 4, Table 2), yet even the best rescued embryos displayed slight lepMO1-like defects. This lack of complete rescue could be due to insufficient concentration of leptin A protein applied (limited by the concentration at which we stably store leptin A at −80°C). Alternatively, leptin A turnover or clearance could be high [10], and since de novo translation of leptin A is blocked, effective leptin A concentration continually decreases steadily as the embryo develops. (iv) Both leptin A and leptin receptor mRNAs are expressed throughout embryonic (0-49 hpf) and larval (3-5 dpf) development, both increase > 24 hpf, and apparent defects in the morphants are seen around 24 hpf (e.g. small eye and kinked body trunk) and in older embryos (e.g. dorsal brain and RGCs defects, larger yolk). (v) The notochord is the the structure that contains the highest leptin receptor expression in 20-43 hpf embryos [35] and reducing leptin A or leptin receptor function produced the expected body trunk defects (e.g. lateral kinks) that are somewhat similar to zebrafish embryos with defective notochord development [33, 44, 46, 54]. (vi) The phenotype of the morphants is entirely consistent with a reduction in leptin A signaling. From these multiple and internally consistent data, we assert that the MO-phenotypes are due to reduced leptin A signaling vs. a general non-specific effect on development.
4.3 Leptin A morphants have apparent reduced yolk catabolism
Although the list of functions that are influenced by leptin signaling is long and ever growing, a primary function appears to be storage and mobilization of lipid reserves. Fish have distinct adipose tissue, but also store significant amounts of lipid in liver and muscle [52]. We found detectable expression of leptin A in adult liver (Fig. 1B), and not in muscle, although we previously documented high leptin receptor expression in muscle [35]. We also documented high expression of leptin A in gonad, similar to that reported by Gorissen et al. [19]. In fish embryos, the largest store of lipid is the yolk; therefore if lipid mobilization is compromised in the leptin A morphants, it should be evident in the yolk. Indeed, leptin A and leptin receptor (Fig. 3) morphants have significantly larger yolk circumference at 49 hpf. Earlier in development (<24hpf), there is no obvious difference in yolk circumference. This may be due to the timing of leptin A (Fig. 1A) or leptin receptor [35] expression, which both increase >24hpf. We assert that this is a direct effect of reduced leptin A signaling, rather than the morphants simply being developmentally delayed. Some aspects of the fish development (e.g. body size) are delayed (likely due to reduced conversion of the yolk to the embryonic proper), but others are more similar between the morphants and control embryos including looped heart (sup. Fig. 1), head and body trunk angle, expression of zn5 in the hindbrain (Fig. 6), and expression of vmhc in the trunk muscles (sup. Fig. 1E). Supporting the idea that leptin A signaling regulates yolk catabolism, we found that the leptin receptor was expressed in the yolk of young zebrafish embryos [35]. Therefore the lipid mobilization aspect of leptin A signaling appears to be conserved between mammals and zebrafish.
4.4 Leptin A morphants have reduced sensory structures
We observed decreased eye size and disrupted retinal ganglion cell development in zebrafish morphants (Figs. 5 & 6, Table 3). It is unclear as to how leptin A exerts its effect on early eye development, because obvious leptin receptor expression (in situ hybridization data) in the eye begins about the third day of development in the iris of the embryonic zebrafish [35]. It is possible that the young embryonic zebrafish eye primordium and/or eye expresses leptin receptor, but their expression levels are too low to be detected by standard in situ hybridization method. It is unlikely that leptin A‘s influence on eye development is directly related to yolk catabolism, because the eye is already greatly smaller in leptin A and leptin receptor morphants at 25 hpf when there is no significant difference in the yolk size between the control and morphant embryos. Embryonic and adult mice also express leptin receptor in the eye [9, 11], suggesting that intact leptin A signaling is important for eye development. [51].
We also observed strong leptin receptor expression in the zebrafish otic vesicle [35], and leptin A and leptin receptor morphants have impaired to absent semicircular canal development (Fig. 5). Again as in the eye, it is unclear as to how leptin A functions in early ear development, because apparent leptin receptor expression in the ear begins in 3-day old larvae (in situ hybridization data, [35]. Also as in the eye, leptin A may affect early ear development directly (if low levels of leptin receptor are expressed by the otic placode (the precursor of the otic vesicle) and/or otic vesicle of younger embryos), or indirectly via interaction with other molecules or by controlling yolk catabolism. Leptin receptor expression has recently been documented in guinea pig ear [21], and ob/ob mice are deaf as adults, with significant degeneration of the organ of Corti by 21 weeks [32]. Although we do not know the mechanism by which inner ear development is impaired in zebrafish leptin A morphants, this suggests that intact leptin A signaling is required for functional inner ear development in fish and mammals.
Conclusions
These data suggest that leptin A signaling may play an essential role in development of sensory systems of vertebrates. Further, we assert that this aspect of leptin A signaling has not and would not have been obvious without taking a comparative approach to understanding leptin A function. Given that the number of non-mammal leptin clones has grown substantially in the last five years, we predict that comparative studies will add greatly to our understanding of leptin signaling in all vertebrates.
Supplementary Material
Supplementary Figure 1. Development of the heart and body trunk in leptin A and/or leptin receptor morphants. Panels A-H show cardiac and skeletal muscle differentiation, while the remaining panels show body trunk defects in the morphants. Panels D, H, inserts in panels J and L are from embryos processed for whole mount immunostaining. The remaining panels and inserts show embryos processed for whole mount in situ hybridization. Panels A and E (anterior half), D and H (heart), I and K (posterior half) are lateral views (anterior to the left and dorsal up) of the embryos. Panels B, C, F, G and their inserts are ventral views (anterior to the top) of the head region focusing on the heart. Panels J, L and their inserts show dorsal views (anterior to the left) of the embryos. Abbreviations: a, atrium; h, head ; nc, notochord; tr, body trunk; v, ventricle. For panels A-H, each image in the top row has the same magnification as the one below it in the bottom row. Panels I-L are of the same magnification. All scale bars = 100 μm).
Footnotes
Publisher's Disclaimer: This is a PDF file of an unedited manuscript that has been accepted for publication. As a service to our customers we are providing this early version of the manuscript. The manuscript will undergo copyediting, typesetting, and review of the resulting proof before it is published in its final citable form. Please note that during the production process errors may be discovered which could affect the content, and all legal disclaimers that apply to the journal pertain.
References
- 1.Ahima RS. Adipose tissue as an endocrine organ. Obesity (Silver Spring) 2006;14(Suppl 5):242S–249S. doi: 10.1038/oby.2006.317. [DOI] [PubMed] [Google Scholar]
- 2.Andermann P, Ungos J, Raible DW. Neurogenin1 defines zebrafish cranial sensory ganglia precursors. Dev Biol. 2002;251:45–58. doi: 10.1006/dbio.2002.0820. [DOI] [PubMed] [Google Scholar]
- 3.Ando H, Kobayashi M, Tsubokawa T, Uyemura K, Furuta T, Okamoto H. Lhx2 mediates the activity of Six3 in zebrafish forebrain growth. Dev Biol. 2005;287:456–68. doi: 10.1016/j.ydbio.2005.09.023. [DOI] [PubMed] [Google Scholar]
- 4.Babb SG, Kotradi SM, Shah B, Chiappini-Williamson C, Bell LN, Schmeiser G, Chen E, Liu Q, Marrs JA. Zebrafish R-cadherin (Cdh4) controls visual system development and differentiation. Dev Dyn. 2005;233:930–45. doi: 10.1002/dvdy.20431. [DOI] [PubMed] [Google Scholar]
- 5.Bagatto B, Francl J, Liu B, Liu Q. Cadherin2 (N-cadherin) plays an essential role in zebrafish cardiovascular development. BMC Dev Biol. 2006;6:23. doi: 10.1186/1471-213X-6-23. [DOI] [PMC free article] [PubMed] [Google Scholar]
- 6.Belgardt BF, Brüning JC. CNS leptin and insulin action in the control of energy homeostasis. Ann N Y Acad Sci. 2010;1212:97–113. doi: 10.1111/j.1749-6632.2010.05799.x. [DOI] [PubMed] [Google Scholar]
- 7.Briscoe J, Pierani A, Jessell TM, Ericson J. A homeodomain protein code specifies progenitor cell identity and neuronal fate in the ventral neural tube. Cell. 2000;101:435–45. doi: 10.1016/s0092-8674(00)80853-3. [DOI] [PubMed] [Google Scholar]
- 8.Burrill JD, Easter SS., Jr. Development of the retinofugal projections in the embryonic and larval zebrafish (Brachydanio rerio) J Comp Neurol. 1994;346:583–600. doi: 10.1002/cne.903460410. [DOI] [PubMed] [Google Scholar]
- 9.Camand O, Turban S, Abitbol M, Guerre-Millo M. Embryonic expression of the leptin receptor gene in mesoderm-derived tissues. C R Biol. 2002;325:77–87. doi: 10.1016/s1631-0691(02)01417-8. [DOI] [PubMed] [Google Scholar]
- 10.Ceccarini G, Flavell RR, Butelman ER, Synan M, Willnow TE, Bar-Dagan M, Goldsmith SJ, Kreek MJ, Kothari P, Vallabhajosula S, Muir TW, Friedman JM. PET imaging of leptin biodistribution and metabolism in rodents and primates. Cell Metab. 2009;10:148–59. doi: 10.1016/j.cmet.2009.07.001. [DOI] [PMC free article] [PubMed] [Google Scholar]
- 11.Chen SC, Cunningham JJ, Smeyne RJ. Expression of OB receptor splice variants during prenatal development of the mouse. J Recept Signal Transduct Res. 2000;20:87–103. doi: 10.3109/10799890009150039. [DOI] [PubMed] [Google Scholar]
- 12.Crespi EJ, Denver RJ. Leptin (ob gene) of the South African clawed frog Xenopus laevis. Proc Natl Acad Sci U S A. 2006;103:10092–7. doi: 10.1073/pnas.0507519103. [DOI] [PMC free article] [PubMed] [Google Scholar]
- 13.David L, Blum S, Feldman MW, Lavi U, Hillel J. Recent duplication of the common carp (Cyprinus carpio L.) genome as revealed by analyses of microsatellite loci. Mol Biol Evol. 2003;20:1425–34. doi: 10.1093/molbev/msg173. [DOI] [PubMed] [Google Scholar]
- 14.Donato J, Cravo RM, Frazão R, Elias CF. Hypothalamic sites of leptin action linking metabolism and reproduction. Neuroendocrinology. 2011;93:9–18. doi: 10.1159/000322472. [DOI] [PMC free article] [PubMed] [Google Scholar]
- 15.Driessler F, Baldock PA. Hypothalamic regulation of bone. J Mol Endocrinol. 2010;45:175–81. doi: 10.1677/JME-10-0015. [DOI] [PubMed] [Google Scholar]
- 16.Eisen JS, Smith JC. Controlling morpholino experiments: Don’t stop making antisense. Development. 2008;135:1735–43. doi: 10.1242/dev.001115. [DOI] [PubMed] [Google Scholar]
- 17.Ekker SC. Morphants: a new systematic vertebrate functional genomics approach. Yeast. 2000;17:302–306. doi: 10.1002/1097-0061(200012)17:4<302::AID-YEA53>3.0.CO;2-#. [DOI] [PMC free article] [PubMed] [Google Scholar]
- 18.Frøiland E, Murashita K, Jørgensen EH, Kurokawa T. Leptin and ghrelin in anadromous Arctic charr: cloning and change in expressions during a seasonal feeding cycle. Gen Comp Endocrinol. 2010;165:136–43. doi: 10.1016/j.ygcen.2009.06.010. [DOI] [PubMed] [Google Scholar]
- 19.Gorissen M, Bernier NJ, Nabuurs SB, Flik G, Huising MO. Two divergent leptin paralogues in zebrafish (Danio rerio ) that originate early in teleostean evolution. J Endocrinol. 2009;201:329–39. doi: 10.1677/JOE-09-0034. [DOI] [PubMed] [Google Scholar]
- 20.Haddon C, Lewis J. Early ear development in the embryo of the zebrafish, Danio rerio. J Comp Neurol. 1996;365:113–28. doi: 10.1002/(SICI)1096-9861(19960129)365:1<113::AID-CNE9>3.0.CO;2-6. [DOI] [PubMed] [Google Scholar]
- 21.Horner KC, Troadec JD, Blanchard MP, Dallaporta M, Pio J. Receptors for leptin in the otic labyrinth and the cochlear-vestibular nerve of guinea pig are modified in hormone-induced anorexia. Heart Res. 2010;270:48–55. doi: 10.1016/j.heares.2010.09.009. [DOI] [PubMed] [Google Scholar]
- 22.Huising MO, Geven EJ, Kruiswijk CP, Nabuurs SB, Stolte EH, Spanings FA, Verburg-van Kemenade BM, Flik G. Increased leptin expression in common carp (Cyprinus carpio) after food intake but not after fasting or feeding to satiation. Endocrinology. 2006;147:5786–97. doi: 10.1210/en.2006-0824. [DOI] [PubMed] [Google Scholar]
- 23.Inoue T, Hojo M, Bessho Y, Tano Y, Lee JE, Kageyama R. Math3 and NeuroD regulate amacrine cell fate specification in the retina. Development. 2002;129:831–42. doi: 10.1242/dev.129.4.831. [DOI] [PubMed] [Google Scholar]
- 24.Johnson RM, Johnson TM, Londraville RL. Evidence for leptin expression in fishes. J Exp Zool. 2000;286:718–24. doi: 10.1002/(sici)1097-010x(20000601)286:7<718::aid-jez6>3.0.co;2-i. [DOI] [PMC free article] [PubMed] [Google Scholar]
- 25.Karsenty G, Oury F. The central regulation of bone mass, the first link between bone remodeling and energy metabolism. J Clin Endocrinol Metab. 2010;95:4795–801. doi: 10.1210/jc.2010-1030. [DOI] [PubMed] [Google Scholar]
- 26.Knaut H, Blader P, Strähle U, Schier AF. Assembly of trigeminal sensory ganglia by chemokine signaling. Neuron. 2005;47:653–66. doi: 10.1016/j.neuron.2005.07.014. [DOI] [PubMed] [Google Scholar]
- 27.Korzh V, Sleptsova I, Liao J, He J, Gong Z. Expression of zebrafish bHLH genes ngn1 and nrd defines distinct stages of neural differentiation. Dev Dyn. 1998;213:92–104. doi: 10.1002/(SICI)1097-0177(199809)213:1<92::AID-AJA9>3.0.CO;2-T. [DOI] [PubMed] [Google Scholar]
- 28.Krauss S, Concordet JP, Ingham PW. A functionally conserved homolog of the Drosophila segment polarity gene hh is expressed in tissues with polarizing activity in zebrafish embryos. Cell. 1993;75:1431–44. doi: 10.1016/0092-8674(93)90628-4. [DOI] [PubMed] [Google Scholar]
- 29.Krauss S, Johansen T, Korzh V, Fjose A. Expression pattern of zebrafish pax genes suggests a role in early brain regionalization. Nature. 1991;353:267–70. doi: 10.1038/353267a0. [DOI] [PubMed] [Google Scholar]
- 30.Kurokawa T, Murashita K. Genomic characterization of multiple leptin genes and a leptin receptor gene in the Japanese medaka, Oryzias latipes. Gen Comp Endocrinol. 2009;161:229–37. doi: 10.1016/j.ygcen.2009.01.008. [DOI] [PubMed] [Google Scholar]
- 31.Kurokawa T, Uji S, Suzuki T. Identification of cDNA coding for a homologue to mammalian leptin from pufferfish, Takifugu rubripes. Peptides. 2005;26:745–50. doi: 10.1016/j.peptides.2004.12.017. [DOI] [PubMed] [Google Scholar]
- 32.Lee HS, Kim KR, Chung WH, Cho YS, Hong SH. Early sensorineural hearing loss in ob/ob mouse, an animal model of type 2 diabetes. Clin Exp Otorhinolaryngol. 2008;1:211–6. doi: 10.3342/ceo.2008.1.4.211. [DOI] [PMC free article] [PubMed] [Google Scholar]
- 33.Liu B, Duff R. Joel, Londraville RL, Marrs JA, Liu Q. Cloning and expression analysis of cadherin7 in the central nervous system of the embryonic zebrafish. Gene Expr Patterns. 2007;7:15–22. doi: 10.1016/j.modgep.2006.05.002. [DOI] [PMC free article] [PubMed] [Google Scholar]
- 34.Liu Q, Babb SG, Novince ZM, Doedens AL, Marrs J, Raymond PA. Differential expression of cadherin-2 and cadherin-4 in the developing and adult zebrafish visual system. Vis Neurosci. 2001;18:923–33. [PubMed] [Google Scholar]
- 35.Liu Q, Chen Y, Copeland D, Ball H, Duff RJ, Rockich B, Londraville RL. Expression of leptin receptor gene in developing and adult zebrafish. Gen Comp Endocrinol. 2010;166:346–55. doi: 10.1016/j.ygcen.2009.11.015. [DOI] [PMC free article] [PubMed] [Google Scholar]
- 36.Liu Q, Londraville R, Azodi E, Babb S, Chiappini C, Marrs J, Raymond P. Up-regulation of cadherin-2 and cadherin-4 in regenerating visual structures of adult zebrafish. Exp Neurol. 2002;177 doi: 10.1006/exnr.2002.8008. [DOI] [PubMed] [Google Scholar]
- 37.Liu Q, Sanborn KL, Cobb N, Raymond PA, Marrs JA. R-cadherin expression in the developing and adult zebrafish visual system. J Comp Neurol. 1999;410:303–19. doi: 10.1002/(sici)1096-9861(19990726)410:2<303::aid-cne11>3.0.co;2-b. [DOI] [PubMed] [Google Scholar]
- 38.Londraville R, Niewiarowski P. Leptin signaling systems in reptiles and amphibians. In: Paolucci M, editor. Leptin in Non-mammalian Vertebrates. Transworld Research Network; Kerala, India: 2011. [Google Scholar]
- 39.Malicki J, Jo H, Pujic Z. Zebrafish N-cadherin, encoded by the glass onion locus, plays an essential role in retinal patterning. Dev Biol. 2003;259:95–108. doi: 10.1016/s0012-1606(03)00181-7. [DOI] [PubMed] [Google Scholar]
- 40.Masai I, Lele Z, Yamaguchi M, Komori A, Nakata A, Nishiwaki Y, Wada H, Tanaka H, Nojima Y, Hammerschmidt M, Wilson SW, Okamoto H. N-cadherin mediates retinal lamination, maintenance of forebrain compartments and patterning of retinal neurites. Development. 2003;130:2479–94. doi: 10.1242/dev.00465. [DOI] [PubMed] [Google Scholar]
- 41.Moen AG, Murashita K, Finn RN. Ontogeny of energy homeostatic pathways via neuroendocrine signaling in Atlantic salmon. Dev Neurobiol. 2010;70:649–58. doi: 10.1002/dneu.20803. [DOI] [PubMed] [Google Scholar]
- 42.Morrow EM, Furukawa T, Lee JE, Cepko CL. NeuroD regulates multiple functions in the developing neural retina in rodent. Development. 1999;126:23–36. doi: 10.1242/dev.126.1.23. [DOI] [PubMed] [Google Scholar]
- 43.Nasevicius A, Ekker SC. Effective targeted gene ‘knockdown’ in zebrafish. Nat Genet. 2000;26:216–20. doi: 10.1038/79951. [DOI] [PubMed] [Google Scholar]
- 44.Odenthal J, Haffter P, Vogelsang E, Brand M, van Eeden FJ, Furutani-Seiki M, Granato M, Hammerschmidt M, Heisenberg CP, Jiang YJ, Kane DA, Kelsh RN, Mullins MC, Warga RM, Allende ML, Weinberg ES, Nusslein-Volhard C. Mutations affecting the formation of the notochord in the zebrafish, Danio rerio. Development. 1996;123:103–15. doi: 10.1242/dev.123.1.103. [DOI] [PubMed] [Google Scholar]
- 45.Oxtoby E, Jowett T. Cloning of the zebrafish krox-20 gene (krx-20) and its expression during hindbrain development. Nucleic Acids Res. 1993;21:1087–95. doi: 10.1093/nar/21.5.1087. [DOI] [PMC free article] [PubMed] [Google Scholar]
- 46.Parsons MJ, Pollard SM, Saude L, Feldman B, Coutinho P, Hirst EM, Stemple DL. Zebrafish mutants identify an essential role for laminins in notochord formation. Development. 2002;129:3137–46. doi: 10.1242/dev.129.13.3137. [DOI] [PubMed] [Google Scholar]
- 47.Pénicaud L. The neural feedback loop between the brain and adipose tissues. Endocr Dev. 2010;19:84–92. doi: 10.1159/000316900. [DOI] [PubMed] [Google Scholar]
- 48.Pfundt B, Sauerwein H, Mielenz M. Leptin mRNA and protein immunoreactivity in adipose tissue and liver of rainbow trout (Oncorhynchus mykiss) and immunohistochemical localization in liver. Anat Histol Embryol. 2009;38:406–10. doi: 10.1111/j.1439-0264.2009.00951.x. [DOI] [PubMed] [Google Scholar]
- 49.Roa J, Tena-Sempere M. Energy balance and puberty onset: emerging role of central mTOR signaling. Trends Endocrinol Metab. 2010;21:519–28. doi: 10.1016/j.tem.2010.05.003. [DOI] [PubMed] [Google Scholar]
- 50.Rønnestad I, Nilsen TO, Murashita K, Angotzi AR, Gamst AG, Moen SO, Stefansson P, Kling B, Björnsson T, Kurokawa T. Leptin and leptin receptor genes in Atlantic salmon: Cloning, phylogeny, tissue distribution and expression correlated to long-term feeding status. Gen Comp Endocrinol. 2010;168:55–70. doi: 10.1016/j.ygcen.2010.04.010. [DOI] [PubMed] [Google Scholar]
- 51.Sheffield VC. The blind leading the obese: The molecular pathophysiology of a human obesity syndrome. Trans Am Clin Climatol Assoc. 2010;121:172–82. [PMC free article] [PubMed] [Google Scholar]
- 52.Sheridan MA. Lipid dynamics in fish: aspects of absorption, transportation, deposition, and mobilization. Comparative Biochemistry and Physiology. 1988;90B:679–690. doi: 10.1016/0305-0491(88)90322-7. [DOI] [PubMed] [Google Scholar]
- 53.Stuermer CA. Retinotopic organization of the developing retinotectal projection in the zebrafish embryo. J Neurosci. 1988;8:4513–30. doi: 10.1523/JNEUROSCI.08-12-04513.1988. [DOI] [PMC free article] [PubMed] [Google Scholar]
- 54.Talbot WS, Trevarrow B, Halpern ME, Melby AE, Farr G, Postlethwait JH, Jowett T, Kimmel CB, Kimelman D. A homeobox gene essential for zebrafish notochord development. Nature. 1995;378:150–7. doi: 10.1038/378150a0. [DOI] [PubMed] [Google Scholar]
- 55.Tang R, Dodd A, Lai D, McNabb WC, Love DR. Validation of zebrafish (Danio rerio) reference genes for quantitative real-time RT-PCR normalization. Acta Biochim Biophys Sin (Shanghai) 2007;39:384–90. doi: 10.1111/j.1745-7270.2007.00283.x. [DOI] [PMC free article] [PubMed] [Google Scholar]
- 56.Westerfield M. The Zebrafish Book. A guide for the laboratory use of zebrafish (Danio rerio) 5th edition Univ. of Oregon Press; Eugene, OR: 2007. [Google Scholar]
- 56.Yan RT, Ma W, Liang L, Wang SZ. bHLH genes and retinal cell fate specification. Mol Neurobiol. 2005;32:157–71. doi: 10.1385/MN:32:2:157. [DOI] [PMC free article] [PubMed] [Google Scholar]
- 58.Yelon D. Cardiac patterning and morphogenesis in zebrafish. Dev Dyn. 2001;222:552–63. doi: 10.1002/dvdy.1243. [DOI] [PubMed] [Google Scholar]
- 59.Yelon D, Stainier DY. Patterning during organogenesis: genetic analysis of cardiac chamber formation. Semin Cell Dev Biol. 1999;10:93–8. doi: 10.1006/scdb.1998.0278. [DOI] [PubMed] [Google Scholar]
- 60.Zhang Y, Proenca R, Maffei M, Barone M, Leopold L, Friedman JM. Positional cloning of the mouse obese gene and it human homologue. Nature. 1994;372:425–431. doi: 10.1038/372425a0. [DOI] [PubMed] [Google Scholar]
Associated Data
This section collects any data citations, data availability statements, or supplementary materials included in this article.
Supplementary Materials
Supplementary Figure 1. Development of the heart and body trunk in leptin A and/or leptin receptor morphants. Panels A-H show cardiac and skeletal muscle differentiation, while the remaining panels show body trunk defects in the morphants. Panels D, H, inserts in panels J and L are from embryos processed for whole mount immunostaining. The remaining panels and inserts show embryos processed for whole mount in situ hybridization. Panels A and E (anterior half), D and H (heart), I and K (posterior half) are lateral views (anterior to the left and dorsal up) of the embryos. Panels B, C, F, G and their inserts are ventral views (anterior to the top) of the head region focusing on the heart. Panels J, L and their inserts show dorsal views (anterior to the left) of the embryos. Abbreviations: a, atrium; h, head ; nc, notochord; tr, body trunk; v, ventricle. For panels A-H, each image in the top row has the same magnification as the one below it in the bottom row. Panels I-L are of the same magnification. All scale bars = 100 μm).