Abstract
Advanced magnetic resonance (MR) relaxation and diffusion correlation measurements and imaging provide a means to non-invasively monitor gelation for biotechnology applications. In this study, MR is used to characterize physical gelation of three alginates with distinct chemical structures; an algal alginate, which is not O-acetylated but contains poly guluronate (G) blocks, bacterial alginate from Pseudomonas aeruginosa, which does not have poly-G blocks, but is O-acetylated at the C2 and/or C3 of the mannuronate residues, and alginate from a P. aeruginosa mutant that lacks O-acetyl groups. The MR data indicate that diffusion-reaction front gelation with Ca2+ ions generates gels of different bulk homogeneity dependent on the alginate structure. Shorter spin-spin T2 magnetic relaxation times in the alginate gels that lack O-acetyl groups indicate stronger molecular interaction between the water and biopolymer. The data characterize gel differences over a hierarchy of scales from molecular to system size.
Keywords: Magnetic resonance, microbial alginate, physical gelation, gel structure, Pseudomonas aeruginosa
1. Introduction
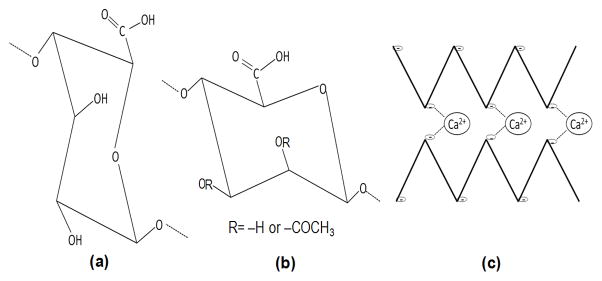
Alginate is a biologically synthesized polymer that is commonly used as a food additive, for biomedical applications, including tissue constructs (Langer and Vacanti, 1999), microfluidic device manufacture (Cabodi et al., 2005) and in some bandages to promote wound healing. Alginates are mixed polysaccharides composed of α-L-guluronate residues and β-D-mannuronate residues linked by β-1-4 glycosidic bonds, produced by brown algae and by bacteria of the genera, Pseudomonas and Azotobacter. The chemical structures of the alginate subunits are shown in Figure 1, and the mechanism of bacterial alginate biosynthesis was described in a recent review (Franklin et al., 2011). The gelation properties of alginate, which are important for its biotechnological applications, are dependent on the alginate structure and on its molecular weight (Storz et al., 2009; Windhues and Borchard, 2003). The structures of alginates vary depending on their source. Rather than repeating polymers of the two uronic acid subunits, the G and M residues are interspersed randomly, with algal alginates containing blocks of repeating G subunits. Azotobacter vinlandii alginate also contains G-blocks, but G-blocks are not found in alginates from Pseudomonas spp. Another structural difference is that the bacterial alginates are often O-acetylated at the C2 and/or C3 positions of the D-mannuronate residues, whereas the algal alginate does not contain O-acetyl groups. Research on algal alginate since the 1970s has shown that G-blocks will align and bind to the positive ions in an ordered “egg-box” structure (Grant et al., 1973)(Fig 1). However, the M units are also known to be important to gel formation and structure, particularly in high molecular weight alginates such as the bacterial alginates studied in this research (Donati et al., 2005; Schurks et al., 2002). The degree of O-acetylation of the alginate also affects the gelation properties, but the mechanism for this is not well understood (Degrassi et al., 1998). Non-acetylated alginates produce gels that are stronger than acetylated alginates (Skjakbraek et al., 1989). As shown in the magnetic resonance (MR) images presented below in Figure 2, O-acetylation also appears to affect the homogeneity of the gel.
Figure 1.
(a) α-L-guluronate (G), and (b) β-D-mannuronate (M), form the anionic polysaccharides that make up alginate. (c) Alginate (indicated by the bold lines) is known to order into an “egg box” formation when a divalent cation is introduced, forming a gel. The cation, such as Ca2+, will covalently bond (indicated by the dashed lines) with the negative charges on the deprotanated carboxyl groups (indicated by the (−)) of the G units in the alginate chain.
Figure 2.
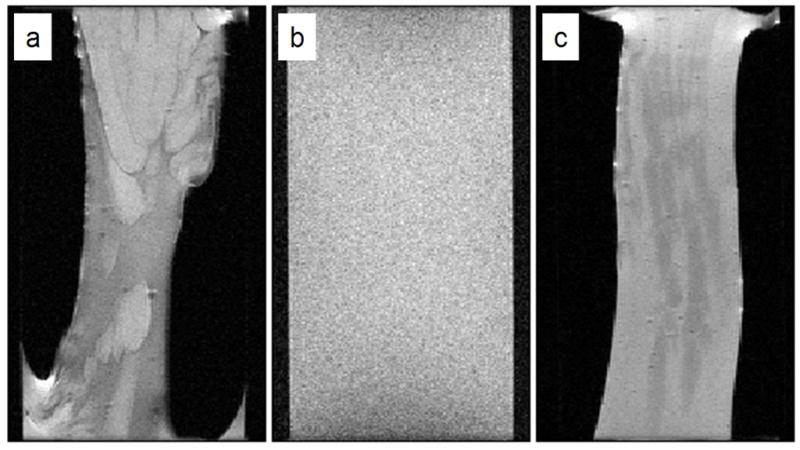
MRI images of alginate gels obtained from (a) FRD1153, (b) algae, and (c) FRD1. These T2 maps demonstrate the variation in heterogeneity between the three gels prepared in the same fashion. These images were obtained after the gelation process had been completed and the bulk water drained. The images have a FOV of 20 mm in the frequency encode direction and 13 mm in the phase encode direction, the resulting resolution being 78 × 102 μm over a slice thickness of 1 mm. Sixteen echoes were collected with a TE = 11 ms and the TR = 1 s.
In addition to its importance for biomaterials and as a food additive, gelation of alginate may also be important for a certain infectious disease process. Pseudomonas aeruginosa causes chronic pulmonary infections of patients with the genetic disorder, cystic fibrosis (CF) (Lyczak et al., 2000). CF patients are prone to many acute bacterial infections, including from strains of P. aeruginosa. Over time the P. aeruginosa strains convert to an alginate overproduction (mucoid) phenotype. Mucoid P. aeruginosa strains often cause chronic pulmonary infections. When the alginate comes in contact with divalent cations, most commonly calcium in the body, it forms a rigid gel. Gel formation may play a role in chronic infections by contributing to the protection of the bacterial cells from the host immune response, since the structure of alginate is important for chronic infections. In particular, the presence of O-acetyl groups on the alginate provides the bacteria with greater resistance to opsonic phagocytosis (Pier et al., 2001) than does alginate lacking O-acetyl groups. Enhanced understanding of the molecular origin of physical gelation behavior in microbial and algal alginates will impact both biomedical and biotechnology applications.
Magnetic resonance (MR) techniques including spectroscopy (Schurks et al., 2002; Shapiro, 2011), imaging (Degrassi et al., 1998; Maneval et al., 2011), and pulsed-field-gradient spin-echo (PGSE) (Hornemann et al., 2008; Vogt et al., 2000; Walderhaug et al., 2010) have been utilized for many years to study alginate and other biopolymer systems including biofilms. The study of MR relaxation processes of biopolymer systems provides unique data on molecular dynamics and interactions (Hills et al., 1989). MR relaxation measurements are affected by hydrogen exchange between the water and the biopolymer and diffusive exchange between the bulk water and water interacting with the biopolymer. Recently, two dimensional MR relaxation and diffusion correlation experiments have been performed on a number of diverse systems, including real and model porous media, food, gels, and protein solutions (Iuliano et al., 2010; Mitchell et al., 2007; Monteilhet et al., 2006; Qiao et al., 2005; Song, 2009; Venturi et al., 2008; Washburn and Callaghan, 2006). In this work, we use MR properties and techniques to compare gels formed by physical gelation with calcium ions added to 2% by weight solutions of three alginates produced from different organisms: brown algae, P. aeruginosa FRD1, and the O-acetyl mutant derivative P. aeruginosa FRD1153.
2. Materials and Methods
2.1 Alginate Solution and Gel Preparation
2.1.1 Alginate Isolation
The bacterial strains used in this study were P. aeruginosa FRD1 and the O-acetylation deficient derivative, FRD1153 (Franklin and Ohman, 1993). Alginate was purified from these strains using the procedure described previously (Franklin and Ohman, 1993), but scaled up to increase the mass of alginate purified. The bacteria were first cultured on agar plates and incubated for 20 h. at 37°C. A mucoid colony was selected from the plate, and inoculated into 10 ml of Luria Broth (LB) (Difco) in a 125 ml baffled flask. The culture was incubated with shaking at 220 rpm for 24 h. at 37°C. Two ml of the culture was used to inoculate a 400 ml volume of LB in a 1000 ml baffled flask. The culture was incubated with shaking for 24 h. at 200 rpm. The culture was diluted with an equal volume of 0.85% NaCl to reduce viscosity and the culture supernatant containing the secreted alginate was separated from the cells by centrifugation at 10,000 rpm for 20 min at 20°C. Cetyl-pyridinium chloride (C21H38ClN), 200 ml of a 2 wt% solution, was used to precipitate the alginate from the culture supernatants. The precipitates were dissolved in 200 ml of 1 M NaCl by shaking at 37°C for 24 h. The samples were centrifuged to remove the remaining cellular debris, and an equal volume of isopropanol was added to the supernatant to precipitate the alginate again. The precipitated polymer was then dissolved in 200 ml of 0.85% NaCl. The isopropanol precipitation and resuspension procedure was repeated several times until the alginate solution was clear and colorless. The polysaccharide was then dialyzed for 24 h. against distilled water using Spectra/Por dialysis membrane with a molecular weight cutoff of 10,000. The purified polymer was then lyophilized to allow for rehydration at a controlled weight percent.
2.1.2 Alginate and ion solution preparation
Alginates were prepared as 2 wt% solutions by dissolving sodium alginate powder from a brown algae source (Acros Organics, Geel, Belgium), or lyophilized FRD1 or FRD1153 into deionized water with stirring. Once dissolved, the solutions were stored in a refrigerator until use. An ion solution of 1M calcium chloride (CaCl2) was prepared with nanopure water. CaCl2 and algal alginate were used without further purification.
2.1.3 Gel sample preparation
Glass MR tubes (inner diameter 11.4 mm, length 10 cm) were cleaned with ethanol before being coated twice with a thin layer of alginate solution dried onto the tubes in a 110°C oven for 1 hour. In previous research (Maneval et al., 2011) this technique was used to adhere the gel to the tube walls. The coated tubes were then filled with the alginate solution and stored overnight to allow degassing. A polystyrene annulus with an outer diameter of 9.5 mm and an inner diameter of 5.3 mm was then placed on top of the alginate solution to stabilize the ion – alginate solution interface. Approximately 2 ml of the 1 M CaCl2 solution was added with a pipette. After 2–5 minutes, the tube was gently placed in the MR probe to start the measurements. MR measurements were then conducted as Ca2+ ions diffused into the alginate solution causing gelation along the reaction front. After it was fully gelled, the bulk water was drained from the tube to more accurately measure the differences between the gels without the influence of the surrounding water. The contraction during gelation in the bacterial alginate gels resulted in more dense polymer concentrations and decreased volume occupied by the gels.
2.2 Magnetic Resonance (MR) Techniques and Experiments
2.2.1 MR relaxation
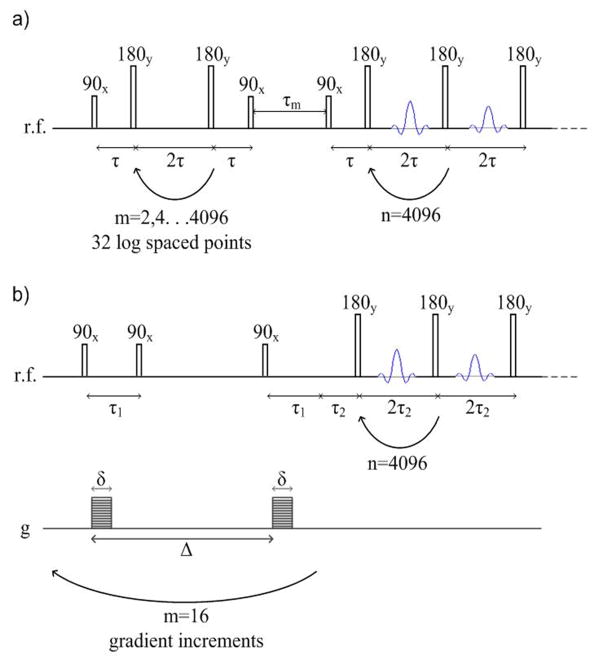
Spin-lattice (T1) relaxation of the MR signal occurs due to interaction in the longitudinal direction along the applied magnetic field (B0), and spin-spin dipolar (T2) relaxation occurs due to interactions transverse to B0. The T2 relaxation is dependent on rotational mobility of the proton (1H) nuclei. For protons on the polymer, T2 is on the order of milliseconds while in the bulk water it is on the order of seconds. The measurement of T2 using a standard CPMG pulse sequence (Carr and Purcell, 1954), shown in Figure 3, is also sensitive to the time scale of the measurement, in particular the 2 time spacing between the 180° radio frequency (rf) pulses. The relaxation data are impacted by this spacing, depending on several complex mechanisms that contribute to T2 relaxation in polymer systems, including hydrogen exchange between the polymer protons and water protons (Carver and Richards, 1972) and water interactions with the polymer chains (Turco et al., 2011).
Figure 3.
2D diffusion and relaxation correlation MR pulse sequences. Both utilize a CPMG measurement with a 2τ spacing of 400 μs and 4096 echoes in the direct dimension. a) T2-T2 pulse sequence, which encodes for T2 relaxation in the indirect dimension by applying a logarithmically varying number between 2 and 4096 series of 180 pulses. b) D-T2 pulse sequence, which encodes for diffusion in the indirect direction using a stimulated echo PGSE sequence with 26 linearly varying gradient pulses between g = 0 and 1.48 T/m.
2.2.2 MRI experiments
MRI experiments were conducted using a 15 mm diameter rf coil on a Micro 2.5 imaging probe with maximum gradient strengths of 1.48 T/m in three directions on a 300 MHz (1H frequency) Bruker magnet networked to an AVANCE III spectrometer. After CaCl2 was added to the alginate solution, a series of MR experiments including relaxation time weighted 2D images, 1D spatial profiles, and diffusion measurements with acquisition times totaling 15 minutes were repeated for approximately 10 hours to monitor gel formation (Maneval et al., 2011). After the gelation process was complete, a series of 2D relaxation and diffusion correlation measurements were conducted. The water surrounding the gel was then drained and the same set of experiments was repeated. The gels were then aged for 10 days and the experiments were, again, repeated. This same experiment sequence was followed for all three alginate samples.
2.2.3 MR experimental details
2D images of a slice of the tube reactor spatially resolved in radial and axial directions were collected with a standard multi-echo (CPMG) spin-warp imaging sequence. Sixteen echoes (nE) were collected over the 1 mm sample slice and the echo attenuation of each image pixel fit to to determine the T2 and form the T2 map with an echo time (TE) of 11 ms, the longest echo time being nE·TE = 176 ms. The repetition time (TR) of the sequence was 1 s and two averages were collected resulting in a total image acquisition time of 4 minutes. The image had a field of view (FOV) of 20 mm in the axial frequency encode direction and 13 mm in the phase encode direction. The spatial resolution of the image was 78 μm × 102 μm over a 256 × 128 pixel domain.
1D spatially resolved T2 relaxation weighted axial profiles of the sample were acquired. The 1D spatially resolved experiment was exactly the same as the 2D image with the exception of the elimination of the phase encoding which reduced total experiment time in order to monitor rapid changes during gelation. The profiles represent an integration over the radial phase encoded direction of the sample. The 1D spatial profiles with a TR of 1 s were repeated four times during the 15 minute cycle to determine variation during the 15 minute experimental suite. The 1D profiles were each acquired in 2 s.
The three 2D correlation experiments used in this study, diffusion - relaxation D-T2, spin-spin relaxation correlation/exchange T2-T2, and spin-lattice – spin-spin relaxation correlation T1–T2, utilize the direct measurement of T2 using a CPMG pulse train with 4096 echoes at a spacing of 2τ = 400 μs. The indirect dimension for each type of experiment is encoded using either a pulsed gradient stimulated echo sequence (D-T2), a 180° rf inversion pulse (T1–T2), or a series of CPMG pulses (T2-T2). The pulse sequences are shown in Figure 3. The parameters for the D-T2 experiments were: δ = 1 ms, Δ= 50 ms, 26 magnetic field gradient points between g = 0 and 1.482 T/m and 32 step phase cycle with a total acquisition time of 3.5 hours. For the T1–T2 experiments, the inversion recovery time was varied between 0.001 and 3.6 seconds in 32 logarithmically spaced steps with a 16 step phase cycle and a total acquisition time of 2 hours. The T2-T2 experiments used the same 2τ time in the indirect dimension as the direct dimension (400 μs) and the number of pulses was varied logarithmically from 2 to 4096 in 32 steps with a 16 step phase cycle and a total acquisition time of 2 hours. The 2D correlation data were analyzed using a 2D inverse Laplace transform algorithm (Godefroy and Callaghan, 2003; Venkataramanan et al., 2002).
3. Results and Discussion
3.1 Gelation front
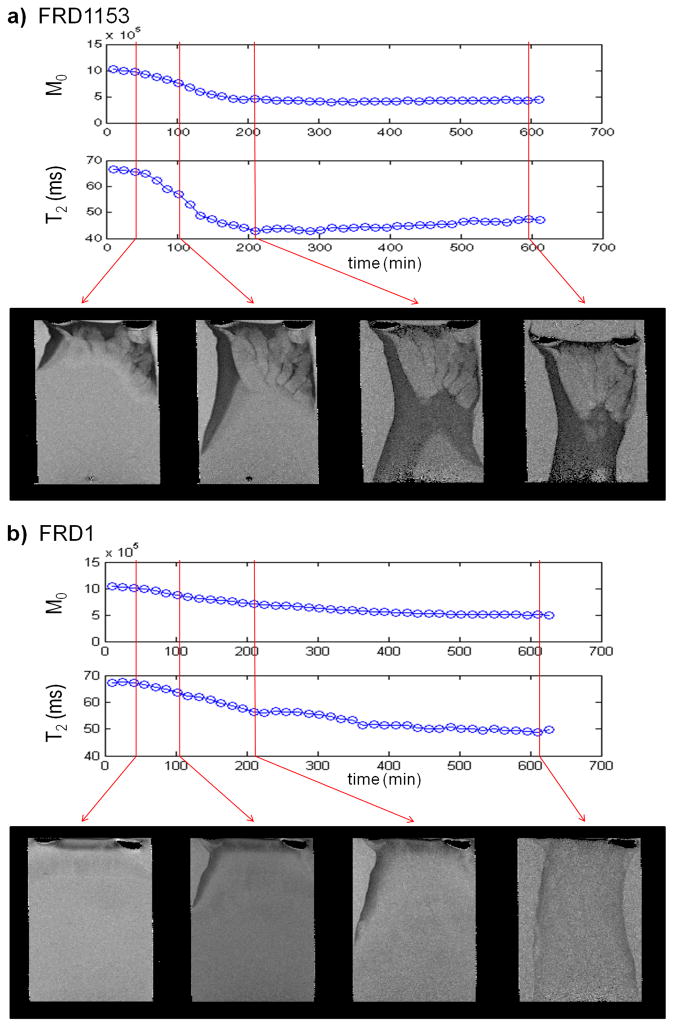
MR measurements were performed as the gels were forming. The signal and T2 relaxation as a function of gelation time is shown in Figure 4. As time progresses and calcium diffuses into the sample, a drop is seen in both the T2 and signal amplitude (M0) due to gelation. This is due to the change from the alginate solution to a gel as the calcium diffuses into the sample. As can be seen from the relaxation contrast in the MR relaxation images in Figures 2 and 4, the gel produced by the FRD1153 bacterial alginate is more heterogeneous than that produced by the FRD1 bacterial alginate. Figure 2 shows the bacterial alginate gels contract during gelation. The algal gel adheres to the alginate coated tube wall, while the bacterial gels do not. This indicates larger molecular stresses are generated in the bacterial gels during gelation. Restriction of rotational mobility causes more rapid T2 relaxation, so pixels of less signal indicate regions with a tighter gel network. For the FRD1153 solution, T2 and M0 decrease more rapidly (Figure 4) indicating that the gelation front motion is faster. Faster gelation is related to increased heterogeneity.
Figure 4.
Magnetization amplitude (M0), spin-spin relaxation (T2) and images with increasing time during gelation for (a) FRD1153 and (b) FRD1 alginates showing a difference in rate of gelation as well as heterogeneity. The 2D MR images have a resolution of 78 × 102 μm2 over a 1mm thick slice fixed in the middle of the column. The M0 and T2 values are obtained from a 0.5 mm thick slice perpendicular to the gelation direction and fixed approximately 10 mm below the top of the gel. The FRD1153 gel shows more heterogeneity in the images. The faster decay in both the M0 and T2 indicate the gel formed by the FRD1153 also forms more quickly than the FRD1.
3.2 2D correlations
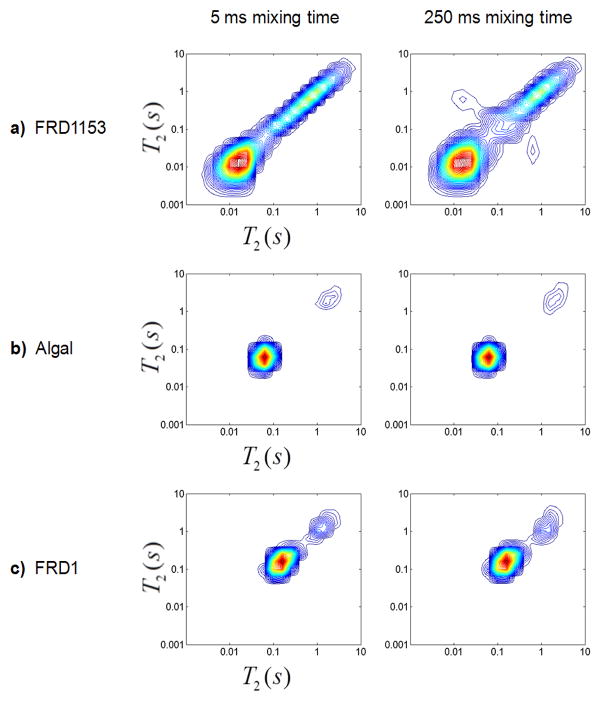
After gel formation was complete, T2-T2 relaxation measurements were conducted. Mixing times (τm) of 5 ms and 250 ms, sequence in Figure 3a, were obtained for the three alginate solutions before gelation, after gelation, after draining of the bulk water, and after aging for 10 days. Results for the three alginate gels after aging for 10 days are shown in Figure 5. Note that since the bacterial alginate gels contracted more than the algal gel, they are of higher polymer weight percent. Off-diagonal peaks in T2-T2 spectra are an indication of exchange of protons between different T2 environments. Chemical exchange of protons between water and biopolymer occur on timescales shorter than 5 ms and so are not present (Hills et al., 1989). For the more homogeneous algal and FRD1 alginates, no off-diagonal peaks were observed for any of the mixing times. However the heterogeneous FRD1153 gel exhibited off-diagonal peaks that increased in intensity as the mixing time was increased, indicating exchange between the mesoscale gel domains exhibited in the images in Figure 2. The data clearly demonstrate the quantitative differentiation of gel heterogeneity by T2-T2 measurements.
Figure 5.
T2-T2 correlations for mixing times of 5 ms (left column) and 250 ms (right column) for a) FRD1153, b) algal, and c) FRD1 gels after draining of bulk water and aging for 10 days. The plots are shown with 50 contour lines from 0 to the maximum intensity. 2D T2-T2 experiments were integrated in the vertical direction to obtain the 1D T2 profiles shown in Figure 7 and 8.
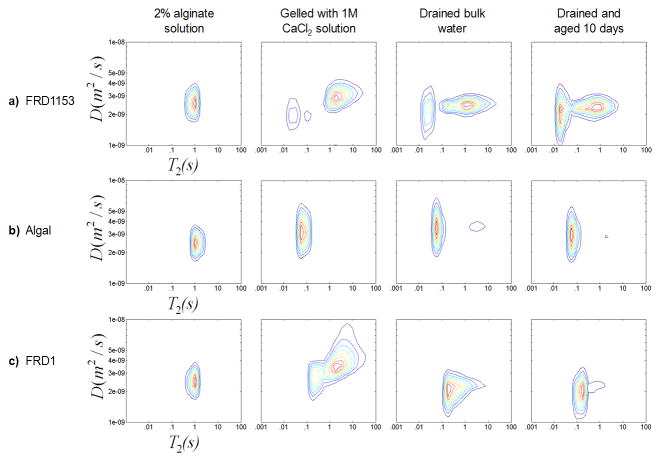
Results of D-T2 experiments for all three gels are shown in Figure 6 and further indicate the detail 2D correlations provide for monitoring gelation. All three solutions have similar T2 and diffusion coefficient distributions prior to gelation. After gelation the distributions are unique for each alginate source. The distribution of T2 values for each type of gel is consistent with the 2D and 1D T2 results. In the diffusion direction, the results show that for each of the three gels, the protons on the water with the shortest T2 values also have the smallest diffusion coefficients. This indicates a coupling between restricted rotational and translational mobility of protons interacting with the more polymer dense or rigid parts of the gel, thus exhibiting restricted diffusion and faster relaxation. A common feature in the D-T2 data of all three alginates is the broadening of the distribution of effective diffusion coefficients in the transition from the sol to the gel phase. As in the T2-T2 data, the heterogeneous FRD1153 gel has distinct features indicating the multiple water domains not present in the more homogeneous FRD1 and algal gel.
Figure 6.
D-T2 correlations for the three alginate biopolymers a) FRD1153, b) algal and c) FRD1 in solution, post gelation, drained of bulk water after gelation and gel aged for 10 days (columns left to right). The algal alginate gel was initially homogeneous but detached from the wall after the bulk water above the gel was drained resulting in slight dewatering as seen by the T2 population at 2 s. Experimental details are discussed in the text.
T1–T2 correlation experiments were conducted. The 2D plots are not shown due to the fact that all experiments exhibited a single peak in the T1 direction. All three gels have approximately the same T1 = 2.3 s over the same range of T2 values shown in all the 2D correlation data. The FRD1153 with the shorter T2, has a larger ratio between T1 and T2 than the algal gel, another indication of a more dense or rigid gel structure.
3.3 1D relaxation distributions
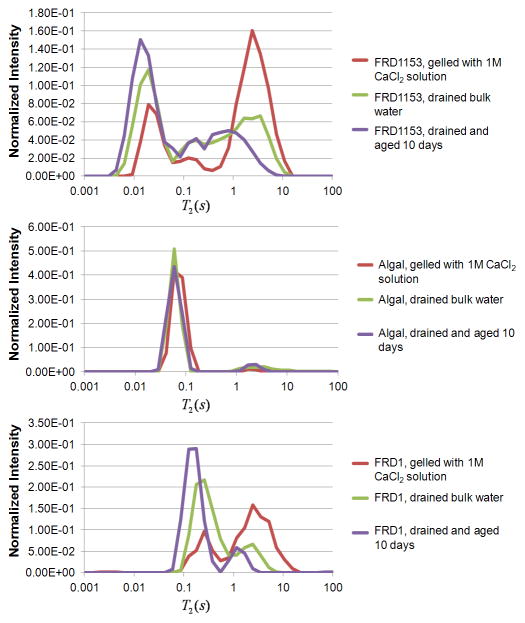
The 2D T2-T2 spectra shown in Figure 5 for τm = 250 ms were integrated over the indirect dimension to obtain 1D T2 relaxation distributions. The results for all three gels are shown in Figure 7. The two non-acetylated alginate gels, FRD1153 and algal, have shorter T2 populations than the acetylated alginate FRD1. This is in spite of the fact that due to contraction the FRD1 gel is at slightly higher polymer concentration than the algal gel. Shorter T2 spin-spin relaxation indicates stronger dipolar coupling between 1H protons due to more restricted rotational mobility. The 1H signal is dominated by the 98 wt% water signal and so polymer protons are not directly observed. However, the water relaxation in a gel is reduced from the free bulk water value due to exchange of water protons and biopolymer exchangeable protons and restricted mobility of water interacting with the gel matrix (Hills et al., 1989) an indirect detection of the polymer gel network structure. The non-O-acetylated FRD1153 and algal gels have lower T2 indicating stronger interaction with the solvent water through biopolymer network rigidity and enhanced proton exchange. The increased heterogeneity of the FRD1153 gel, as shown in the MR images in Figure 2, is apparent in the broader distribution of T2 populations in comparison with the much narrower range of populations in the FRD1 gel. The homogenous algal alginate gel has the narrowest distribution of T2 populations. As T2 distributions can be acquired in 10 minutes, MR T2 relaxation measurements are viable as real time monitors for gelation processes on-line. With aging over ten days the algal gel T2 distribution stays constant. In contrast, the two bacterial alginate gels show shifts to shorter T2 values after draining of the bulk water and further shifts after aging. The FRD1153 and FRD1 have a larger peak at approximately T2 ~ 3 s due to the presence of bulk water after the contraction of the gel phase during the reaction as shown in the images of Figure 4. Draining this water alters the proportion of proton spins in the 1 s peak and the ~100 ms peak for the FRD1 and the ~10 ms peak for FRD1153 as expected. The reduced proportion of proton spins in the bulk water allow for a better comparison between the two bacterial alginates and the algal alginate. The FRD1 and algal gels have a bimodal distribution indicating two populations of proton relaxation in contrast to the FRD1153 which has a broader distribution due to multiple relaxation domains in the more heterogeneous gel. An interesting feature of the aging in the bacterial alginate gels is the shift to shorter relaxation time of both the short and long components of the distributions. This indicates that while the algal alginate gel is stable over time, the bacterial alginate gels are contracting or more highly associating water and biopolymer over time.
Figure 7.
1D T2 profiles for the three alginate gels immediately after gelation with CaCl2, after draining excess water, and after aging for 10 days.
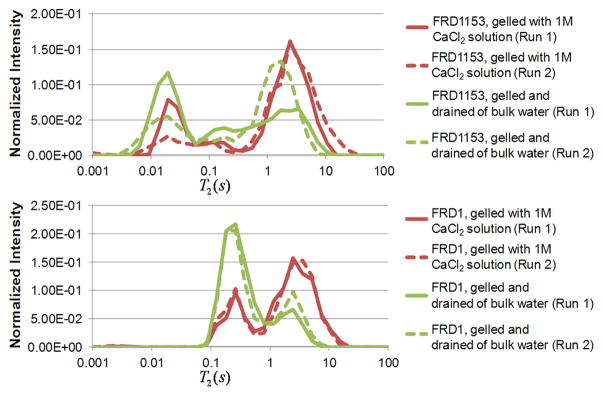
The entire set of experiments was repeated twice for each type of gel, and the results obtained were reproducible. T2 distributions for the two trials of the bacterial alginate gels are shown in Figure 8. The heterogeneity of the FRD1153 gels causes some variation in the distributions, however, the range of T2 values for each gel was similar for each repetition. The two trials of the more homogeneous FRD1 gels showed even more similar T2 distributions indicating the ability to quantifiably monitor the degree of homogeneity or heterogeneity during gelation.
Figure 8.
1D T2 profiles showing two trials of measurements for FRD1153 and FRD1 bacterial alginate gels, demonstrating the repeatability of the reaction front experimental process.
4. Conclusions
Alginates are broadly used in food and biomedical applications in biotechnology. This work presents direct, non-invasive comparison of gels generated by a diffusion-reaction front for alginates from brown algae and Pseudomonas aeruginosa microbes. The ability of magnetic relaxation and diffusion correlation experiments to quantify the differences in gelation behavior of the different precursor alginate biopolymers is demonstrated. The MR data show that the non-acetylated algal and FRD1153 have shorter T2 relaxation times due to stronger molecular interaction between water and biopolymer than the acetylated FRD1. MR data also readily differentiates the formation of mesoscale heterogeneous structures in the FRD1153 from the more homogeneous algal and FRD1 alginate gels. Further characterization of gels from microbial alginate sources provides the potential to develop genetically tailored alginate biopolymers for particular gel biotechnology applications.
Magnetic Resonance techniques are used to quantify differences in the physical gelation of alginate from microbes and algae.
Differences in water diffusion, T1, and T2 magnetic relaxation times are monitored as the gel forms and ages.
O-deacetylated alginate from Pseudomonas aeruginosa FRD1153 forms the most rigid and heterogeneous gel.
Bacterial alginates form a more rigid and heterogeneous gel than algal alginate.
Bacterial alginates contract and expel water more than algal alginate indicating larger molecular stress during gelation.
Acknowledgments
The authors would like to thank Professor Sir Paul Callaghan for the inverse Laplace transform software. HTF and MLS acknowledge INBRE Grant Number P20RR016455 from the National Center for Research Resources (NCRR), a component of the National Institutes of Health (NIH). Its contents are solely the responsibility of the authors and do not necessarily represent the official view of NCRR or NIH. JDS, SJV, and SLC acknowledge support from U.S. DOE grant DE-FG02-08ER46527. MR equipment funded by the NSF MRI program and the M.J. Murdock Charitable Trust. The authors thank Betsey Pitts and Kerry Williamson for assistance with the microbial growth.
Footnotes
Publisher's Disclaimer: This is a PDF file of an unedited manuscript that has been accepted for publication. As a service to our customers we are providing this early version of the manuscript. The manuscript will undergo copyediting, typesetting, and review of the resulting proof before it is published in its final citable form. Please note that during the production process errors may be discovered which could affect the content, and all legal disclaimers that apply to the journal pertain.
References
- Cabodi M, Choi NW, Gleghorn JP, Lee CSD, Bonassar LJ, Stroock AD. A microfluidic biomaterial. J Am Chem Soc. 2005;127:13788–13789. doi: 10.1021/ja054820t. [DOI] [PubMed] [Google Scholar]
- Carr HY, Purcell EM. Effects of Diffusion on Free Precession in Nuclear Magnetic Resonance Experiments. Physical Review. 1954;94:630–638. [Google Scholar]
- Carver JP, Richards RE. General 2-Site Solution for Chemical Exchange Produced Dependence of T2 upon Carr-Purcell Pulse Separation. J Magn Reson. 1972;6:89–105. [Google Scholar]
- Degrassi A, Toffanin R, Paoletti S, Hall LD. A better understanding of the properties of alginate solutions and gels by quantitative magnetic resonance imaging (MRI) Carbohydr Res. 1998;306:19–26. [Google Scholar]
- Donati I, Holtan S, Morch YA, Borgogna M, Dentini M, Skjak-Braek G. New hypothesis on the role of alternating sequences in calcium-alginate gels. Biomacromolecules. 2005;6:1031–1040. doi: 10.1021/bm049306e. [DOI] [PubMed] [Google Scholar]
- Franklin MJ, Nivens DE, Weadge JT, Howell PL. Biosynthesis of the Pseudomonas aeruginosa extracellular polysaccarides, alginate, Pel, and Psl. Frontiers in Microbiology. 2011;2:167, 1–16. doi: 10.3389/fmicb.2011.00167. [DOI] [PMC free article] [PubMed] [Google Scholar]
- Franklin MJ, Ohman DE. Identification of Algf in the Alginate Biosynthetic Gene-Cluster of Pseudomonas aeruginosa Which Is Required for Alginate Acetylation. J Bacteriol. 1993;175:5057–5065. doi: 10.1128/jb.175.16.5057-5065.1993. [DOI] [PMC free article] [PubMed] [Google Scholar]
- Godefroy S, Callaghan PT. 2D relaxation/diffusion correlations in porous media. Magn Reson Imaging. 2003;21:381–383. doi: 10.1016/s0730-725x(03)00144-9. [DOI] [PubMed] [Google Scholar]
- Grant GT, Morris ER, Rees DA, Smith PJC, Thom D. Biological Interactions between Polysaccharides and Divalent Cations - Egg-Box Model. FEBS Lett. 1973;32:195–198. [Google Scholar]
- Hills BP, Wright KM, Belton PS. Proton NMR - Studies of Chemical and Diffusive Exchange in Carbohydrate Systems. Mol Phys. 1989;67:1309–1326. [Google Scholar]
- Hornemann JA, Lysova AA, Codd SL, Seymour JD, Busse SC, Stewart PS, Brown JR. Biopolymer and water dynamics in microbial biofilm extracellular polymeric substance. Biomacromolecules. 2008;9:2322–2328. doi: 10.1021/bm800269h. [DOI] [PMC free article] [PubMed] [Google Scholar]
- Iuliano C, Piggott RB, Venturi L, Hills BP. A Two-Dimensional Relaxation Study of the Evolving Microstructure in a Mixed Biopolymer Gel. Appl Magn Reson. 2010;38:307–320. [Google Scholar]
- Langer RS, Vacanti JP. Tissue engineering: The challenges ahead. Sci Am. 1999;280:86–89. doi: 10.1038/scientificamerican0499-86. [DOI] [PubMed] [Google Scholar]
- Lyczak JB, Cannon CL, Pier GB. Establishment of Pseudomonas aeruginosa infection: lessons from a versatile opportunist. Microbes Infect. 2000;2:1051–1060. doi: 10.1016/s1286-4579(00)01259-4. [DOI] [PubMed] [Google Scholar]
- Maneval JE, Bernin D, Fabich HT, Seymour JD, Codd SL. Magnetic resonance analysis of capillary formation reaction front dynamics in alginate gels. Magn Reson Chem. 2011;49:627–640. doi: 10.1002/mrc.2788. [DOI] [PubMed] [Google Scholar]
- Mitchell J, Griffith JD, Collins JHP, Sederman AJ, Gladden LF, Johns ML. Validation of NMR relaxation exchange time measurements in porous media. J Chem Phys. 2007;127:234701-1–9. doi: 10.1063/1.2806178. [DOI] [PubMed] [Google Scholar]
- Monteilhet L, Korb JP, Mitchell J, McDonald PJ. Observation of exchange of micropore water in cement pastes by two-dimensional T2-T2 nuclear magnetic resonance relaxometry. Phys Rev E. 2006;74:061404-1–9. doi: 10.1103/PhysRevE.74.061404. [DOI] [PubMed] [Google Scholar]
- Pier GB, Coleman F, Grout M, Franklin M, Ohman DE. Role of alginate O acetylation in resistance of mucoid Pseudomonas aeruginosa to opsonic phagocytosis. Infect Immun. 2001;69:1895–1901. doi: 10.1128/IAI.69.3.1895-1901.2001. [DOI] [PMC free article] [PubMed] [Google Scholar]
- Qiao Y, Galvosas P, Adalsteinsson T, Schonhoff M, Callaghan PT. Diffusion exchange NMR spectroscopic study of dextran exchange through polyelectrolyte multilayer capsules. J Chem Phys. 2005;122:214912-1–9. doi: 10.1063/1.1924707. [DOI] [PubMed] [Google Scholar]
- Schurks N, Wingender J, Flemming HC, Mayer C. Monomer composition and sequence of alginates from Pseudomonas aeruginosa. Int J Biol Macromol. 2002;30:105–111. doi: 10.1016/s0141-8130(02)00002-8. [DOI] [PubMed] [Google Scholar]
- Shapiro YE. Structure and dynamics of hydrogels and organogels: An NMR spectroscopy approach. Prog Polym Sci. 2011;36:1184–1253. [Google Scholar]
- Skjakbraek G, Zanetti F, Paoletti S. Effect of Acetylation on Some Solution and Gelling Properties of Alginates. Carbohydr Res. 1989;185:131–138. [Google Scholar]
- Song YQ. A 2D NMR method to characterize granular structure of dairy products. Prog Nucl Magn Reson Spectrosc. 2009;55:324–334. [Google Scholar]
- Storz H, Muller KJ, Ehrhart F, Gomez I, Shirley SG, Gessner P, Zimmermann G, Weyand E, Sukhorukov VL, Forst T, Weber MM, Zimmermann H, Kulicke WM, Zimmermann U. Physicochemical features of ultra-high viscosity alginates. Carbohydr Res. 2009;344:985–995. doi: 10.1016/j.carres.2009.02.016. [DOI] [PubMed] [Google Scholar]
- Turco GTG, Donati I, Grassi M, Marchioli G, Lapasin R, Paoletti S. Mechanical Spectroscopy and Relaxometry on Alginate Hydrogels: A Comparative Analysis for Structural Characterization and Network Mesh Size Determination. Biomacromolecules. 2011;12:1272–1282. doi: 10.1021/bm101556m. [DOI] [PubMed] [Google Scholar]
- Venkataramanan L, Song YQ, Hurlimann MD. Solving Fredholm Integrals of the First Kind With Tensor Product Structure in 2 and 2.5 Dimensions. IEEE Transactions on Signal Processing. 2002;50:1017–1026. [Google Scholar]
- Venturi L, Woodward N, Hibberd D, Marigheto N, Gravelle A, Ferrante G, Hills BP. Multidimensional cross-correlation relaxometry of aqueous protein systems. Appl Magn Reson. 2008;33:213–234. [Google Scholar]
- Vogt M, Flemming HC, Veeman WS. Diffusion in Pseudomonas aeruginosa biofilms: a pulsed field gradient NMR study. Journal of Biotechnology. 2000;77:137–146. doi: 10.1016/s0168-1656(99)00213-8. [DOI] [PubMed] [Google Scholar]
- Walderhaug H, Soderman O, Topgaard D. Self-diffusion in polymer systems studied by magnetic field-gradient spin-echo NMR methods. Prog Nucl Magn Reson Spectrosc. 2010;56:406–425. doi: 10.1016/j.pnmrs.2010.04.002. [DOI] [PubMed] [Google Scholar]
- Washburn KE, Callaghan PT. Tracking Pore to Pore Exchange Using Relaxation Exchange Spectroscopy. Physical Review Letters. 2006;97:175502-1–4. doi: 10.1103/PhysRevLett.97.175502. [DOI] [PubMed] [Google Scholar]
- Windhues T, Borchard W. Effect of acetylation on physico-chemical properties of bacterial and algal alginates in physiological sodium chloride solutions investigated with light scattering techniques. Carbohydr Polym. 2003;52:47–52. [Google Scholar]


