

Abstract
A shift from home-prepared to away-from-home and ready-to-eat foods has occurred in recent decades, which has implications for obesity and health. This study tested whether delay discounting, a facet of impulsivity reflecting sensitivity to immediate reward, is associated with the frequency of consumption and typical amount consumed of home-prepared, away-from-home, and ready-to-eat foods among overweight and obese women. Seventy-eight participants completed a binary choice task assessing discounting of delayed monetary rewards. Nutrient analysis of weighed food records characterized dietary intake over seven consecutive days. Foods were categorized as home-prepared, away-from-home, or ready-to-eat by a registered dietitian from information provided by participants. Delay discounting was not associated with the frequency of consuming home-prepared, away-from-home, and ready-to-eat foods as reflected in the percentages of recorded foods or total energy intake from each category. However, once consuming away-from-home and ready-to-eat foods (but not home-prepared foods), impulsive women consumed more energy than less impulsive women. Exploratory analyses indicated that more impulsive women chose away-from-home foods with a higher energy density (kcal/g). Impulsivity was associated with the quantity of away-from-home and ready-to-eat foods consumed, but not the frequency of their consumption. Home food preparation may be critical to weight control for impulsive individuals.
Keywords: Delay discounting, Impulsivity, Reward, Fast food, Convenience, Obesity, Energy density
Introduction
The past three decades have witnessed a concomitant increase in the prevalence of overweight and obesity (Flegal, Carroll, Kuczmarski, & Johnson, 1998; Flegal, Carroll, Ogden, & Curtin, 2010), and a shift away from home-prepared foods in the American diet (Nielsen, Siega-Riz, & Popkin, 2002; Poti & Popkin, 2011). Time spent preparing and cleaning up food by American women has decreased from 92 minutes per day in 1975 to 51 minutes per day in 2006, without a compensatory increase in time spent in these activities by men (Zick & Stevens, 2010). Approximately 41% of the typical U.S. household food budget is now allocated to food obtained away-from-home, which represents a substantial increase from 25% in 1970 (U.S. Department of Labor, 2011; U.S. Department of Agriculture, 2011). The percentage of daily energy obtained from home-prepared foods has decreased from 77% in the late 1970’s to about 65% in the mid-1990’s, whereas the percentage of energy from restaurants and fast food more than doubled from 5% to 14% during this same period (Nielsen et al., 2002). Ninety-five percent of today’s young adults eat at a fast food or full-service restaurant at least once per week (Larson, Neumark-Sztainer, Laska, & Story, 2011). About 40% of individuals consume at least three away-from-home meals each week, and roughly 40% consume four or fewer meals at home each week (Chan & Sobal, 2011).
This dramatic shift away from home-prepared foods has important implications for diet quality, obesity, and chronic disease risk. Greater consumption of away-from-home foods, particularly fast food, is linked to poorer overall diet quality, higher intake of total and saturated fat, and lower intake of fiber (Beydoun, Powell, & Wang, 2008; Larson et al. 2011). More frequent away-from-home food intake has also been linked to higher adiposity and overweight status (Bowman & Vinyard, 2004; Chan & Sobal, 2011; Larson et al., 2011) and weight gain (Duffey, Gordon-Larsen, Jacobs, Williams, & Popkin, 2007). In contrast, more frequent meal planning and cooking are associated with successful weight loss (Kruger, Blanck, & Gillespie, 2006). Consumption of ready-to-eat snack foods has been linked to increases in waist circumference among adults (Halkjaer, Tjonneland, Overvad, & Sorensen, 2009), but few studies have examined the characteristics and consumption patterns of ready-to-eat foods, including ready-to-eat meal items, more generally.
Identifying the behavioral processes that influence consumption of home-prepared, ready-to-eat, and away-from-home foods is critical to understanding vulnerability to weight gain in the modern food environment, and to improving dietary interventions to reduce obesity and chronic disease risk. In addition to demographic factors, prior research has identified “convenience orientation” and “dislike of cooking” as key drivers of fast food intake (Anderson, Rafferty, Lyon-Callo, Fussman, & Imes, 2011; Dave, An, Jeffery, & Ahluwalia, 2009). These consumer preferences likely reflect more general behavioral traits that influence other aspects of food choice and eating behavior, but little research on this topic has been conducted.
Delay discounting is a relatively stable behavioral trait (Odum, 2011) that has been implicated in overeating and obesity (Appelhans, 2009; Epstein, Salvy, Carr, Dearing, & Bickel, 2010), and may drive greater consumption of ready-to-eat and away-from-home foods. Delay discounting refers to the phenomenon that immediate rewards have a stronger influence on decision-making and behavior than delayed rewards. In other words, immediate rewards are often preferred over delayed rewards, even in cases where the delayed reward is more valuable. This tendency to discount the value of delayed rewards can result in impulsive, short-sighted decisions that are not in one’s best long-term interests (Ainslie, 2001).
Neuroimaging and behavioral studies suggest that delay discounting reflects an interaction between two neurobehavioral systems: an appetitive system that pursues immediate gratification, and an inhibitory system that seeks to maximize long-term gain (Bickel et al., 2007; Bickel & Yi, 2008). The appetitive system largely consists of the mesolimbic dopamine pathway (Hariri et al., 2006; Tanaka et al., 2004), a neural circuit that mediates the hedonic motivation to engage in a number of appetitive behaviors including sex, social interaction, eating, gambling, and illicit drug use (Alcaro, Huber, & Panksepp, 2007; Reuter et al., 2005). Numerous studies conducted during the past decade suggest that mesolimbic dopamine system function is the primary substrate of the motivation to overconsume palatable food in the absence of physiological hunger, and is a major contributor to individual differences in eating behavior and obesity risk (Berridge, Ho, Richard, & Difeliceantonio, 2010; Fulton, 2010; Zheng, Lenard, Shin, & Berthoud, 2009). The inhibitory system that promotes consideration of larger delayed rewards in the context of delay discounting tasks includes regions of the prefrontal cortex (Hariri et al., 2006; Hoffman et al., 2008; McClure, Laibson, Loewenstein, & Cohen, 2004; McClure, Ericson, Laibson, Loewenstein, & Cohen, 2007; Tanaka et al., 2004) involved in executive functions such as planning, self-monitoring, behavioral inhibition, and affect regulation (Mesulam, 2002; Miller & Cohen, 2001). There is accumulating evidence that these same prefrontal cortical regions play a central role in the inhibition of the motivation to consume palatable food (Appelhans, 2009; Hare, Camerer, & Rangel, 2009; Hollmann et al., 2011), and may be important for successful long-term weight control (DelParigi et al., 2007; Le et al., 2006; Le et al., 2007). As delay discounting reflects the antagonism between the brain’s appetitive and inhibitory systems, it would be expected to serve as a marker for individual differences in eating behavior. Consistent with this idea, more impulsive responding on delay discounting tasks is associated with obesity status (Davis, Patte, Curtis, & Reid, 2010; Weller, Cook III, Avsar, & Cox, 2008), and predicts greater palatable food intake among those most sensitive to the rewarding properties of food (Appelhans et al., 2011; Rollins, Dearing, & Epstein, 2010).
Delay discounting may promote greater consumption of ready-to-eat and away-from-home foods in two possible ways. First, as away-from-home and ready-to-eat foods can provide reward without the time and effort associated with food preparation, individuals who demonstrate greater preference for immediate reward on delay discounting tasks may consume away-from-home and ready-to-eat foods more frequently, and home-prepared foods less frequently. This association would be reflected in both the percentage of eating occasions and percentage of total energy from away-from-home and ready-to-eat foods. Second, as greater delay discounting reflects impulsivity and weaker inhibitory control of reward-driven eating behavior, delay discounting may be associated with the selection of more energy-dense away-from-home and ready-to-eat foods, or consumption of larger portions of away-from-home and ready-to-eat foods during individual eating occasions. By extension, individuals who demonstrate greater delay discounting would be expected to consume more calories when consuming away-from-home and ready-to-eat foods than those who discount delayed rewards less steeply.
This study explored the relations between delay discounting and consumption of home-prepared, away-from-home, and ready-to-eat foods over a seven-day period among overweight and obese women. It was hypothesized that more impulsive responding on the delay discounting task would be associated with higher percentages of eating occasions and total calories from away-from-home and ready-to-eat foods, and greater energy intake when consuming away-from-home and ready-to-eat foods, but not home-prepared foods.
Methods
Participants
Overweight and obese women were recruited for a study of “dieting and decision making” through flyers posted at medical center campuses and electronic advertisements on community posting forums. The study focused on women because the prior research which led to the formulation of our hypotheses was almost exclusively conducted with female samples. If hypotheses were supported among overweight and obese women, attempts to replicate the findings in men and normal weight individuals would be justified. Inclusion criteria included female sex, age 18–45 years, and body mass index (BMI) of 25.0–39.9 kg/m2. Exclusion criteria included peri- or postmenopausal status; pregnancy or lactation in the past six months; adherence to any structured weight control diet within the past 30 days; allergies or sensitivities to common foods; history of obesity surgery; clinically significant symptoms of depression, anxiety, or mania in the past 30 days; symptoms of eating pathology (e.g., underweight, binge eating, purging behavior) at any time in the past 5 years; and medical conditions or medications affecting appetite, metabolism, digestion, or cognitive functioning. Eligibility was initially assessed during a telephone screening interview. Participants were compensated $50 (US) for their time. The Institutional Review Boards of Rush University Medical Center, University of Arizona, and Arizona State University approved study procedures.
Three women were excluded from participation upon arriving to the laboratory because their objectively measured height and weight placed them outside of the eligible BMI range. Ninety-four women with a BMI in the eligible range enrolled in the study. Four women did not return for the second study visit, and seven did not provide properly completed food records at the second visit. One participant’s food records were deemed incomplete based on implausibly low reported intake (2–4 food items per day). Delay discounting and nutrition data were lost or corrupted for four participants. Therefore, analyses included data from 78 overweight and obese women.
Procedures
The study involved two laboratory visits spaced 7–9 days apart, and seven consecutive days of diet recording between visits. Informed consent was obtained upon arrival at the first laboratory visit, and height and weight were measured in light clothing to verify eligibility. Participants then completed the self-report measures and the delay discounting task described below. Other study procedures conducted in this sample have been described elsewhere (see Appelhans et al., 2011). Additionally, a number of questionnaires that were not analyzed for this report were administered, including the International Physical Activity Questionnaire (Craig, et al., 2003), the Perceived Stress Scale (Cohen, Kamarck, & Mermelstein, 1983), the Beck Depression Inventory (Beck, 1996), the State-Trait Anxiety Inventory (Spielberger, 1983), the Barratt Impulsiveness Scale (Patton, Stanford, & Barratt, 1995), the Three Factor Eating Questionnaire (Stunkard & Messick, 1985), the Dutch Eating Behavior Questionnaire (Van Strien, Frijters, Bergers, & Defares, 1986), and the Power of Food Scale (Lowe, et al., 2009).
As this study was designed to examine behavioral correlates of dietary intake, we familiarized participants with current dietary guidelines for healthy eating in order to minimize variability in dietary intake associated with poor nutrition knowledge. Recommended daily intakes for energy, saturated fat, fruit, and vegetables from the 2005 Dietary Guidelines for Americans (U.S. Department of Health and Human Services & U.S. Department of Agriculture, 2005) were presented by a trained research assistant using a script and materials developed by a registered dietitian. Participants’ current energy requirements were estimated from their age, height, weight, and overall activity level using a predictive equation developed by the Institute of Medicine (Gerrior, Juan, & Basiotis, 2006). Participants, who were all overweight or obese, were advised to meet a daily energy intake goal consistent with gradual weight loss (500 kcal/d energy deficit), as well as specific goals for saturated fat, fruit, and vegetable intake specified in the guidelines. Participants were also provided with a handout listing common sources of saturated fat, and strategies to reduce energy intake and increase fruit and vegetable intake. The presentation of dietary guidelines occurred during the first laboratory visit and typically lasted 10 to 15 minutes.
Participants were also trained to complete weighed food records, which is widely considered the most accurate method for quantifying actual dietary intake (Surrao, Sawaya, Dallal, Tsay, & Roberts, 1998; Thompson & Subar, 2008). Participants were provided with a portable, digital food scale (model # P115, Escali, Minneapolis, MN) and food record forms containing spaces for the day and time of consumption, food description, brand or source, method of preparation, amount consumed (in grams), and palatability ratings on a scale from 0 (“not tasty”) to 100 (“extremely tasty”). During the visit, participants rehearsed completing weighed food records for several meals and snacks using plastic food models. Participants were instructed to complete weighed food records contemporaneously with all food intake during the next seven days. A research assistant contacted participants by telephone twice during this period to encourage and assist participants with food record completion.
Participants returned to the laboratory for the second visit after completing seven full consecutive days of dietary recording. Food records were reviewed for completeness, and any items that needed clarification or additional detail were addressed. Participants completed several additional self-report measures before being debriefed and compensated for their time.
Measures
Anthropometrics
BMI (kg/m2) was calculated from height and weight measured using a balance beam scale with height rod.
Demographics
Participant’s age, race/ethnicity, education level, annual household income, and marital status were assessed using a survey developed by the researchers.
Delay Discounting
Delay discounting for monetary rewards was measured using a computerized choice task adapted from other sources (Hariri et al., 2006). In a series of 161 choice trials, participants indicated whether they preferred to receive a hypothetical delayed reward of $100.00 at one of seven different delay intervals (1 day, 7 days, 30 days, 90 days, 180 days, 1 years, or 5 years), or a different monetary reward “right now.” At each delay interval, twenty-three immediate monetary rewards were offered: $0.10, $2.50, $5.00, and $10.00 to $105.00 in $5.00 increments. Choice trials were administered in a randomized order with respect to both delay interval and the value of immediate reward offered.
For each participant, the “switch points” at which immediate rewards became preferred over the delayed reward were calculated at each delay interval. For example, a participant who chose to receive $60 or more right now rather than $100 after a 90-day delay, but preferred the delayed reward of $100 to receiving $55 or less right now, would have a switch point of $57.50 at the 90-day delay interval. Across all subjects, 56% of switch points were discrete in that participants always chose the delayed reward of $100 below a certain threshold value of immediate reward, and never chose the delayed reward of $100 when the immediate reward exceeded that same threshold. Similar to prior studies (Mitchell, 1999), the remaining 44% of switch points were not discrete, with preference for the delayed reward alternating across several values of immediate reward. In these instances, the switch points were defined as the choice of a delayed reward over the two highest consecutive values of immediate reward, not necessarily by the lowest value immediate reward chosen (Mitchell, 1999). Participant’s switch points were plotted at each delay interval, and the area under the delay discounting curve (AUCDD) was calculated using curve-fitting software (Prism 5, Graphpad Software, Inc., LaJolla, CA, USA). AUCDD is an atheoretical and normally-distributed metric (Myerson, Green, & Warusawitharana, 2001) that ranges from 0 (greatest possible discounting) to 1 (no discounting). Lower AUCDD indicates higher impulsivity.
Processing of Dietary Intake Data
Weighed food record data were entered into Food Processor SQL version 10.5.0 (Esha Research, Salem, OR), a flexible dietary analysis program that calculates 160 nutrition measures from a database of over 35,000 food items. All records were entered by a research assistant, and subsequently reviewed for accuracy by a registered dietitian. Foods consumed at the same time of day were considered to have been consumed during the same eating occasion. Nutrient data were aggregated at the level of the individual food item, rather than at the level of individual ingredients or eating occasions. For example, the nutrient data obtained for bread, deli meat, lettuce, and mayonnaise would be summed in order to determine the nutrient content of the sandwich which they composed. This approach was taken so that nutrient data could be linked to both palatability ratings and the food preparation category, both of which apply to food items in the aggregated forms in which they are consumed. Beverages were not included in any analyses because they cannot be meaningfully classified into food preparation categories.
Foods were coded into three food preparation categories (home-prepared, ready-to-eat, and away-from-home) by a registered dietitian (M.A.D.) based on the preparation method, item description, brand, and source provided. Previous attempts to operationally define “convenience foods” based on nutritional criteria have been problematic. For example, Brunner et al (Brunner, van der Horst, & Siegrist, 2010) categorized convenience foods as “highly processed,” “moderately processed,” “single components,” or salads, and observed the counterintuitive result that consumption of convenience food was unrelated to time and effort spent cooking. Given our interest in the degree to which foods can provide immediate reward without additional time and effort, we categorized foods based solely on the required level of preparation. As a result, ‘healthy’ and ‘unhealthy’ foods are represented in each category. To increase the validity of our estimates and eliminate skew in variable distributions, foods that were consumed in amounts of 5 kcal or less were excluded from analyses. Food preparation categories were defined based on the following criteria:
Home-prepared
Foods in this category required at least a minimal level of preparation prior to consumption, including baking or heating, chopping, or blending/mixing with other ingredients. Examples of home-prepared foods included mixed dishes such as casseroles, homemade sandwiches, cooked vegetables, and microwaveable entrees.
Ready-to-eat
This category encompassed foods that are ready-to-eat without preparation of any kind. Unwrapping, stirring, pouring, and putting foods in a bowl or on a plate was not considered food preparation. Examples of ready-to-eat items included yogurt, granola bars, potato chips, packaged cookies, meal replacement bars, and portable fruits (e.g., apples and bananas).
Away-from-home
This category included any food prepared outside of the home in a form intended to be consumed immediately. Thus, away-from-home foods included items from fast food or full-service restaurants, and take-away and delivered foods.
Data Analysis
Descriptive statistics were used to characterize the sample, and variable distributions were examined for skew and outlying cases. To correct for skew, energy density and the percentages of food items and energy intake from away-from-home foods were logarithmically transformed. Based on the distribution of data, education was coded with two levels (baccalaureate degree or higher; less than baccalaureate degree), income with four levels ($0–$29,999; $30,000–$59,999; $60,000–$89,999; $90,000 and higher), and marital status with two levels (single, separated, or divorced; married or living with partner). Self-reported ethnicity/race was coded in five categories (Asian, Black/African-American, Hispanic, non-Hispanic White, and multi-ethnic/other). ANOVA was used to compare home-prepared, ready-to-eat, and away-from-home foods on energy density (kcal/g), taste ratings, and mean amount consumed per eating occasion in terms of energy (kcal) and weight (grams).
It was hypothesized that greater impulsivity would be associated with more frequent consumption of ready-to-eat and away-from-home foods, and less frequent consumption of home-prepared foods. Linear regression was used to test associations between AUCDD and the percentage of food items and percentage of total energy from home-prepared, ready-to-eat, and away-from-home foods. Regression models included BMI and five demographic variables (age, education, income, ethnicity/race, and marital status) as control variables. Models were also repeated with only the demographic variables included as predictors to evaluate their associations with the percentage of food items and energy intake from each food preparation category.
It was also hypothesized that delay discounting would influence the amount of each home-prepared, ready-to-eat, and away-from-home food item consumed during a given eating occasion. Therefore, analyses tested whether the effect of AUCDD on caloric intake was modified by food preparation category. Linear mixed models were used to account for the nested structure of the data, which included repeated observations of dietary intake nested within eating occasions, one or more eating occasions nested within days, and multiple days nested within individual participants. We followed a “top-down” model building strategy (West, Welch, & Galecki, 2007). First, all predictors (food preparation category, AUCDD, and their interaction term) and potential control variables (age, BMI, education, income, ethnicity/race, marital status, perceived taste, and whether the food was consumed as part of a meal or as a snack) were entered in an initial model as fixed effects. All variables were centered at the grand mean to facilitate interpretation of estimates. Second, different model structures were compared in a series of models by adding or removing random effects at different levels of the data, and choosing the best-fitting model based on log-likelihood tests and changes in the Akaike information criterion (AIC). The covariance between random effects was left unstructured. Finally, different covariance structures for residuals were examined, but none were found to improve model fit over an independent residual structure. The interaction between food preparation category and AUCDD was probed by testing the simple slopes of AUCDD within each food category. Exploratory linear mixed models, utilizing the same control variables and model building process described above, tested whether food preparation category modified the effect of AUCDD on the energy density and weight consumed of reported foods.
Sensitivity analyses were conducted using a fourth food preparation category that distinguished foods requiring only heating (e.g., frozen pizzas) from other home-prepared foods. Delay discounting was not associated with the percentages of total energy or food items consumed from this category, and was not a significant predictor of energy intake or energy density of heat-only foods. Separating heat-only from other home-prepared foods also had no effect on the significance of tests involving other food categories; therefore, we report results using the three original food preparation categories described above. Analyses were conducted in Stata 11 (StataCorp, LLC, College Station, Texas).
Results
Sample characteristics are shown in Table 1. Participants were aged 32.4 (8.1) years with a BMI of 32.1 (3.9) kg/m2. Seventy percent reported belonging to a racial/ethnic minority group. Sixty-three percent were married or living with a partner and 53% had a 4-year college education or more. Mean AUCDD was 0.31 (0.26). The mean delay discounting curve is shown in Figure 1. AUCDD was significantly higher among women with a college degree versus those without (t(76)=−2.46, p=.02), but was not related to income, marital status, age, ethnicity/race, or BMI (all p’s>.30).
Table 1.
Sample characteristics (N=78).
| M | SD | |
|---|---|---|
| Age (years) | 32.4 | 8.1 |
| BMI (kg/m2) | 32.1 | 3.9 |
| AUCDD | .31 | .26 |
|
| ||
| N | % | |
|
| ||
| Race/ethnicity | ||
| Asian | 5 | 6.4 |
| Black/African-American | 30 | 38.5 |
| Hispanic | 15 | 19.2 |
| Multi-ethnic/Other | 5 | 6.4 |
| Non-Hispanic, White | 23 | 29.5 |
| Marital status | ||
| Single, separated, or divorced | 29 | 37.2 |
| Married or living with partner | 49 | 62.8 |
| Education level | ||
| High school or equivalent | 1 | 1.3 |
| Some college | 21 | 26.9 |
| 2-year degree or technical degree | 15 | 19.2 |
| Baccalaureate degree | 32 | 41.0 |
| Masters degree | 8 | 10.3 |
| Doctorate, legal, professional degree | 1 | 1.3 |
| Household income (USD) | ||
| $0–$14,999 | 8 | 10.3 |
| $15,000–$29,999 | 13 | 16.7 |
| $30,000–$44,999 | 14 | 18.0 |
| $45,000–$59,999 | 20 | 25.6 |
| $60,000–$74,999 | 7 | 9.0 |
| $75,000–$89,999 | 6 | 7.7 |
| $90,000 and above | 10 | 12.8 |
Note: BMI=body mass index; AUCDD=area under the delay discounting curve.
Figure 1.

Area under the delay discounting curve based on the mean indifference points.
Bars represent standard errors of the means. A smaller area under the curve defined by the indifference points represents greater discounting of delayed rewards and higher impulsivity.
Participants recorded 3,022 food items within 1,691 eating occasions across 496 days. On average, participants recorded 1.8 food items per eating occasion, and 6.1 food items per day. Characteristics of reported foods in each food preparation category are summarized in Table 2. Seventy-eight percent of foods consumed as snacks were ready-to-eat items; 18% of snacks were home-prepared and only 4% were obtained away-from-home (X2(2, N=3022)= 891.86, p<.001). Food items had an average energy content of 218.81 (SD=213.86) kcal, but energy content significantly differed according to food preparation category (F(2,3019)= 139.67, p<.0001). Food preparation categories also differed in energy-density (F(2,3019)= 10.74, p<.0001) and the weight of items consumed (F(2,3019)= 96.25, p<.0001). Taste ratings did not differ across food preparation categories (F(2,3019)= 1.35, p=.26).
Table 2.
Characteristics of food items by food preparation category1
| Home-prepared | Ready-to-eat | Away-from-home | |
|---|---|---|---|
| Observations | 1,521 | 1,030 | 497 |
| Consumed as snacks | 143 (9.4%) | 605 (58.7%) | 32 (6.4%) |
| M (SD)
|
|||
| Energy (kcal) | 237.62 (215.96)a | 140.94 (140.06)a | 316.97 (269.68)a |
| Energy density (kcal/g) | 1.86 (1.30)ab | 2.38 (1.87)a | 2.07 (1.07)b |
| Weight (g) | 157.43 (137.16)a | 94.93 (85.19)ab | 173.26 (155.07)b |
| Taste2 | 78.42 (18.03) | 77.27 (18.13) | 77.52 (19.59) |
Excludes items consumed in amounts ≤5 kcal. Food preparation categories sharing the same superscript significantly differ at p<.01.
Taste was rated on a scale from 0 (not tasty) to 100 (extremely tasty).
The data did not support the hypothesis that delay discounting is associated with more frequent intake of foods requiring minimal preparation. AUCDD was unrelated to intake of home-prepared (coefficient=−0.04, 95%C.I.:−0.20, 0.11), ready-to-eat (coefficient=−0.02, 95%C.I.:−0.13, 0.10), and away-from-home (coefficient=0.59, 95%C.I.:−0.18, 1.35) foods as percentages of the total food items consumed in linear regression models that controlled for age, BMI, education, income, ethnicity/race, and marital status. Similarly, AUCDD was not associated with the percentages of total energy intake from home-prepared (coefficient=0.04, 95%C.I.:−0.12, 0.20), ready-to-eat (coefficient=−0.06, 95%C.I.: −0.16, 0.05), and away-from-home (coefficient=0.13, 95%C.I.: −0.40, 0.66) foods. When these models were repeated with only age, education, income, ethnicity/race, and marital status as predictors, none of these demographic variables emerged as significant predictors of the percentages of reported food items and total energy intake from each food preparation category (all p’s>.05).
The extent to which food preparation category modified the effect of delay discounting on energy intake of individual food items was tested in a linear mixed model that controlled for age, BMI, education, income, ethnicity/race, marital status, perceived taste, and whether the food was consumed as a snack. The interaction between AUCDD and food preparation category was a statistically significant predictor of energy intake of individual food items (χ2(2, N=3022)=9.96, p<.01, Table 3, Figure 2). More impulsive responding on the delay discounting task (lower AUCDD), was associated with greater energy intake for ready-to-eat (estimate=−89.41, 95%C.I.: −162.15, −16.67) and away-from-home (estimate=−156.35, 95%C.I.: −283.39, −29.31) food items, but not for home-prepared food items (estimate=−8.94, 95%C.I.: −112.50, 94.62).
Table 3.
Linear mixed models predicting the energy intake and energy density of consumed foods.
| Estimates of fixed effects | Energy intake (kcal) | Energy density (kcal/g) | ||
|---|---|---|---|---|
|
| ||||
| Estimate (95% C.I.) | P | Estimate (95% C.I.) | P | |
| AUCDD X Preparation | omnibus | <.01 | omnibus | .02 |
| AUCDD X Home-prepared | reference | reference | ||
| AUCDD X Ready-to-eat | −53.75 (−118.54,11.03) | .10 | −.17 (−.36,.03) | .10 |
| AUCDD X Away-from-home | −143.03 (−233.88,−52.17) | <.01 | −.33 (−.58,−.09) | <.01 |
| AUCDD | −10.52 (−87.38,66.34) | .79 | .06 (−.11,.24) | .48 |
| Preparation | omnibus | <.01 | omnibus | <.01 |
| Home-prepared | reference | reference | ||
| Ready-to-eat | −99.77 (−118.28,−81.27) | <.01 | .03 (.02,.09) | .24 |
| Away-from-home | 80.11 (56.07,104.15) | <.01 | .11 (.04,.17) | <.01 |
| Consumed as snack | −25.03 (−46.44,−3.61) | .02 | −.05 (−.13,.03 | .22 |
| Age | −.16 (−2.40,2.07) | .89 | .004 (−.001,.009) | .09 |
| BMI | 2.99 (−2.03,8.01) | .24 | .006 (−.005,.016) | .28 |
| Baccalaureate degree or higher | −32.59 (−70.86,5.69) | .10 | .02 (−.06,.10) | .65 |
| Household income (USD/year) | omnibus | .04 | omnibus | .02 |
| $0–$29,999 | reference | reference | ||
| $30,000–$59,999 | −40.40 (−86.01,5.22) | .08 | −.03 (−.13,.06) | .50 |
| $60,000–$89,999 | −79.24 (−134.26,−24.22) | <.01 | −.16 (−.28,−.05) | <.01 |
| $90,000 and higher | −64.18 (−135.06,6.69) | .08 | −.12 (−.27,.03) | .11 |
| Married or living with partner | −19.91 (−59.81,19.99) | .33 | −.06 (−.13,.03) | .22 |
| Ethnicity/Race | omnibus | .76 | omnibus | .72 |
| Non-Hispanic, white | reference | reference | ||
| Hispanic | −20.07 (−73.48,33.33) | .46 | .01 (−.10,.12) | .92 |
| African-American | −16.61 (−63.14,29.92) | .48 | −.05 (−.15,.05) | .30 |
| Asian | −25.57 (−105.79,54.65) | .53 | −.03 (−.19,.14) | .76 |
| Multi-ethnic/other | 23.37 (−52.38,99.11) | .55 | .04 (−.12.20) | .65 |
| Taste (0–100 scale) | 1.95 (1.31,2.59) | <.01 | 0 (0–0) | .05 |
| Constant | 401.66 (326.59,476.59) | <.01 | .58 (.40,.76) | <.01 |
|
| ||||
| Estimates of random effects | Estimate (95% C.I.) | Estimate (95% C.I.) | ||
|
| ||||
| Person-level intercept | 59.83 (45.95,77.89) | .09 (.06,.14) | ||
| Person-level slope of taste | 1.70 (1.06,2.72) | .003 (.002,.006) | ||
| Day-level intercept | 0 (0–0) | (not modeled) | ||
| Eating occasion-level intercept | 112.96 (101.11,126.20) | .11 (.08,.16) | ||
C.I., confidence interval; AUCDD, area under the delay discounting curve; BMI, body mass index.
Figure 2.
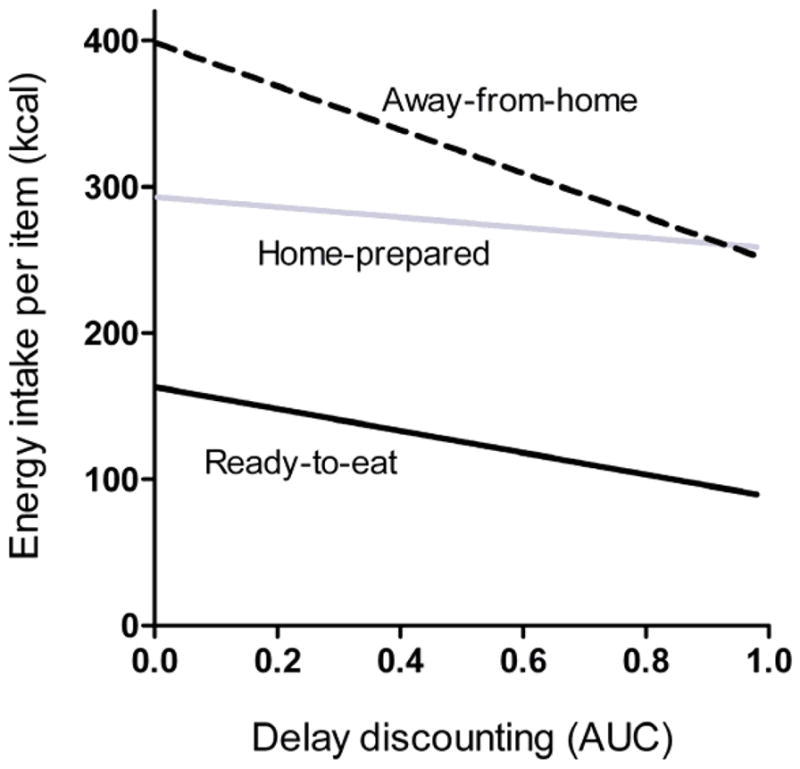
Association of delay discounting with energy intake of individual food items by preparation category.
Low delay discounting area under the curve reflects higher impulsivity.
As energy intake is a function of both the energy density (kcal/g) and the weight (g) of the food consumed, we conducted exploratory analyses to determine whether the interaction between delay discounting and food preparation is related to either of these two characteristics of the home-prepared, ready-to-eat, and away-from-home food items consumed by participants. The AUCDD by food preparation interaction was significantly associated with energy density in a linear mixed model (χ2(2, N=3022)=7.82, p=.02, Table 3, Figure 3). More impulsive responding on the delay discounting task was associated with greater energy density for away-from-home (estimate=−0.28, 95%C.I.: −0.48, −0.08) food items, but not for ready-to-eat (estimate=−0.18, 95%C.I.: −0.50, 0.14) or home-prepared (estimate=0.04, 95%C.I.: −0.17, 0.24) food items. In a model predicting the weight of food consumed, the impulsivity by food preparation interaction was not significant (χ2(2, N=3022)=1.15, p=.56). The main effect of AUCDD on the weight of food consumed was also not significant.
Figure 3.
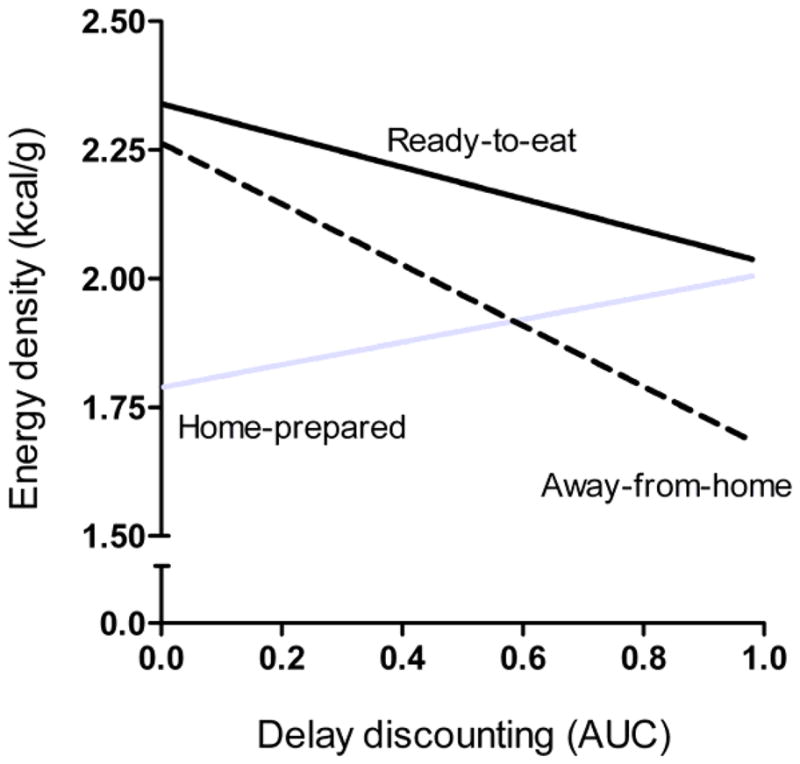
Association of delay discounting with the energy density of individual food items by preparation category.
Low delay discounting area under the curve reflects higher impulsivity.
Discussion
Among overweight and obese women, steeper discounting of delayed rewards was associated with greater energy intake when eating away-from-home and ready-to-eat foods, but not home-prepared foods. Delay discounting was also associated with a higher energy-density, but not the weight, of away-from-home foods, suggesting that the choice of high-calorie foods by impulsive individuals contributes to greater energy intake in settings such as fast food and full-service restaurants. Findings provide partial support for a conceptualization of delay discounting as marker of poor inhibitory control of reward-driven eating behavior (Appelhans, 2009; Appelhans et al., 2011; Epstein et al., 2010). Other recent studies support this view. In normal weight women, weight gain over one year was highest among women who had both an implicit preference for snack foods and low inhibitory control (Nederkoorn, Houben, Hofmann, Roefs, & Jansen, 2010). Impulsivity has also been associated with greater snack intake in laboratory settings (Guerrieri, Nederkoorn, & Jansen, 2007), particularly among subgroups prone to overeating (Jansen et al., 2009). To our knowledge, this is the first study to link delay discounting to real-world consumption of away-from-home and ready-to-eat foods.
Contrary to expectations, delay discounting was not associated with a tendency to consume away-from-home and ready-to-eat foods more frequently, as reflected in the percentages of eating occasions and total energy intake. Though individuals who demonstrate a preference for immediate rewards might be more inclined to seek out immediate food reward from away-from-home and ready-to-eat foods in their day-to-day lives, some amount of time and effort is also required to obtain away-from-home and ready-to-eat foods. This could potentially reduce the extent to which impulsivity drives consumption of away-from-home and ready-to-eat foods. Additionally, as adiposity is associated with away-from-home food intake (Bowman & Vinyard, 2004; Chan & Sobal, 2011; Larson et al., 2011), our ability to detect associations between delay discounting and away-from-home and ready-to-eat intake may have been limited by the restricted range of adiposity in this sample. Prior research has linked away-from-home and ready-to-eat food consumption to social and demographic factors, such as age, income, ethnicity/race, employment status, and family composition (Brunner et al., 2010; French, Harnack, & Jeffery, 2000; van der Horst, Brunner, & Siegrist, 2011), but this was not observed in the current sample. Intake of away-from-home and ready-to-eat foods may instead be driven by other behavioral processes, such as sensitivity to food reward (Paquet et al., 2010).
The delay discounting task used in this study has been linked to eating behavior and adiposity in prior research (Appelhans et al., 2011; Davis et al., 2010; Rollins et al., 2010; Weller et al., 2008), but it is possible that other domains of impulsivity are more relevant to away-from-home and ready-to-eat food consumption. For example, Nederkoorn and colleagues (Nederkoorn, Guerrieri, Havermans, Roefs, & Jansen, 2009) found that impulsive responding in a motor inhibition (stop signal) task was associated with greater purchasing of snacks by hungry shoppers in a virtual supermarket environment. Additional research assessing different domains of impulsivity is needed to identify modifiable drivers of away-from-home and ready-to-eat intake.
The finding that impulsivity was associated with greater energy intake while eating away-from-home and ready-to-eat foods, but not home-prepared foods, suggests that increasing reliance on home-prepared foods is critical to weight control among impulsive individuals. Weight loss interventions are beginning to focus on increasing the frequency of home food preparation and reducing exposure to away-from-home foods (French, Gerlach, Mitchell, Hannan, & Welsh, 2011; Fulkerson et al., 2010), and such approaches may be particularly beneficial for impulsive individuals. Fortunately, impulsive individuals did not demonstrate more frequent consumption of away-from-home and ready-to-eat foods, which could pose barrier to weight loss in the context of interventions focused on increased home food preparation. It is also worth noting that home-prepared foods did not differ from away-from-home and ready-to-eat in perceived taste, suggesting that low palatability is not a major obstacle to home food preparation as an intervention strategy.
This study had several limitations. First, beverage consumption was not addressed in this study due to the challenges inherent to coding beverages by food preparation category. As beverages appear to substantially contribute to energy balance and population-level obesity (Malik, Schulze, & Hu, 2006; Nielsen & Popkin, 2004), further research is needed to understand the potential role of behavioral processes such as impulsivity in beverage consumption. Though weighed food records collected over seven days is considered the “gold standard” for assessing actual dietary intake, dietary recording is known to influence consumption patterns (Burke, Wang, & Sevick, 2011; Surrao et al., 1998; Thompson & Subar, 2008). It is not possible to determine the extent to which this “reactive measurement” may have biased study findings. The cross-sectional nature of the data do not allow for causal inferences to be drawn regarding the association between delay discounting and intake of foods from different sources. An additional limitation is that we relied on a delay discounting task featuring hypothetical monetary rewards as our index of impulsivity. This task is widely used (Reynolds, 2006), and studies have shown that hypothetical monetary rewards produce similar estimates of delay discounting as actual monetary rewards (Johnson & Bickel, 2002; Madden, Begotka, Raiff, & Kastern, 2003; Madden et al., 2004). Participation was restricted to overweight or obese women aged 18–45 years and findings may not generalize to men or younger or leaner women. Replication of the current findings in men is particularly important considering known gender differences in food preparation habits (Larson, Perry, Story, & Neumark-Sztainer, 2006; Pereira, et al., 2005; Zick & Stevens, 2009), and that prior eating behavior research has often focused primarily on women. Finally, we defined food preparation categories based on simple behavioral criteria; foods requiring any amount of preparation were categorized as home-prepared, whereas foods that required no preparation at all were coded as ready-to-eat. Sensitivity analyses in which heat-only foods were separated from other home-prepared foods yielded the same pattern of results. Though this definition is objective and allows for a clear interpretation of the findings, it did not capture the amount of effort or time spent preparing foods. Future studies using categorization schemes that capture these dimensions of food preparation are needed.
In summary, delay discounting, a facet of impulsivity reflecting weaker inhibitory control of reward-driven behavior, was associated with the amount of energy consumed while eating away-from-home and ready-to-eat foods among overweight and obese women. For away-from-home foods, this effect may stem from the selection of more energy-dense food items. Findings suggest that increasing reliance on home-prepared foods may be a valuable component of weight control programs involving impulsive individuals.
Highlights.
Delay discounting (DD) is a facet of impulsivity associated with eating behavior
DD did not predict energy intake, but a DD X food preparation interaction was found
Impulsive women consumed away-from-home and ready-to-eat foods in larger quantities
Impulsive women also selected away-from-home foods with higher energy densities
DD was not linked to more frequent intake of away-from-home and ready-to-eat foods
Acknowledgments
This work was supported by National Cancer Institute grant R03CA139857 to Dr. Appelhans. Partial salary support for Dr. Waring is provided by NIH grant 1U01HL105268-01. We are grateful for the assistance of Kathleen Woolf, PhD, RD, Amy L. Odum, PhD, Rebecca Liebman, MPH, Barbara Mascitti, MS, RD, Erica Peters, Kaylan Olds, Diana Naranjo, and Catherine Purdom, as well as for the efforts of our participants.
Footnotes
The authors have no conflicts of interest to disclose.
Publisher's Disclaimer: This is a PDF file of an unedited manuscript that has been accepted for publication. As a service to our customers we are providing this early version of the manuscript. The manuscript will undergo copyediting, typesetting, and review of the resulting proof before it is published in its final citable form. Please note that during the production process errors may be discovered which could affect the content, and all legal disclaimers that apply to the journal pertain.
References
- Ainslie G. Breakdown of will. Cambridge, UK: Cambridge University Press; 2001. [Google Scholar]
- Alcaro A, Huber R, Panksepp J. Behavioral functions of the mesolimbic dopaminergic system: An affective neuroethological perspective. Brain Research Reviews. 2007;56(2):283–321. doi: 10.1016/j.brainresrev.2007.07.014. [DOI] [PMC free article] [PubMed] [Google Scholar]
- Anderson B, Rafferty AP, Lyon-Callo S, Fussman C, Imes G. Fast-food consumption and obesity among Michigan adults. Preventing Chronic Disease. 2011;8(4):A71. [PMC free article] [PubMed] [Google Scholar]
- Appelhans BM. Neurobehavioral inhibition of reward-driven feeding: Implications for dieting and obesity. Obesity. 2009;17(4):640–647. doi: 10.1038/oby.2008.638. [DOI] [PubMed] [Google Scholar]
- Appelhans BM, Woolf K, Pagoto SL, Schneider KL, Whited MC, Liebman R. Inhibiting food reward: Delay discounting, food reward sensitivity, and palatable food intake in overweight and obese women. Obesity. 2011;19(11):2175–2182. doi: 10.1038/oby.2011.57. [DOI] [PMC free article] [PubMed] [Google Scholar]
- Beck AT. The Beck Depression Inventory II. San Antonio: Harcourt Brace & Co; 1996. [Google Scholar]
- Berridge KC, Ho CY, Richard JM, Difeliceantonio AG. The tempted brain eats: Pleasure and desire circuits in obesity and eating disorders. Brain Research. 2010;1350:43–64. doi: 10.1016/j.brainres.2010.04.003. [DOI] [PMC free article] [PubMed] [Google Scholar]
- Beydoun MA, Powell LM, Wang Y. The association of fast food, fruit and vegetable prices with dietary intakes among US adults: Is there modification by family income? Social Science & Medicine. 2008;66(11):2218–2229. doi: 10.1016/j.socscimed.2008.01.018. [DOI] [PMC free article] [PubMed] [Google Scholar]
- Bickel WK, Miller ML, Yi R, Kowal BP, Lindquist DM, Pitcock JA. Behavioral and neuroeconomics of drug addiction: Competing neural systems and temporal discounting processes. Drug and Alcohol Dependence. 2007;90(Suppl 1):S85–91. doi: 10.1016/j.drugalcdep.2006.09.016. [DOI] [PMC free article] [PubMed] [Google Scholar]
- Bickel WK, Yi R. Temporal discounting as a measure of executive function: Insights from the competing neuro-behavioral decision system hypothesis of addiction. Advances in Health Economics and Health Services Research. 2008;20:289–309. [PubMed] [Google Scholar]
- Bowman SA, Vinyard BT. Fast food consumption of U.S. adults: Impact on energy and nutrient intakes and overweight status. Journal of the American College of Nutrition. 2004;23(2):163–168. doi: 10.1080/07315724.2004.10719357. [DOI] [PubMed] [Google Scholar]
- Brunner TA, van der Horst K, Siegrist M. Convenience food products: drivers for consumption. Appetite. 2010;55(3):498–506. doi: 10.1016/j.appet.2010.08.017. [DOI] [PubMed] [Google Scholar]
- Burke LE, Wang J, Sevick MA. Self-monitoring in weight loss: A systematic review of the literature. Journal of the American Dietetic Association. 2011;111(1):92–102. doi: 10.1016/j.jada.2010.10.008. [DOI] [PMC free article] [PubMed] [Google Scholar]
- Chan JC, Sobal J. Family meals and body weight. analysis of multiple family members in family units. Appetite. 2011;57(2):517–524. doi: 10.1016/j.appet.2011.07.001. [DOI] [PubMed] [Google Scholar]
- Cohen S, Kamarck T, Mermelstein R. A global measure of perceived stress. Journal of Health and Social Behavior. 1983;24:385–396. [PubMed] [Google Scholar]
- Craig CL, Marshall AL, Sjostrom M, Bauman AE, Booth ML, Ainsworth BE, Oja P. International physical activity questionnaire: 12-country reliability and validity. Medicine and Science in Sports and Exercise. 2003;35(8):1381–1395. doi: 10.1249/01.MSS.0000078924.61453.FB. [DOI] [PubMed] [Google Scholar]
- Dave JM, An LC, Jeffery RW, Ahluwalia JS. Relationship of attitudes toward fast food and frequency of fast-food intake in adults. Obesity. 2009;17(6):1164–1170. doi: 10.1038/oby.2009.26. [DOI] [PubMed] [Google Scholar]
- Davis C, Patte K, Curtis C, Reid C. Immediate pleasures and future consequences. A neuropsychological study of binge eating and obesity. Appetite. 2010;54(1):208–213. doi: 10.1016/j.appet.2009.11.002. [DOI] [PubMed] [Google Scholar]
- DelParigi A, Chen K, Salbe AD, Hill JO, Wing RR, Reiman EM, Tataranni PA. Successful dieters have increased neural activity in cortical areas involved in the control of behavior. International Journal of Obesity. 2007;31(3):440–448. doi: 10.1038/sj.ijo.0803431. [DOI] [PubMed] [Google Scholar]
- Duffey KJ, Gordon-Larsen P, Jacobs DR, Jr, Williams OD, Popkin BM. Differential associations of fast food and restaurant food consumption with 3-y change in body mass index: The Coronary Artery Risk Development in Young Adults Study. The American Journal of Clinical Nutrition. 2007;85(1):201–208. doi: 10.1093/ajcn/85.1.201. [DOI] [PubMed] [Google Scholar]
- Epstein LH, Salvy SJ, Carr KA, Dearing KK, Bickel WK. Food reinforcement, delay discounting and obesity. Physiology & Behavior. 2010;100(5):438–445. doi: 10.1016/j.physbeh.2010.04.029. [DOI] [PMC free article] [PubMed] [Google Scholar]
- Flegal KM, Carroll MD, Kuczmarski RJ, Johnson CL. Overweight and obesity in the United States: Prevalence and trends, 1960–1994. International Journal of Obesity and Related Metabolic Disorders. 1998;22(1):39–47. doi: 10.1038/sj.ijo.0800541. [DOI] [PubMed] [Google Scholar]
- Flegal KM, Carroll MD, Ogden CL, Curtin LR. Prevalence and trends in obesity among US adults, 1999–2008. JAMA. 2010;303(3):235–241. doi: 10.1001/jama.2009.2014. [DOI] [PubMed] [Google Scholar]
- French SA, Gerlach AF, Mitchell NR, Hannan PJ, Welsh EM. Household obesity prevention: Take action-a group-randomized trial. Obesity. 2011;19(10):2082–2028. doi: 10.1038/oby.2010.328. [DOI] [PMC free article] [PubMed] [Google Scholar]
- French SA, Harnack L, Jeffery RW. Fast food restaurant use among women in the pound of prevention study: Dietary, behavioral and demographic correlates. International Journal of Obesity and Related Metabolic Disorders. 2000;24(10):1353–1359. doi: 10.1038/sj.ijo.0801429. [DOI] [PubMed] [Google Scholar]
- Fulkerson JA, Rydell S, Kubik MY, Lytle L, Boutelle K, Story M, Garwick A. Healthy home offerings via the mealtime environment (HOME): Feasibility, acceptability, and outcomes of a pilot study. Obesity. 2010;18(Suppl 1):S69–74. doi: 10.1038/oby.2009.434. [DOI] [PMC free article] [PubMed] [Google Scholar]
- Fulton S. Appetite and reward. Frontiers in Neuroendocrinology. 2010;31(1):85–103. doi: 10.1016/j.yfrne.2009.10.003. [DOI] [PubMed] [Google Scholar]
- Gerrior S, Juan W, Basiotis P. An easy approach to calculating estimated energy requirements. Preventing Chronic Disease. 2006;3(4):A129. [PMC free article] [PubMed] [Google Scholar]
- Guerrieri R, Nederkoorn C, Jansen A. How impulsiveness and variety influence food intake in a sample of healthy women. Appetite. 2007;48(1):119–122. doi: 10.1016/j.appet.2006.06.004. [DOI] [PubMed] [Google Scholar]
- Halkjaer J, Tjonneland A, Overvad K, Sorensen TI. Dietary predictors of 5-year changes in waist circumference. Journal of the American Dietetic Association. 2009;109(8):1356–1366. doi: 10.1016/j.jada.2009.05.015. [DOI] [PubMed] [Google Scholar]
- Hare TA, Camerer CF, Rangel A. Self-control in decision-making involves modulation of the vmPFC valuation system. Science. 2009;324(5927):646–648. doi: 10.1126/science.1168450. [DOI] [PubMed] [Google Scholar]
- Hariri AR, Brown SM, Williamson DE, Flory JD, de Wit H, Manuck SB. Preference for immediate over delayed rewards is associated with magnitude of ventral striatal activity. The Journal of Neuroscience. 2006;26(51):13213–13217. doi: 10.1523/JNEUROSCI.3446-06.2006. [DOI] [PMC free article] [PubMed] [Google Scholar]
- Hoffman WF, Schwartz DL, Huckans MS, McFarland BH, Meiri G, Stevens AA, Mitchell SH. Cortical activation during delay discounting in abstinent methamphetamine dependent individuals. Psychopharmacology. 2008;201(2):183–193. doi: 10.1007/s00213-008-1261-1. [DOI] [PMC free article] [PubMed] [Google Scholar]
- Hollmann M, Hellrung L, Pleger B, Schlogl H, Kabisch S, Stumvoll M, Horstmann A. Neural correlates of the volitional regulation of the desire for food. International Journal of Obesity. 2011 doi: 10.1038/ijo.2011.125. in press. [DOI] [PubMed] [Google Scholar]
- Jansen A, Nederkoorn C, van Baak L, Keirse C, Guerrieri R, Havermans R. High-restrained eaters only overeat when they are also impulsive. Behaviour Research and Therapy. 2009;47(2):105–110. doi: 10.1016/j.brat.2008.10.016. [DOI] [PubMed] [Google Scholar]
- Johnson MW, Bickel WK. Within-subject comparison of real and hypothetical money rewards in delay discounting. Journal of the Experimental Analysis of Behavior. 2002;77(2):129–146. doi: 10.1901/jeab.2002.77-129. [DOI] [PMC free article] [PubMed] [Google Scholar]
- Kruger J, Blanck HM, Gillespie C. Dietary and physical activity behaviors among adults successful at weight loss maintenance. The International Journal of Behavioral Nutrition and Physical Activity. 2006;3:17. doi: 10.1186/1479-5868-3-17. [DOI] [PMC free article] [PubMed] [Google Scholar]
- Larson NI, Perry CL, Story M, Neumark-Sztainer D. Food preparation by young adults is associated with better diet quality. Journal of the American Dietetic Association. 2006;106(12):2001–2007. doi: 10.1016/j.jada.2006.09.008. [DOI] [PubMed] [Google Scholar]
- Larson N, Neumark-Sztainer D, Laska MN, Story M. Young adults and eating away from home: Associations with dietary intake patterns and weight status differ by choice of restaurant. Journal of the American Dietetic Association. 2011;111(11):1696–1703. doi: 10.1016/j.jada.2011.08.007. [DOI] [PMC free article] [PubMed] [Google Scholar]
- Le DS, Pannacciulli N, Chen K, Del Parigi A, Salbe AD, Reiman EM, Krakoff J. Less activation of the left dorsolateral prefrontal cortex in response to a meal: A feature of obesity. The American Journal of Clinical Nutrition. 2006;84(4):725–731. doi: 10.1093/ajcn/84.4.725. [DOI] [PubMed] [Google Scholar]
- Le DS, Pannacciulli N, Chen K, Salbe AD, Hill JO, Wing RR, Krakoff J. Less activation in the left dorsolateral prefrontal cortex in the reanalysis of the response to a meal in obese than in lean women and its association with successful weight loss. The American Journal of Clinical Nutrition. 2007;86(3):573–579. doi: 10.1093/ajcn/86.3.573. [DOI] [PMC free article] [PubMed] [Google Scholar]
- Lowe MR, Butryn ML, Didie ER, Annunziato RA, Thomas JG, Crerand CE, Halford J. The Power of Food Scale. A new measure of the psychological influence of the food environment. Appetite. 2009;53(1):114–118. doi: 10.1016/j.appet.2009.05.016. [DOI] [PubMed] [Google Scholar]
- Madden GJ, Begotka AM, Raiff BR, Kastern LL. Delay discounting of real and hypothetical rewards. Experimental and Clinical Psychopharmacology. 2003;11(2):139–145. doi: 10.1037/1064-1297.11.2.139. [DOI] [PubMed] [Google Scholar]
- Madden GJ, Raiff BR, Lagorio CH, Begotka AM, Mueller AM, Hehli DJ, Wegener AA. Delay discounting of potentially real and hypothetical rewards: II. between- and within-subject comparisons. Experimental and Clinical Psychopharmacology. 2004;12(4):251–261. doi: 10.1037/1064-1297.12.4.251. [DOI] [PubMed] [Google Scholar]
- Malik VS, Schulze MB, Hu FB. Intake of sugar-sweetened beverages and weight gain: A systematic review. The American Journal of Clinical Nutrition. 2006;84(2):274–288. doi: 10.1093/ajcn/84.1.274. [DOI] [PMC free article] [PubMed] [Google Scholar]
- McClure SM, Ericson KM, Laibson DI, Loewenstein G, Cohen JD. Time discounting for primary rewards. The Journal of Neuroscience. 2007;27(21):5796–5804. doi: 10.1523/JNEUROSCI.4246-06.2007. [DOI] [PMC free article] [PubMed] [Google Scholar]
- McClure SM, Laibson DI, Loewenstein G, Cohen JD. Separate neural systems value immediate and delayed monetary rewards. Science. 2004;306(5695):503–507. doi: 10.1126/science.1100907. [DOI] [PubMed] [Google Scholar]
- Mesulam MM. The human frontal lobes: Transcending the default mode through contingent encoding. In: Stuss DT, Knight RL, editors. Principles of frontal lobe function. Oxford: Oxford University Press; 2002. pp. 8–30. [Google Scholar]
- Miller EK, Cohen JD. An integrative theory of prefrontal cortex function. Annual Review of Neuroscience. 2001;24:167–202. doi: 10.1146/annurev.neuro.24.1.167. [DOI] [PubMed] [Google Scholar]
- Mitchell SH. Measures of impulsivity in cigarette smokers and non-smokers. Psychopharmacology. 1999;146(4):455–464. doi: 10.1007/pl00005491. [DOI] [PubMed] [Google Scholar]
- Myerson J, Green L, Warusawitharana M. Area under the curve as a measure of discounting. Journal of the Experimental Analysis of Behavior. 2001;76(2):235–243. doi: 10.1901/jeab.2001.76-235. [DOI] [PMC free article] [PubMed] [Google Scholar]
- Nederkoorn C, Guerrieri R, Havermans RC, Roefs A, Jansen A. The interactive effect of hunger and impulsivity on food intake and purchase in a virtual supermarket. International Journal of Obesity. 2009;33(8):905–912. doi: 10.1038/ijo.2009.98. [DOI] [PubMed] [Google Scholar]
- Nederkoorn C, Houben K, Hofmann W, Roefs A, Jansen A. Control yourself or just eat what you like? Weight gain over a year is predicted by an interactive effect of response inhibition and implicit preference for snack foods. Health Psychology. 2010;29(4):389–393. doi: 10.1037/a0019921. [DOI] [PubMed] [Google Scholar]
- Nielsen SJ, Popkin BM. Changes in beverage intake between 1977 and 2001. American Journal of Preventive Medicine. 2004;27(3):205–210. doi: 10.1016/j.amepre.2004.05.005. [DOI] [PubMed] [Google Scholar]
- Nielsen SJ, Siega-Riz AM, Popkin BM. Trends in energy intake in U.S. between 1977 and 1996: Similar shifts seen across age groups. Obesity Research. 2002;10(5):370–378. doi: 10.1038/oby.2002.51. [DOI] [PubMed] [Google Scholar]
- Odum AL. Delay discounting: Trait variable? Behavioural Processes. 2011;87(1):1–9. doi: 10.1016/j.beproc.2011.02.007. [DOI] [PMC free article] [PubMed] [Google Scholar]
- Paquet C, Daniel M, Knauper B, Gauvin L, Kestens Y, Dube L. Interactive effects of reward sensitivity and residential fast-food restaurant exposure on fast-food consumption. The American Journal of Clinical Nutrition. 2010;91(3):771–776. doi: 10.3945/ajcn.2009.28648. [DOI] [PubMed] [Google Scholar]
- Patton JH, Stanford MS, Barratt ES. Factor structure of the Barratt Impulsiveness Scale. Journal of Clinical Psychology. 1995;51(6):768–774. doi: 10.1002/1097-4679(199511)51:6<768::aid-jclp2270510607>3.0.co;2-1. [DOI] [PubMed] [Google Scholar]
- Pereira MA, Kartashov AI, Ebbeling CB, Van Horn L, Slattery ML, Jacobs DR, Jr, Ludwig DS. Fast-food habits, weight gain, and insulin resistance (the CARDIA study): 15-year prospective analysis. Lancet. 2005;365(9453):36–42. doi: 10.1016/S0140-6736(04)17663-0. [DOI] [PubMed] [Google Scholar]
- Poti JM, Popkin BM. Trends in energy intake among US children by eating location and food source, 1977–2006. Journal of the American Dietetic Association. 2011;111(8):1156–1164. doi: 10.1016/j.jada.2011.05.007. [DOI] [PMC free article] [PubMed] [Google Scholar]
- Reuter J, Raedler T, Rose M, Hand I, Glascher J, Buchel C. Pathological gambling is linked to reduced activation of the mesolimbic reward system. Nature Neuroscience. 2005;8(2):147–148. doi: 10.1038/nn1378. [DOI] [PubMed] [Google Scholar]
- Reynolds B. A review of delay-discounting research with humans: Relations to drug use and gambling. Behavioural Pharmacology. 2006;17(8):651–667. doi: 10.1097/FBP.0b013e3280115f99. [DOI] [PubMed] [Google Scholar]
- Rollins BY, Dearing KK, Epstein LH. Delay discounting moderates the effect of food reinforcement on energy intake among non-obese women. Appetite. 2010;55(3):420–425. doi: 10.1016/j.appet.2010.07.014. [DOI] [PMC free article] [PubMed] [Google Scholar]
- Spielberger CD. Manual for the State-Trait Anxiety Inventory. Palo Alto, CA: Consulting Psychologists Press, Inc; 1983. [Google Scholar]
- Stunkard AJ, Messick S. The Three-Factor Eating Questionnaire to measure dietary restraint, disinhibition and hunger. Journal of Psychosomatic Research. 1985;29(1):71–83. doi: 10.1016/0022-3999(85)90010-8. [DOI] [PubMed] [Google Scholar]
- Surrao J, Sawaya AL, Dallal GE, Tsay R, Roberts SB. Use of food quotients in human doubly labeled water studies: Comparable results obtained with 4 widely used food intake methods. Journal of the American Dietetic Association. 1998;98(9):1015–1020. doi: 10.1016/S0002-8223(98)00232-6. [DOI] [PubMed] [Google Scholar]
- Tanaka SC, Doya K, Okada G, Ueda K, Okamoto Y, Yamawaki S. Prediction of immediate and future rewards differentially recruits cortico-basal ganglia loops. Nature Neuroscience. 2004;7(8):887–893. doi: 10.1038/nn1279. [DOI] [PubMed] [Google Scholar]
- Thompson FE, Subar AF. Dietary assessment methodology. In: Coulston AM, Boushey C, editors. Nutrition in the prevention and treatment of disease. 2. Burlington, MA: Elsevier; 2008. pp. 3–39. [Google Scholar]
- U.S. Department of Agriculture, Economic Research Services. Food CPI and expenditures: Table 10. 2011 Retrieved 11/21/2011, from www.ers.usda.gov/briefing/cpifoodandexpenditures/Data/Expenditures_tables/table10.htm.
- U.S. Department of Health and Human Services & U.S. Department of Agriculture. Dietary Guidelines for Americans, 2005. Washington, DC: U.S. Government Printing Office; 2005. [Google Scholar]
- U.S. Department of Labor, Bureau of Labor Statistics. Consumer expenditure survey database. 2011 Retrieved 11/21/2011 from http://data.bls.gov/pdq/querytool.jsp?survey=cx.
- van der Horst K, Brunner TA, Siegrist M. Fast food and take-away food consumption are associated with different lifestyle characteristics. Journal of Human Nutrition and Dietetics. 2011;24(6):596–602. doi: 10.1111/j.1365-277X.2011.01206.x. [DOI] [PubMed] [Google Scholar]
- Van Strien T, Frijters JE, Bergers GP, Defares PB. The Dutch Eating Behavior Questionnaire (DEBQ) for assessment of restrained, emotional, and external eating behavior. International Journal of Eating Disorders. 1986;5(2):295–315. [Google Scholar]
- Weller RE, Cook EW, III, Avsar KB, Cox JE. Obese women show greater delay discounting than healthy-weight women. Appetite. 2008;51(3):563–569. doi: 10.1016/j.appet.2008.04.010. [DOI] [PubMed] [Google Scholar]
- West BT, Welch KB, Galecki AT. Linear mixed models: A practical guide using statistical software. Boca Raton, FL: Chapman & Hall/CRC; 2007. [Google Scholar]
- Zheng H, Lenard NR, Shin AC, Berthoud HR. Appetite control and energy balance regulation in the modern world: Reward-driven brain overrides repletion signals. International Journal of Obesity. 2009;33(Suppl 2):S8–13. doi: 10.1038/ijo.2009.65. [DOI] [PMC free article] [PubMed] [Google Scholar]
- Zick CD, Stevens RB. Trends in Americans’ food-related time use: 1975–2006. Public Health Nutrition. 2010;13(7):1064–1072. doi: 10.1017/S1368980009992138. [DOI] [PubMed] [Google Scholar]