

Abstract
Ferritin-like molecules are unique to cellular iron homeostasis because they can store iron at concentrations much higher than those dictated by the solubility of Fe3+. Very little is known about the protein interactions that deliver iron for storage, or promote the mobilization of stored iron from ferritin-like molecules. Here, we report the X-ray crystal structure of Pseudomonas aeruginosa bacterioferritin (Pa-BfrB) in complex with bacterioferritin-associated ferredoxin (Pa-Bfd) at 2.0 Å resolution. As the first example of a ferritin-like molecule in complex with a cognate partner, the structure provides unprecedented insight into the complementary interface that enables the [2Fe-2S] cluster of Pa-Bfd to promote heme-mediated electron transfer through the BfrB protein dielectric (~18 Å), a process that is necessary to reduce the core ferric mineral and facilitate mobilization of Fe2+. The Pa-BfrB-Bfd complex also revealed the first structure of a Bfd, thus providing a first view to what appears to be a versatile metal binding domain ubiquitous to the large Fer2_BFD family of proteins and enzymes with diverse functions. Residues at the Pa-BfrB-Bfd interface are highly conserved in Bfr and Bfd sequences from a number of pathogenic bacteria, suggesting that the specific recognition between Pa-BfrB and Pa-Bfd is of widespread significance to the understanding of bacterial iron homeostasis.
INTRODUCTION
Iron is an essential nutrient needed as cofactor in respiration, nitrogen fixation, photosynthesis, and DNA synthesis and repair.1,2 Iron acquisition, storage and utilization are subject to tight homeostatic regulation because the soluble Fe2+ can react with O2 to form reactive oxygen species and the highly insoluble Fe3+.3 The challenges presented to cells by the chemical properties of iron have been largely answered in the unique structure and function of ferritin and ferritin-like molecules. These have nearly spherical and hollow structures assembled from 24 subunits (~ 450 kDa) where each subunit consists of a four-helix bundle and a short C-terminal helix that is nearly perpendicular to the bundle. The pivotal contributions made by ferritin-like molecules to iron homeostasis are manifested by their presence in all three domains of life with remarkable conservation of structure and function despite very low conservation in sequence (<20%).4,5 Three types of ferritin-like molecules are present in bacteria: the ferritins (Ftn), the bacterioferritins (Bfr), and the Dps (DNA binding proteins from starved cells).2 Ftns and Bfrs are composed of 24 subunits that assemble into a spherical protein with a hollow cavity approximately 8 nm in diameter where the iron mineral is stored. Dps are composed of 12 subunits, which assemble into a nearly spherical protein with a central cavity approximately 4.5 nm diameter. A unique property of the bacterioferritins, which only occur in bacteria and archaea,4 is that they bind a heme molecule between two subunits (Figure 1a), so that the 24-mer protein consists of 12 subunit dimers and 12 hemes (Figure 1b). The heme is buried deep below the protein surface (~13 Å) such that the heme propionates reach into the interior cavity where the iron mineral is stored (Figure 1c).
Figure 1.

Structure of Pa BfrB (PDB 3IS7). (a) a subunit dimer and the intersubunit location of heme which is coordinated by a conserved methionine in each of the subunits, (b) the biological assembly consisting of 12 subunit-dimers and 12 heme molecules, viewed along a four-fold pore where a K+ ion (purple sphere) is bound, and (c) a view of the large interior cavity where the iron mineral is stored, illustrating how heme molecules are buried below the protein surface with the heme propionates extending into the interior cavity (heme is in green with O atomos in red, and N atoms in blue).
Ferritin and ferritin-like molecules capture Fe2+, convert it to Fe3+ at catalytic centers located in the middle of each subunit, using O2 or H2O2 as oxidants, and store Fe3+ as a mineral in their hollow cavities, effectively concentrating Fe3+ to levels orders of magnitude higher that those permitted by its low solubility.6 When the nutrient is needed in metabolism, the ferric mineral is solubilized by reducing it to Fe2+, which exits the protein shell via channels formed in the 24-mer assembly.5,7-9 The biological ligands or the protein-protein interactions that enable electron transfer into the interior cavity of eukaryotic ferritin to promote release of Fe2+ have thus far remained mysterious. Studies of E. coli and P. aeruginosa Bfr suggest that recovery of iron from the Bfr cavity requires specific protein-protein interactions to mediate electrons into the Bfr core and promote Fe2+ release.10-12 Although the heme in Bfr is thought to mediate electrons across the ~20 Å protein shell,10,13,14 the fact that it is buried deep below the surface (Figure 1c) has made it challenging to understand how cognate partners may interact with Bfr and how the electrons supplied via protein-protein interactions reach the heme. Nevertheless, attaining atomic level understanding of the intermolecular interactions that enable ferritin-like molecules to maintain iron homeostasis in bacteria is important because of the recent demonstration that bacterial iron storage proteins are critical for the survival of pathogens in the host and therefore may be attractive targets for antimicrobial development.15
P. aeruginosa is a Gram negative opportunistic pathogen, and is the major pathogen responsible for the decline of lung function and premature death in patients with cystic fibrosis by virtue of persistent infections that steadily destroy host tissues.16,17 In P. aeruginosa and in E. coli the bfr gene is contiguous to a gene dubbed bfd (bacterioferritin-associated ferredoxin) for its proximity to bfr and the fact that its product binds a [2Fe-2S] cluster.11,12,18,19 E. coli Bfd (Ec-Bfd) binds to Ec-Bfr, which led several groups to suggest that Ec-Bfd may function either as electron acceptor in the process of iron uptake by Ec-Bfr or as electron donor in iron mobilization from Ec-Bfr.11,12 This issue has been pursued in more detail in P. aeruginosa,10 capitalizing on its known global genetic response to high- or low-iron concentrations.20,21 Among the large number of genes responding to low-iron stimulus, bfd is strongly up-regulated, and a gene coding a ferredoxin reductase (fpr) is also up-regulated, whereas bfrB is down-regulated. The strong up-regulation of bfd under low-iron prompted us to suggest that Pa-Bfd may participate in the mobilization of iron from Pa-BfrB by mediating electrons from Pa-FPR to Pa-BfrB, enabling reduction of the ferric mineral and the release of Fe2+.10 Characterization of the proteins coded by the bfd, fpr and bfr genes in P. aeruginosa showed that Pa-FPR is a 29.4 kDa, NADPH-dependent flavoprotein19,22 and Pa-Bfd is a 7.1 kDa protein that binds a [2Fe-2S] cluster.19 An early investigation suggested that Pa-Bfr is a heteropolymer assembled from two different subunits, α-Bfr and β-Bfr.23 Subsequent studies established the presence of two genes encoding ferritin-like molecules (bfrA and bfrB) but suggested that two distinct bacterioferritins (Pa-BfrA and Pa-BfrB) may coexist.24 More recently, we showed that the product of bfrB is a genuine bacterioferritin assembled from 24 identical subunits and 12 heme molecules,25 whereas the product of bfrA, also assembled from 24 identical subunits, does not bind heme and is not a bacterioferritin but a bacterial ferritin, now termed Pa-FtnA.26 Hence, two distinct ferritins coexist in P. aeruginosa, a bacterioferritin (Pa-BfrB) and a bacterial ferritin (Pa-FtnA).
In vitro reconstitution of Pa-BfrB with Pa-FPR, Pa-Bfd and NADPH enables heme-mediated electron transfer into the Pa-BfrB cavity and release of Fe2+. In the absence of Pa-Bfd the heme is not reduced and iron is not mobilized from Pa-BfrB,10 indicating that Pa-Bfd mediates electrons between Pa-FPR and Pa-BfrB. Similar experiments conducted with apo-Pa-Bfd prepared in situ, however, showed that apo-Pa-Bfd also stimulates the rapid mobilization of Fe2+ from Pa-BfrB, suggesting the possibility that the role of apo-Bfd is to recruit the reductase (Pa-FPR) to the Pa-BfrB surface.10 Thus, although the interplay between BfrB, Bfd and FPR is a unique example of specific protein interactions regulating the function of ferritin-like molecules, the particular roles played by Bfd and FPR in the release of iron remain unclear. Herein we report the crystal structure of the Pa-BfrB-Pa-Bfd complex, which reveals a highly complementary interface that positions the [2Fe-2S] cluster of Pa-Bfd in an ideal position to transfer electrons to the heme in Pa-BfrB. The structure also provides a first insight into the Bfd fold, which appears to require a phosphate ion for optimum stability, a finding that was exploited to prepare apo-Pa-Bfd and demonstrate that the [2Fe-2S] cluster must be present in Pa-Bfd to support heme reduction and Fe2+ mobilization from Pa-BfrB.
EXPERIMENTAL PROCEDURES
Pa-BfrB and the C34S mutant of Pa-Bfd were prepared and purified as reported previously.10 The C43S mutant is more stable to purification storage and manipulation but has the same spectroscopic and functional properties of Pa-Bfd.10 Hence, in this report the C34S mutant will be referred to as Pa-Bfd. The preparation of Pa-BfrB containing ~600 iron atoms per Pa-BfrB molecule and the experiments conducted to measure iron release from Pa-BfrB were carried out as described previously.10
Preparation of Apo-Bfd
A 0.8 mM solution of Pa-Bfd in 50 mM potassium phosphate (pH 7.0), 150 mM NaCl, 5 mM DTT was diluted 8 times in buffer 1, consisting of sodium acetate buffer (150 mM, pH 5.5) 8 M urea, 150 mM NaCl, 5 mM tris(2-carboxyethyl)phosphine (TCEP) and 3 mM hydroxybenzyl ethylenediamine (HBED). The resultant solution was stirred continuously at room temperature for 70 min. Iron chelated by HBED was removed by dialysis against buffer 1 at room temperature. HBED was then removed by dialysis against buffer 1 without the chelator and the apo-protein was then dialyzed against buffer 2 (200 mM potassium phosphate, 8 M urea, 5 mM TCEP, pH 7.0) at room temperature. Refolding of apo-Bfd was carried out in two steps by dialyzing the protein against buffer 2 containing 4 M urea at 4 °C, and then against buffer 2 without urea at 4 °C.
Crystallization and X-ray data collection
Crystal growth conditions were screened with solutions of Pa-BfrB (40 μM) in 100 mM potassium phosphate (pH 7.6), 1 mM TCEP, and Pa-Bfd (480 μM) in 50 mM potassium phosphate (pH 7.0), 150 mM NaCl and 5 mM DTT. The solutions were combined to produce a mixture with a 12Bfd:1BfrB mole ratio. Equal volumes of protein and crystallant (1 μL) were equilibrated against 100 μL of the latter in sitting drop vapor diffusion plates at 18 °C. Small prismatic crystals were obtained in 1-2 days with condition G8 (0.8 M Na/K hydrogen phosphate, pH 7.5) of the Proplex HT screen (Molecular Dimensions). Crystals were transferred to a fresh drop of 80% crystallization solution and 20% glycerol before flash freezing. Data were collected (λ=1.0000 Å) at the Advanced Photon Source beamline 17ID, Argonne National Laboratories, using a Dectris Pilatus 6M pixel array detector.
Structure solution and refinement
Intensities were integrated using XDS27 and the Laue class check and data scaling were performed with Aimless.28 The highest probability Laue class was 4/mmm and space group P4212. The Matthew’s coefficient (Vm)29 and % solvent content were estimated to be 2.9 and 58.2% for 6 Pa-BfrB subunits in the asymmetric unit. Structure solution was conducted by molecular replacement with Phaser30 via the Phenix31 interface. All space groups with 422 point symmetry were tested using a Pa-BfrB dimer from a previously determined structure (PDB: 3IS7)25 as the search model. The top solution, consisting of three subunit-dimers, was obtained in the space group P4212, which was used from this point forward. Following initial refinement with Phenix, difference electron density (Fo-Fc) consistent with Bfd molecules near the heme at the interface of each BfrB subunit-dimer were manually fit to the model using Coot32 and the structure was refined with Phenix. A second data set was collected with the same crystal at the Fe-edge (λ = 1.73769 Å) and anomalous difference electron density maps were calculated to confirm the orientation of the Fe-S cluster in the Bfd molecules. Structure validation was conducted with Molprobity33 and the data collection and refinement statistics are in Table 1. There were no amino acid outliers in the Ramachandran plot where 99.3% and 0.7% resided in the favored and allowed regions respectively.
Table 1.
Crystallographic data for Pa-BfrB-Bfd refined to 2.0 Å resolution.
| BfrB-Bfd | |
|---|---|
| Data Collection | |
| Unit-cell parameters (Å, °) | a=135.81, c=200.89 |
| Space group | P4212 |
| Resolution (Å)1 | 200.89-2.00 (2.03-2.00) |
| Wavelength (Å) | 1.0000 |
| Temperature (K) | 100 |
| Observed reflections | 1,120,495 |
| Unique reflections | 125,332 |
| <I/σ(I)>1 | 15.2 (3.0) |
| Completeness (%)1 | 100 (100) |
| Multiplicity1 | 8.9 (9.2) |
| Rmerge (%)1, 2 | 11.7 (80.5) |
| Rmeas (%)1, 4 | 13.3 (90.3) |
| Rpim (%)1, 4 | 4.4 (29.6) |
| Refinement | |
| Resolution (Å) | 47.73-2.0 |
| Reflections (working/test) | 118,964/6,294 |
| Reflections (working/test) | 118,964/6,294 |
| Rfactor / Rfree (%)3 | 15.2/18.3 |
| No. of atoms (BfrB/Bfd/Heme/Fe- S/K+/Na+/phosphate/water) |
7,714/1,087/258/12/3/6/5/1,062 |
| Model Quality | |
| R.m.s deviations | |
| Bond lengths (Å) | 0.011 |
| Bond angles (°) | 1.185 |
| A verage B factor (Å2) | |
| All Atoms | 24.0 |
| BfrB/Bfd | 20.9/41.4 |
| Heme/Fe-S/ K+/Na+/phosphate | 22.9/26.9/15.3/24.0/35.7 |
| Water | 39.1 |
| Coordinate error, maximum likelihood (Å) |
0.22 |
| Ramachandran Plot | |
| Most favored (%) | 99.3 |
| aAdditionally (%) | 0.7 |
1) Values in parenthesis are for the highest resolution shell.
2) Rmerge = ΣhklΣi |Ii(hkl) - <I(hkl)>| / ΣhklΣi Ii(hkl), where Ii(hkl) is the intensity measured for the ith reflection and <I(hkl)> is the average intensity of all reflections with indices hkl.
3) Rfactor = Σhkl ∥Fobs (hkl) | - |Fcalc (hkl) ∥ / Σhkl |Fobs (hkl)|; Rfree is calculated in an identical manner using 5% of randomly selected reflections that were not included in the refinement.
RESULTS AND DISCUSSION
Overall Structure of the Pa-BfrB-Bfd Complex
The crystal structure of Pa-BfrB in complex with Pa-Bfd (Pa-BfrB-Bfd) was determined at 2.0 Å resolution. The asymmetric unit cell contains three BfrB subunit dimers, each associated with electron density consistent with a Bfd molecule (Figure 2a). Well-defined electron density describes a molecule of Bfd bound at the interface of each BfrB subunit dimer in the asymmetric cell unit, above each of the heme molecules (Figure 2b and 2c). Hence, the biological assembly consists of a nearly spherical 24-mer BfrB with 12 heme and 12 Bfd molecules (Figure 2d). As observed in previous structures of Pa BfrB,25 electron density greater than 3σ is observed in the four-fold pores, which was modeled as potassium ions (purple) based on distances and coordination geometry. In addition, when sodium ions were refined at these sites, positive electron density was observed, which suggest that assignment as potassium is most likely correct. Barium and iron ions have also been observed in four-fold pores of Azotobacter vinelandii Bfr, leading to the suggestion that iron ions may traffic in and out of bacterioferritin via four-fold pores.34,35 In addition, and previously not observed in other bacterioferritin structures, positive electron density greater than 3σ is present at the B-pores of Pa BfrB in the BfrB-Bfd complex. This electron density was successfully modeled as sodium ions (green) coordinated by D34 from one of the subunits forming a B-pore and by D132 and T136 from another subunit related by crystallographic symmetry. Refinement as potassium ions or water molecules resulted in negative and positive electron density at these sites, respectively, which suggests that sodium ions are the most probable choice. Fo-Fc omit maps of electron density present in the four-fold and B-pores are shown in Figures 2e and 2f, respectively. The presence of sodium ions in B pores is the first structural evidence supporting the idea that B-pores in Bfr may serve as conduits for ion traffic.36 The ferroxidase center in the structure of the Pa-BfrB-Bfd complex is devoid of iron (magenta in Figure 2g) and the ferroxidase ligands adopt conformations identical to those observed in the empty ferroxidase center of Pa-BfrB alone25 (green in Figure 2g).
Figure 2.

Structure of the Pa-BfrB-Bfd complex. (a) The asymmetric unit cell consisting of three BfrB subunit-dimers, each associated with a Bfd molecule (cyan); Fe-S atoms are represented as orange and yellow spheres, respectively, the heme molecules between each subunit dimer are shown in green, potassium atoms in four-fold pores are represented as purple spheres, and sodium atoms in the B pores as green spheres. (b) Fo-Fc omit map contoured at 3σ showing the electron density (purple) of Bfd chain G. (c) View of a Bfd molecule (cyan) bound to the surface of a BfrB subunit-dimer above the heme, which is buried below the surface. (d) Biological assembly consisting of 12 Bfds bound to 12 BfrB subunit-dimers. (e) View of a four-fold pore in which K+ (purple) is coordinated by Asn148 and Gln151, (f) View of a B-pore in which Na+ is coordinated by Asp34, Asp132 and Thr136. The Fo-Fc omit maps for the K+ and Na+ ions contoured at 3σ are shown in green mesh and coordinated water molecules as red spheres. (g) Superposition of Pa-BfrB (green) and Pa-BfrB-Bfd (magenta) structures showing the ferroxidase center ligands.
The bfd fold
The structure of Pa-Bfd, revealed as part of the structural determination of the Pa-BfrB-Bfd complex, is the first structure of a Bfd molecule. The fold, comprised of helix-turn-helix, binds a [2Fe-2S] center via C-4, C-6, C-38 and C-41, located in loops 1 and 3 (Figure 3a), which are oriented nearly anti-parallel to one another and supported by three α-helices. Loop 1 (L1) contains C-4 and C-6 and is followed by a 3-turn helix (α-1). Loop 2 (L2) connects α-1 to the shortest helix in the structure, the two-turn α-2, which is followed by loop 3 (L3) containing C-38 and C-41. The longest helix in the structure (α-3) spans from C-41 to Q-57, which is the last residue for which electron density is observed. Anomalous difference electron density maps obtained from data collected at the Fe-edge allowed unambiguous identification of the iron atoms and placement of the [2Fe-2S] cluster (Figure 3b). The average Fe-Fe distance is 2.85 Å and the average Fe-S(Cys) and Fe-S2− distances are 2.31 Å and 2.22 Å, respectively, which are similar to those observed in structures of [2Fe-2S]-containing proteins.
Figure 3.

The Bfd fold. (a) View of the helix-turn-helix fold of Bfd (chain G) and associated [2Fe-2S] cluster; Fe and S are shown in orange and yellow spheres, respectively. (b) Zoomed-in view of the [2Fe-2S] cluster depicting phased anomalous difference maps (green mesh) of the iron ions obtained from diffraction data collected at λ = 1.73769 Å, contoured at 8σ. (c) Structural alignment showing how an equivalent of the Bfd structure (cyan) matches a portion of the structure (magenta) of the α-subunit of PDH1 (PDB: 1Y56); the RMSD of common Cα atoms in the alignment is 0.34 Å. (d) Structural alignment of Bfd with a portion of the N’terminal domain of CopZ-NT (PDB: 2HU9); the Zn2+-binding portion has been omitted to emphasize that the β-hairpin containing Fe ligands C75 and C77 and subsequent α-helix (magenta) are structurally equivalent to L1 (containing C4 and C6) and α-1 in Pa-Bfd (cyan). The loop-helix-loop containing C109 and 119 in CopZ-NT (green) is longer and structurally different from L3 in Pa-Bfd, but the Fe ligand C119 is structurally equivalent to C41 in Pa-Bfd.
Bfd-like sequences are present in a number of bacteria (Supplementary Figure S1). Four conserved cysteine residues are organized in a unique C-X1-C-X31-32-C-X2-C- arrangement in a peptide that at 73 residues long is ~50 residues shorter than [2Fe-2S] ferredoxins from bacteria, plants, fungi and vertebrates. Hence, Bfd is a class of [2Fe-2S] ferredoxin distinguishable from the others by its sequence and spectroscopic properties.12 Search of the Pfam database37 shows that the Bfd sequence determines a large, manually curated Pfam family, Fer2_BFD (PF04324), of single and multiple domain proteins where the C-X1-C arrangement is highly conserved and the C-X2-C arrangement is partially conserved. The Fer2_BFD sequence is present in multidomain enzymes and proteins with a variety of functions, such as nitrate, nitrite and sulfite reductases, FAD-dependent oxidoreductases, nitrogen fixation (NifU) proteins and copper and mercury transport proteins. Structural alignment searches conducted with I-COFACTOR,38 DALI39 and PdBeFold40 strongly suggest that the Bfd fold has not been previously observed in a single domain protein. It is interesting, however, that close matches were observed to a portion of the α-subunit of heterotetrameric sarcosine oxidase (TSOX) from Corynebacterium sp.,41 to a section of the α-subunit of the heterooctameric proline dehydrogenase (PDH1) from Pirococcus horikoshii,42 and to the N’terminal domain of the chaperone CopZ from Archaeoglobus fulgidus.43
Figure 3c illustrates how an equivalent of the Bfd fold (cyan) is contained within a relatively small portion of the α-subunit of PDH1 (magenta); despite the strong structural conservation there is no significant sequence similarity between the proteins. CopZ is a two-domain protein member of the Fer2-BFD family that binds a Zn2+ and a [2Fe-2S] cluster in its N-terminal domain. Its [2Fe-2S] cluster is bound by four Cys ligands arranged in a C-X1-C-X31-C-X8-CC motif, which includes the conserved C-X1-C arrangement. Pa-Bfd and CopZ share 60% sequence similarity in the stretch flanking the C-X1-C motif (V2-A17 in Bfd; V74-A88 in CopZ-NT). In CopZ-NT, this stretch of sequence forms a β-hairpin that contains iron ligands C75 and C77, which are structurally equivalent to C4 and C6 in Pa-Bfd, and a subsequent α-helix (magenta in Figure 3d). C109 is on a one-turn α-helix (green) in CopZ-NT and therefore is structurally distinct from C38 in Pa-Bfd, which is part of L3. C119, on the other hand, is structurally equivalent to C41 in Pa-Bfd. Consequently, to the best of our knowledge the structure of Pa-Bfd is the first example of a single domain Fer2_BFD protein, and the structure of CopZ-NT appears to be the only example of a multi-domain Fer2_BFD protein, although the structure describes only the 130-residue N’-terminal domain. Taken together, the observations made from sequence and structural alignments indicate that the Bfd fold is a versatile metal-binding structural motif that has been incorporated into a large number of Fer2_BFD proteins and enzymes with diverse function, as well as into enzymes not belonging to this family, such as TSOX and PDH1.
Phosphate stabilizes the Bfd structure
The three Bfd molecules in the asymmetric unit cell, chains G, H and I, exhibit average main chain B-factors 25.8, 64.0 and 29.0 Å2, respectively (Figure 4a). Despite the higher thermal factors and absence of electron density between residues 16 and 33 in chain H (green), the three Bfd chains are structurally similar as is evident from the small Cα RMSD from comparing chain G to chain I (0.24 Å) and to chain H (0.25 Å) (Figure S2). Strong positive Fo – Fc electron density greater than 6σ near chain G was modeled as a phosphate ion coordinated by the side chains of R26, R29 and K46 and, via a crystal contact, by the side chain of K76 from a nearby BfrB (Figure 4b). The shape of the observed electron density along with the fact that phosphate was present in the protein storage buffer and crystallization solution made assignment of phosphate at this site unambiguous. Phosphate likely mediates otherwise repulsive interactions of the R26 (α-2), R29 (α-2) and K46 (α-3) side chains and enables their hydrophobic portions to pack against the Y25 (α-2) side chain and form a network that stabilizes the short α-2 helix. The phosphate-mediated stabilization of α-2 may be critical to the integrity of the Bfd fold and that of the [2Fe-2S] cluster because in its absence α-2 is likely to unfold and create a long loop stretching from the N-terminus of L2 (Ala15) to the C-terminus of L3 (Ala41) (see Figure 3a). The proposed stabilizing role of phosphate is in agreement with three experimental observations: (i) isolation of recombinant Pa-Bfd can only be carried out in phosphate buffer, (ii) attempts to transfer Pa-Bfd into non-phosphate buffers causes gradual loss of the [2Fe-2S] cluster, and (iii) crystals of the Pa-BfrB-Bfd complex can only be obtained if each of the proteins is dissolved in phosphate buffer and if the precipitant contains high phosphate concentrations. Inspection of crystal contacts also supports this idea (Figure 4c): In Bfd chain G (magenta spheres) and chain I (orange spheres) several crystal contacts affecting R26 and R29 contribute to organize α-2. In contrast, chain H (green spheres) does not experience crystal contacts, which is likely the reason why residues 16-33, which comprise the C-terminal of α-1, L2, α-2 and the N-terminus of L3, are disordered. It is therefore likely that the situation observed in chain H most closely represents solution conditions, where a dynamic on-off coordination of phosphate by R26, R29 and K46 prevents large unfolding excursions of α-2, in turn maintaining the integrity of the [2Fe-2S] cluster.
Figure 4.

Phosphate stabilizes the Pa Bfd fold. (a) Main chain average B-factors in Bfd chains G (magenta), H (green) and I (orange); vertical lines highlight the Cys ligands and the gap in the green trace is absent electron density in chain H. (b) Fo-Fc omit map contoured at 6σ (orange mesh) showing the electron density modeled as phosphate coordinated by the side chains of R26, R29 and K46 in Bfd chain G (cyan); the phosphate is also coordinated, via a crystal contact, by the side chain of K76 from a nearby BfrB related by the symmetry operator Y, X, −Z + (001). (c) View of BfrB (gray) and bound Bfd in the asymmetric unit (spheres) showing the crystal contacts (red spheres) experienced by chain G (magenta), H (green) and I (orange); the phosphate bound to chain G is shown in blue spheres. The crystal contacts affecting chains G and H contribute to stabilize short helix α-2 and in the case of chain G, a specific contact from K76 in a nearby BfrB molecule contributes to organize the phosphate ion. In chain H which does not experience crystal contacts, helix α-2 and flanking loops L2 and L3 experience conformational disorder. (d) Plot of per-residue mobility in the Bfd-phosphate complex (chain G). Residue mobility is a normalized mean square fluctuation of the residue center of mass calculated by an elastic network model.44 (e) Plot of the relative change of the mean square fluctuations of Bfd residues upon dissociation of the Bfd-phosphate complex.
To further explore this idea, the structural fluctuations in Pa-Bfd bound to phosphate were compared with the fluctuations in the structure upon removal of phosphate in silico. A coarse-grained normal mode analysis was performed for the phosphate-bound and phosphate-free structures with the aid of the program Vibe,44 which treats protein structures as an elastic network of the center of mass of each residue in the sequence. The calculations suggest that residues C38 (iron ligand), G39 and K40 in loop L2 and G21 in loop L3 exhibit fluctuations larger than other residues in the phosphate-bound structure (Fig. 4d). Note that phosphate, shown at the end of the sequence in the plot, is one of the most kinetically active moieties, which may be indicative of its propensity to be in dynamic on-off equilibrium with Pa-Bfd. Removal of phosphate causes a relatively large increase in the fluctuations of Y25, R26 and R29 in α-2, and A42 and K46 in α-3 (Fig. 4e), consistent with the proposed stabilizing influence of the anion on α-2 (Figure 4-b).
The Pa-BfrB-Bfd interface
A molecule of Bfd binds between two BfrB subunits resulting in the burial of 607 Å2 at the complex interface. The identities of residues participating at the interface and their relative contribution to the buried surface are shown in Figure 5; the contribution of Bfd residues to the total buried surface is plotted in Figure 5a and the contribution of BfrB residues is plotted in Figure 5-b, with residues from subunit A in gray and residues from subunit B in wheat. The symbols on top of each bar indicate that a particular residue is conserved (*) or conservatively replaced (:) in the amino acid sequence alignments shown in Figure S1. It is significant that the majority of residues buried at the complex interface are conserved in the sequences of both proteins because it strongly suggests that the structure of the complex is biologically relevant, and underscores the notion that binding of Bfd to Bfr is a common mechanism for the regulation of cytosolic iron in a variety of Gram negative bacteria.
Figure 5.

The Pa-BfrB-Bfd interface. (a & b) Per-residue plot of surface area buried at the complex interface; contributions from residues in Bfd are shown in cyan and contributions from residues in the A and B subunits of BfrB are shown in wheat and gray, respectively. Conserved residues are denoted by (*) and conservative replacements by (:). (c) View of the complex interface showing Bfd in cyan and subunits A and B of BfrB in wheat and gray, respectively, oxygen in red, nitrogen in blue, sulfur in yellow and iron in orange. The BfrB surface was rendered semi-transparent to show the side chains forming the cleft at the dimer interface. Note the burial of Bfd side chains Y2, L5 and K40 within the cleft, whereas M1 interacts only with subunit A of BfrB via hydrophobic and hydrogen bonding interactions (dotted lines indicate hydrogen bonding interactions). Iron ligands C6 and C41 also participate at the complex interface, placing the [2Fe, 2S] cluster of Bfd in close proximity to the BfrB surface.
A zoomed-in view of the interacting surface (Figure 5c) shows Pa-Bfd (cyan) bound at the interface of two subunits in Pa-BfrB; subunit A is gray and subunit B is wheat. Y2, L5 and K40, 3 of the 4 residues with the largest contributions to the buried Bfd surface, wedge their side chains in a cleft formed at the interface of each subunit dimer in Pa-BfrB. In comparison, M1, the fourth Pa-Bfd residue with the largest contribution to the buried complex interface interacts only with subunit A via hydrophobic and hydrogen bond contacts. The structure of each Pa-BfrB subunit dimer in complex with Pa-Bfd is very similar to the subunit dimer structure of Pa-BfrB alone; the average RMSD from comparing main chain and side chain atoms from Pa-BfrB subunits A and B in the Pa-BfrB-Bfd complex with equivalent subunits in the structure of Pa-BfrB alone is 0.14 Å and 0.67 Å, respectively (see Figure S3). The relatively small re-arrangements on the surface of Pa-BfrB upon binding of Pa-Bfd are illustrated in Figure 6: The view in Figure 6a shows a cleft formed at the interface of subunits A (wheat) and B (gray) in Pa-BfrB alone. Binding of Pa-Bfd (cyan) occurs with the burial of the Y2 and L5 side chains within the cleft and is accompanied by reorientation of the , and side chains on Pa-BfrB, effectively narrowing the cleft to contain the pertinent Pa-Bfd side chains (Figure 6b). These side chain relocations and those affecting are depicted in the view of Figure 6c to illustrate that with the exception of , all the Pa-BfrB side chains that change orientation upon binding form hydrogen bonding interactions with Pa-Bfd.
Figure 6.

Small rearrangements occur on the surface of Pa-BfrB upon binding Pa-Bfd. (a) Surface representation of a cleft formed at the subunit-dimer interface in Pa-BfrB (PDB 3IS7) where Pa-Bfd binds. (b) Binding of Pa-Bfd causes side chain rearrangements in , and which narrow the cleft to accommodate Y2 and L5 from Pa-Bfd. (c) Cartoon representation depicting the structural rearrangements in Pa-BfrB brought about by the binding of Pa-Bfd (cyan). Side chains in unbound Pa-BfrB (green) rearrange to the conformations shown by the side chains in wheat (subunit A) and gray (subunit B) in the Pa-BfrB-Bfd complex. The resultant polar and hydrogen bonding interactions at the complex interface are shown by dashed lines.
Each heme in Bfr is buried within a subunit dimer, placing the heme-iron ~ 18 Å below the Bfr surface and allowing the heme propionates to reach the interior cavity. Although it has been determined that the hemes in Bfr mediate electrons from the surface to the mineral core,10,14 the vast and complex Bfr surface has made it challenging to identify electron transfer paths connecting the surface and the buried heme. The structure of the BfrB-Bfd complex reveals that the edge-to-edge distance between the [2Fe-2S] cluster in Bfd and heme in BfrB is 15.1 Å. With the aid of the program Harlem45 the coordinates of the BfrB-Bfd complex were used to calculate the most probable path for electron transfer, which is likely to proceed from S2 in the iron sulfur cluster of Pa Bfd to a heme vinyl β carbon (CBB) in Pa-BfrB, via conserved residues and (Figure 7a). A model with inside view of Pa-BfrB (Figure 7b) illustrates how and in Pa-BfrB (purple) bridge the iron sulfur cluster of Pa-Bfd located at the complex interface to the heme (green) buried deep within the Pa-BfrB structure. The model also shows how the heme propionates protrude into the interior cavity, suggesting that the iron mineral may be in intimate contact with the heme propionates, thus facilitating electron capture and dissolution in the form of Fe2+.
Figure 7.

Binding of Pa-Bfd to Pa-BfrB places the iron sulfur cluster of Pa-Bfd in an ideal position to transfer electrons to the heme in Pa-BfrB. (a) The best path for electron transfer predicted by the program Harlem is from S2 in Pa-Bfd to heme vinyl carbon CBB in Pa-BfrB, including two non-bonding jumps and and (purple). (b) Inside view of the Pa-BfrB cavity illustrating the putative path of electron transfer across the Pa-BfrB protein shell, from Pa-Bfd (cyan) bound at the Pa-BfrB surface to heme buried below the surface (green) through and (purple).
Functional significance
In the complex, the [2Fe-2S] cluster of Pa-Bfd is in an ideal position to transfer electrons to the heme in Pa-BfrB, an observation that strongly supports the notion that Pa-Bfd promotes the release of Fe2+ from bacterioferritin by mediating electrons from Pa-FPR to Pa-BfrB.10 However, before the model can be firmly established it is necessary to consider that in the previous study efficient Fe2+ release was also observed when Pa-BfrB was reconstituted with Pa-FPR and apo-Pa-Bfd.10 Since the latter is devoid of an iron sulfur cluster, it was suggested that apo-Bfd may function to facilitate electron transfer from Pa-FPR to Pa-BfrB perhaps by recruiting Pa-FPR to the Pa-BfrB surface.10 It is noteworthy, however, that in the previous study apo-Bfd was prepared in-situ by incubating Pa-Bfd with dithionite and the iron chelator 2,2′-bipyridine (bipy), so the resultant solution contained iron and sulfide ions. Their presence could have caused spontaneous reassembly of a [2Fe-2S] cluster in apo-Bfd, or redox reactions that facilitated iron release. Consequently, to understand the role, if any, of apo-Bfd in aiding iron release from Pa-BfrB, it is necessary to prepare, isolate and characterize the apo-protein for subsequent evaluation of its participation in iron release.
Apo-Bfd was prepared by incubating Pa-Bfd in 8 M urea in the presence of the iron chelator HBED at pH 5.5. Chelated iron and sulfide were removed by dialysis while maintaining the apo-protein in an unfolded state and the apo-Bfd was then refolded by dialysis against phosphate buffer. Attempts to refold apo-Bfd by dialysis against a buffer other than phosphate resulted in irreversible precipitation. The molecular mass of isolated apo-Bfd (7,807 ± 1 Da) measured by mass spectrometry is identical to the value calculated from the sequence, including the initiator Met. The UV-vis spectrum of apo-Bfd shows only a 280 nm band and is clearly distinct from the spectrum of Pa-Bfd, which displays ligand-to-metal charge transfer transitions in the visible region (Figure 8a). The far UV CD spectrum of Pa-Bfd, with double minima at 208 and 222 nm, and [θ]222/[θ]208 = R ~ 1.1 (blue in Figure 8b) is typical of α-helical peptides and consistent with the Bfd fold. In comparison, the spectrum of apo-Bfd in phosphate buffer shows minima at 222 and 203 nm, with R = 0.45 (black). The blue shift of the high energy band and decrease in intensity of the 222 nm transition suggest partial loss of α-helical structure46 upon removal of the [2Fe-2S] cluster. If phosphate is removed by dialysis against Tris buffer the CD spectrum of apo-Bfd shows lower [θ]222 and additional blue shift of the high energy transition to 201 nm, with R ~ 0.23 (red), indicating additional loss of structure. Taken together, the observations are in good agreement with a stabilizing influence of phosphate on the Bfd fold and support the notion that apo-Bfd is in dynamic equilibrium between an α-helical and a more disordered structure likely comprised of turns and nascent helices. Assembly of the [2Fe-2S] cluster shifts the equilibrium toward the α-helical fold revealed by the Pa-Bfd structure.
Figure 8.
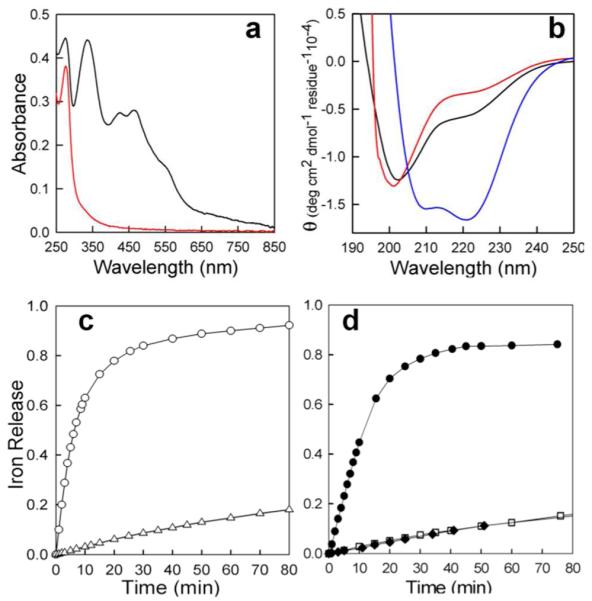
A [2Fe-2S] cluster in Pa-Bfd is necessary to promote Fe2+ mobilization from Pa-BfrB. (a) UV-Vis spectra of Pa-Bfd (black) in 50 mM potassium phosphate pH 7.0, 150 mM NaCl, 5 mM DTT, and apo-Bfd (red) in 200 mM potassium phosphate pH 7.0, 5 mM TCEP. (b) Far UV CD spectra of: (blue) Pa-Bfd in 50 mM potassium phosphate pH 7.0, 4mM NaCl, 0.13 mM DTT showing double minima at 208 and 222 nm; (black) apo-Bfd in 200 mM potassium phosphate pH 7.0, 1 mM TCEP with a minimum at 203 nm and a shoulder at 222 nm; (red) apo-Bfd in 200 mM Tris, pH 7.0 120 mM NaCl, 1 mM TCEP with a minimum at 201 nm and a shoulder at 223 nm. (c) Time-dependent increase of normalized A523 upon addition of excess NADPH (final concentration 1.5 mM) to 20 mM phosphate buffer (pH 7.6) containing: (Δ) Pa BfrB (0.25 μM) and Pa FPR (10 μM ), and (○) Pa BfrB (0.25 μM), Pa-FPR (10 μM) and Pa-Bfd (10 M). (d) Time-dependent increase of normalized A523 upon addition of excess NADPH to a solution containing: (□) Pa-BfrB (0.25 μM), Pa-FPR (10 μM) and apo-Pa-Bfd (10 μM ); (•) Pa-BfrB (0.25 μM), Pa-FPR (10 μM), apo-Pa-Bfd (10 μM ), (NH4)2Fe(SO4)2 (20 μM) and Na2S (20 μM ); and (◆) Pa-BfrB (0.25 μM), Pa-FPR (10 μM), (NH4)2Fe(SO4)2 (20 μM) and Na2S (20 μM). A523 was normalized to the absorbance value expected upon removal of all 600 iron ions in Pa-BfrB.
Iron release from Pa-BfrB was studied as reported before10 by following the time-dependent formation of [Fe(bipy)3]2+ at 523 nm after addition of excess NADPH to a cuvette containing the appropriate proteins and excess bipy. Addition of NADPH to a mixture of BfrB and FPR causes negligible iron release (Δ in Figure 8c), whereas the presence of Pa-Bfd promotes rapid and complete release of iron from Pa-BfrB (○). In contrast, iron release in the presence of apo-Bfd is sluggish (□ in Figure 8d), demonstrating that apo-Bfd does not promote the release of iron from BfrB. These observations suggest that in the previous study, when apo-Bfd was prepared in situ, iron and sulfide ions may have assembled into a Bfd-bound iron sulfur cluster, or into non-protein clusters capable of reducing BfrB-iron. In order to emulate the conditions resulting from preparing apo-Bfd in situ, a cuvette containing a solution of apo-Bfd, Pa-BfrB and Pa-FPR was treated with 2 equivalents of Fe2+, 2 equivalents of S2− and excess bipy. Addition of NADPH promoted rapid iron release from Pa-BfrB (• in Fig. 8d), whereas iron release upon addition of NADPH to a solution of Pa-BfrB, Pa-FPR, Fe2+ and S2− in the same concentration but lacking apo-Bfd is sluggish (◆ in Figure 8d). These observations suggest that Fe2+ and S2− can assemble into apo-Bfd to enable reduction of the ferric core mineral and release of Fe2+ and are consistent with a previous report showing that a [2Fe-2S] cluster can be assembled into apo-Bfd in the presence of Fe2+ and S2−.19
We have also obtained additional evidence demonstrating the participation of the [2Fe-2S] cluster by monitoring its oxidation state during the reaction with Pa BfrB in the absence of reductant (NADPH and FPR): A 30 μM solution of Pa-Bfd in 20 mM phosphate buffer pH 7.6 was placed in a cuvette (black trace in Figure 9a). Treating the Pa-Bfd solution with 0.8 equivalents of sodium dithionite resulted in the nearly featureless UV-vis spectrum characteristic of a reduced [2Fe-2S] cluster (red trace). The spectrum remained unchanged for the 15 min it was monitored before a small volume of a solution containing Pa-BfrB reconstituted with 590 Fe atoms/BfrB and a small volume of EDTA solution were added to produce a final Pa-BfrB concentration of 0.08 μM and final EDTA concentration of 0.1 mM. The EDTA was added to prevent precipitation of ferrous phosphate, which also causes protein precipitation and drift of the spectral baseline. The spectral changes brought by the addition of Pa-BfrB are shown in Figure 9b: The red trace corresponds to reduced Pa-Bfd. The blue trace, which was obtained 20 s after the addition Pa-BfrB, features a Soret band at 424 nm indicating that the heme in Pa-BfrB is reduced. The magenta, green and black traces were obtained 1 min, 3 min and 5 min, respectively after the addition of Pa-BfrB; note that the intensity of peaks characteristic of Pa-Bfd (334 nm and 465 nm) increase and reach their maximum intensity at ~5 min, with concomitant shift of the Soret band to 418 nm, which indicates oxidation of the heme in BfrB. To more clearly visualize the oxidation state of the [2Fe-2S] cluster of Pa-Bfd in the resultant solution, a difference spectrum was obtained by subtracting a spectrum of 0.08 μM Pa-BfrB from the black trace (5 min) in Figure 9b. The difference spectrum (red in Figure 9c) is virtually identical to the spectrum obtained from the solution containing 30 μM oxidized Pa-Bfd (black trace in Figures 9a and 9c). To correlate these observations to iron release from Pa-BfrB, a similar experiment was conducted, except that the solution containing reduced Pa-Bfd was made 3 mM in bipy immediately prior to the addition of Pa-BfrB (no EDTA was needed). This allowed us to observe the time dependent-formation of Fe2+ detected at 523 nm, in the form of [Fe(bipy)3]2+ (Figure 9-d). Note that the maximum concentration of [Fe(bipy)3]2+ formed is ~24 μM, a value that is equivalent to the concentration of reduced Pa-Bfd obtained upon addition of 0.8 equivalents of dithionite to the solution 30 μM in Pa-Bfd. Clearly, these observations are in good agreement with the notion that the heme in Pa BfrB mediates electrons between the [2Fe-2S] cluster in Pa Bfd and the iron core in Pa BfrB to promote release of Fe2+.
Figure 9.

(a) (black) UV-Vis spectra of oxidized 30 μM Pa-Bfd in 20 mM potassium phosphate pH 7.6. (red) Spectrum of reduced Pa-Bfd obtained upon addition of 0.8 equivalents of sodium dithionite relative to oxidized Pa-Bfd. (b) Spectral changes upon addition of Pa-BfrB (0.08 μM final concentration) reconstituted with 590 Fe atoms/BfrB to reduced Pa-Bfd: (red) spectrum prior to the addition of Pa-BfrB; (blue) 20 s, (magenta) 1 min, (green) 3 min, and (black) 5 min after the addition of Pa-BfrB. An increase in the intensity at 334 and 465 nm indicates reoxidation of Pa-Bfd. (c) (red) difference spectrum obtained from subtracting a spectrum obtained from 0.08 μM Pa-BfrB from the black trace spectrum (5 min) in (b). The difference spectrum is nearly identical to the spectrum of oxidized 30 μM (black trace). The addition of EDTA final concentration 0.1 mM immediately prior to the addition of Pa-BfrB was necessary to prevent formation of insoluble ferrous phosphate, which caused protein precipitation and drift in the baseline of the spectra. (d) Time-dependent formation of [Fe(bipy)3]2+ upon addition of excess bipy (3 mM) and Pa-BfrB (0.08 μM) to a solution of Pa-Bfd reduced as in (a). The maximum concentration of [Fe(bipy)3]2+ formed (normalized to the initial volume) is ~24 μM and equivalent to the concentration of Pa-Bfd obtained by reducing 30 μM Pa-Bfd with 0.8 equivalents of dithionite.
Concluding remarks
Although the recovery of Fe2+ from the ferritin cavity requires that electrons traverse the protein shell and reach the mineral, it is highly unlikely that ferritin-mineral is indiscriminately reduced in vivo. The delivery of electrons to eukaryotic ferritins from NADH or NADPH is thought to be carried out by flavin- or xanthine- containing oxidoreducateses.47 The identity of these enzymes, however, remains unknown. For this reason, studies directed at probing iron release from ferritin-like molecules have utilized a wide range of reductants, including dithionite, thiols, ascorbate, diphenols dihydroflavins and diphenols, to drive the release of iron from ferritin and ferritin-like molecules.7,14,48-51 Although these studies have provided important insights, the significance of molecular recognition and protein-protein interactions in the control of iron release from ferritin and ferritin-like molecules has remained mysterious. The identification of bfd genes contiguous to bfr genes in E. coli11,18 and in P. aeruginosa10,19 and their differential regulation under conditions of low-iron stress20,21 provided the impetus to demonstrate that Pa-Bfd enables iron release from Pa-BfrB.10 The manner of Bfd participation in the process, however, was not clear since Pa-Bfd, or its apo-form prepared in situ, were found to accelerate iron release. The highly specific Pa-BfrB-Bfd interface reported here strongly supports the notion that in vivo Pa-Bfd mediates electrons to Pa-BfrB. In addition, experiments with Pa-Bfd and its apo-form allowed us to unambiguously demonstrate that only Pa-Bfd promotes the release of iron from Pa-BfrB. Consequently, the structure of the Pa-BfrB-Bfd complex enables, for the first time, structural insight into the control exerted by molecular recognition on the mobilization of iron from a ferritin-like molecule and the electron paths that enable electrons to traverse the Bfr shell and reduce ferric mineral in the Bfr cavity (Figure 7). Given that iron storage proteins in bacteria are essential for the survival of pathogens in the host,15 the insights obtained from the Pa-BfrB-Bfd complex and its function in maintaining bacterial iron homeostasis, may help in the future development of therapeutic strategies to treat bacterial infections. In this context, it is important that residues at the Pa-BfrB-Bfd interface are conserved in Bfr and Bfd sequences from a number of bacteria (Figure 5 and Figure S1). Moreover, the bfr and bfd genes coding for the Bfrs and Bfds aligned in Figure S1 are adjacent to one another (Table S1), suggesting that the clustering of the bfd (PA3531) and bfrB (PA3530) genes in P. aeruginosa is common to a wide number of bacterial species. Consequently, the specific recognition and binding that is necessary to release iron from bacterioferritin is likely a mechanism of widespread significance to the understanding of bacterial iron homeostasis.
Supplementary Material
ACKNOWLEDGMENTS
This study was supported by grants from the National Science Foundation (M.R., MCB-1158469 and MCB 0818488) and a grant from the National Institutes of Health (I.A.V., 8 P20 GM103420-10). Use of IMCA-CAT beamline 17-ID at the Advanced Photon Source was supported by the companies of the Industrial Macromolecular Crystallography Association through a contract with the Hauptman-Woodward Medical Research Institute. Use of the Advanced Photon Source was supported by the U.S. Department of Energy, Office of Science, Office of Basic Energy Sciences, under Contract No. DE-AC02-06CH11357. Use of the KU COBRE-PSF Protein Structure Laboratory was supported by grants from the National Center for Research Resources (5P20RR017708) and the National Institute of General Medical Sciences (8 P20 GM103420-10) from the National Institutes of Health.
Footnotes
Coordinates and structure factors have been deposited to the Protein Databank with accession code 4E6K.
SUPPORTING INFORMATION AVAILABLE
Amino acid sequence alignments of Bfd and Bfr sequences; superposition of Pa-Bfd chains in the asymmetric cell unit of the Pa-BfrB-Bfd complex; RMSD plot comparing Pa-BfrB subunits in the Pa-BfrB-Bfd complex with equivalent subunits in Pa-BfrB alone; a table listing bacteria where bfr and bfd genes are clustered. This material is available free of charge via the Internet at http://pubs.acs.org.
REFERENCES
- (1).Theil EC, Goss D. J. Chem. Rev. 2009;109:4568–4579. doi: 10.1021/cr900052g. [DOI] [PMC free article] [PubMed] [Google Scholar]
- (2).Andrews SC, Robinson AK, Rodríguez-Quiñones F. FEMS Microbiology Reviews. 2003;27:215–237. doi: 10.1016/S0168-6445(03)00055-X. [DOI] [PubMed] [Google Scholar]
- (3).Neilands JB. Biol. Met. 1991;4:1–6. doi: 10.1007/BF01135550. [DOI] [PubMed] [Google Scholar]
- (4).Andrews SC. Biochim. et Biophys. Acta. 2010;1800:691–705. doi: 10.1016/j.bbagen.2010.05.010. [DOI] [PubMed] [Google Scholar]
- (5).Theil EC. Curr. Opin. Chem. Biol. 2011;15:304–311. doi: 10.1016/j.cbpa.2011.01.004. [DOI] [PMC free article] [PubMed] [Google Scholar]
- (6).Liu X, Theil EC. Acc. Chem. Res. 2005;38:167–175. doi: 10.1021/ar0302336. [DOI] [PubMed] [Google Scholar]
- (7).Tosha T, Behera RK, Ng HL, Bhattasali O, Alber T, Theil EC. J Biol Chem. 2012;287:13016–13025. doi: 10.1074/jbc.M111.332734. [DOI] [PMC free article] [PubMed] [Google Scholar]
- (8).Bertini I, Lalli D, Mangani S, Pozzi C, Rosa C, Theil EC, Turano P. J Am Chem Soc. 2012;134:6169–6176. doi: 10.1021/ja210084n. [DOI] [PMC free article] [PubMed] [Google Scholar]
- (9).Turano P, Lalli D, Felli IC, Theil EC, Bertinin I. Proc Natl Acad Sci U S A. 2010;107:545–550. doi: 10.1073/pnas.0908082106. [DOI] [PMC free article] [PubMed] [Google Scholar]
- (10).Weeratunga S, Gee CE, Lovell S, Zeng Y, Woodin CL, Rivera M. Biochemistry. 2009;48:7420–7431. doi: 10.1021/bi900561a. [DOI] [PMC free article] [PubMed] [Google Scholar]
- (11).Garg RP, Vargo CJ, Cui X, Kurtz DMJ. Biochemistry. 1996;35:6297–6301. doi: 10.1021/bi9600862. [DOI] [PubMed] [Google Scholar]
- (12).Quail MA, Jordan P, Grogan JM, Butt JN, Lutz M, Thomson AJ, Andrews SC, Guest JR. Biochem. Biophys. Res. Commun. 1996;229:635–642. doi: 10.1006/bbrc.1996.1856. [DOI] [PubMed] [Google Scholar]
- (13).Andrews SC, Le Brun NE, Barynin V, Thomson AJ, Moore GR, Guest JR, Harrison PM. J Biol Chem. 1995;270:23268–23274. doi: 10.1074/jbc.270.40.23268. [DOI] [PubMed] [Google Scholar]
- (14).Yasmin S, Andrews SC, Moore GR, Le Brun NE. J. Biol. Chem. 2011;286:3473–3483. doi: 10.1074/jbc.M110.175034. [DOI] [PMC free article] [PubMed] [Google Scholar]
- (15).Reddy PV, Puri RV, Khera A, Tyagi AK. J Bacteriol. 2012;194:567–575. doi: 10.1128/JB.05553-11. [DOI] [PMC free article] [PubMed] [Google Scholar]
- (16).Palmer KL, Mashburn LM, Singh PK, Whiteley M. J. Bacteriol. 2005;187:5267–5277. doi: 10.1128/JB.187.15.5267-5277.2005. [DOI] [PMC free article] [PubMed] [Google Scholar]
- (17).Pier GB. Curr. Opin. Microbiol. 2002;5:81–86. doi: 10.1016/s1369-5274(02)00290-4. [DOI] [PubMed] [Google Scholar]
- (18).Andrews SC, Harrison PM, Guest JR. J. Bacteriol. 1989;171:3940–3947. doi: 10.1128/jb.171.7.3940-3947.1989. [DOI] [PMC free article] [PubMed] [Google Scholar]
- (19).Wang A, Zeng Y, Han H, Weeratunga S, Morgan BN, Moënne-Loccoz P, Schönbrunn E, Rivera M. Biochemistry. 2007;46:12198–12211. doi: 10.1021/bi7013135. [DOI] [PubMed] [Google Scholar]
- (20).Ochsner UA, Wilderman PJ, Vasil AI, Vasil ML. Mol. Microbiol. 2002;45:1277–1287. doi: 10.1046/j.1365-2958.2002.03084.x. [DOI] [PubMed] [Google Scholar]
- (21).Palma M, Worgall S, Quadri LEN. Arch. Microbiol. 2003;180:374–379. doi: 10.1007/s00203-003-0602-z. [DOI] [PubMed] [Google Scholar]
- (22).Wang A, Rodríguez JC, Han H, Schönbrunn E, Rivera M. Biochemistry. 2008;47:8080–8093. doi: 10.1021/bi8007356. [DOI] [PMC free article] [PubMed] [Google Scholar]
- (23).Moore GR, Kadir HA, Al-Massad K, Le Brun NE, Thomson AJ, Greenwood C, Keen JN, Findlay JBC. Biochem J. 1994;304:493–497. doi: 10.1042/bj3040493. [DOI] [PMC free article] [PubMed] [Google Scholar]
- (24).Ma J-F, Ochsner UA, Klotz MG, Nanayakkara VK, Howell ML, Johnson Z, Posey JE, Vasil ML, Monaco JJ, Hassett DJ. J. Bacteriol. 1999;181:3730–3742. doi: 10.1128/jb.181.12.3730-3742.1999. [DOI] [PMC free article] [PubMed] [Google Scholar]
- (25).Weeratunga S, Lovell S, Yao H, Battaile KP, Fischer CJ, Gee CE, Rivera M. Biochemistry. 2010;49:1160–1175. doi: 10.1021/bi9015204. [DOI] [PMC free article] [PubMed] [Google Scholar]
- (26).Yao H, Jepkorir G, Lovell S, Nama PV, Weeratunga SK, Battaille KP, Rivera M. Biochemistry. 2011;50:5236–5248. doi: 10.1021/bi2004119. [DOI] [PMC free article] [PubMed] [Google Scholar]
- (27).Kabsch W. Journal of Applied Crystallography. 1988;21:67–72. [Google Scholar]
- (28).Evans PR. Acta Cryst. 2011;D67:282–292. doi: 10.1107/S090744491003982X. [DOI] [PMC free article] [PubMed] [Google Scholar]
- (29).Matthews BW. J. Mol. Biol. 1968;33:491–497. doi: 10.1016/0022-2836(68)90205-2. [DOI] [PubMed] [Google Scholar]
- (30).McCoy AJ, Grosse-Kunstleve RW, Adams PD, Winn MD, Storoni LC, Read RJ. J. Appl. Cryst. 2007;40:658–674. doi: 10.1107/S0021889807021206. [DOI] [PMC free article] [PubMed] [Google Scholar]
- (31).Adams PD, Afonine PV, Brunkózci G, Chen VB, Davis IW, Echols N, Headd JJ, Hung L-W, Kapral GJ, Grosse-Kunstleve RW, McCoy AJ, Moriarty NW, Oeffner R, Read RJ, Richardson DC, Richardson JS, Terwilliger TC, Zwart PH. Acta Cryst. 2010;D66 doi: 10.1107/S0907444909052925. [DOI] [PMC free article] [PubMed] [Google Scholar]
- (32).Emsley P, Lohkamp B, Scott WG, Cowan K. Acta Cryst. 2010;D66:12–21. doi: 10.1107/S0907444910007493. [DOI] [PMC free article] [PubMed] [Google Scholar]
- (33).Chen VB, Arendall W. B. r., Headd JJ, Keedy DA, Immormino RM, Kapral GJ, Murray LW, Richardson JS, Richardson DC. Acta Cryst. D. 2010;66:12–21. doi: 10.1107/S0907444909042073. [DOI] [PMC free article] [PubMed] [Google Scholar]
- (34).Liu H-L, Zhou H-N, Xing W-M, Zhao J-F, Li S-X, Huang J-F, Bi R-C. FEBS Lett. 2004;573:93–98. doi: 10.1016/j.febslet.2004.07.054. [DOI] [PubMed] [Google Scholar]
- (35).Swartz L, Kuchinskas M, Li H, Poulos TL, Lanzilotta WN. Biochemistry. 2006;45:4421–4428. doi: 10.1021/bi060146w. [DOI] [PubMed] [Google Scholar]
- (36).Macedo S, Romão CV, Mitchell E, Matias PM, Liu MY, Xavier AV, LeGall J, Teixeira M, Lindley P, Carrondo MA. Nat. Struct. Biol. 2003;10:285–290. doi: 10.1038/nsb909. [DOI] [PubMed] [Google Scholar]
- (37).Punta M, Coggill PC, Eberhardt RY, Mistry J, Tate J, Boursnell C, Pang N, Forslund K, Ceric G, Clements J, Heger A, Holm L, Sonnhammer ELL, Eddy SR, Bateman A, Finn RD. Nucleic Acids Res. 2012;40:D290–D301. doi: 10.1093/nar/gkr1065. [DOI] [PMC free article] [PubMed] [Google Scholar]
- (38).Roy A, Yang J, Zhang Y. Nucleic Acids Res. 2012 [Google Scholar]
- (39).Holm L, Rosenström P. Nucleic Acids Res. 2010;38:W545–W549. doi: 10.1093/nar/gkq366. [DOI] [PMC free article] [PubMed] [Google Scholar]
- (40).Krissinel E, Henrick K. Acta Cryst. 2004;D60:2256–2268. doi: 10.1107/S0907444904026460. [DOI] [PubMed] [Google Scholar]
- (41).Ida K, Tomotaka M, Suzuki H. Biochem. Biophys. Res. Commun. 2005;333:359–366. doi: 10.1016/j.bbrc.2005.05.116. [DOI] [PubMed] [Google Scholar]
- (42).Tsuge H, Kawakami R, Sakuraba H, Ago H, Miyano M, Aki K, Katunuma N, Ohshima T. J. Biol. Chem. 2005;280:31045–31049. doi: 10.1074/jbc.C500234200. [DOI] [PubMed] [Google Scholar]
- (43).Sazinsky MH, LeMoine B, Orofino M, Davydov R, Bencze KZ, Stemmler TL, Hoffman BM, Argüello JM, Rosenzweig AC. J. Biol. Chem. 2007;282:25950–25959. doi: 10.1074/jbc.M703311200. [DOI] [PMC free article] [PubMed] [Google Scholar]
- (44).Ruvinsky AM, Vakser IA. J Chem Phys. 2010;133:155101. doi: 10.1063/1.3498743. [DOI] [PMC free article] [PubMed] [Google Scholar]
- (45).Beratan DN, Onuchic JN, Winkler JR, Gray HB. Science. 1992;258:1740–1741. doi: 10.1126/science.1334572. [DOI] [PubMed] [Google Scholar]
- (46).Reiner A, Wildermann D, Fischer G, Kiefhaber T. J. Am. Chem. Soc. 2008;130:8079–8084. doi: 10.1021/ja8015044. [DOI] [PubMed] [Google Scholar]
- (47).Topham R, Goger M, Pearce K, Schultz P. Biochem J. 1989;261:137–143. doi: 10.1042/bj2610137. [DOI] [PMC free article] [PubMed] [Google Scholar]
- (48).Jones T, Spencer R, Walsh C. Biochemistry. 1978;17:4011–4017. doi: 10.1021/bi00612a021. [DOI] [PubMed] [Google Scholar]
- (49).Richards TD, Pitts KR, Watt GD. J. Inorg. Biochem. 1996;61:1–13. doi: 10.1016/0162-0134(95)00029-1. [DOI] [PubMed] [Google Scholar]
- (50).Funk F, Lenders JP, Crichton RR, Schneider W. Eur. J. Biochem. 1985;152:167–172. doi: 10.1111/j.1432-1033.1985.tb09177.x. [DOI] [PubMed] [Google Scholar]
- (51).Takagi H, Shi D, Ha Y, Allewell NM, Theil EC. J. Biol. Chem. 1998;273:18685–18688. doi: 10.1074/jbc.273.30.18685. [DOI] [PubMed] [Google Scholar]
- (52).Evans PR. Acta Crystallogr D Biol Crystallogr. 2011;67:282–292. doi: 10.1107/S090744491003982X. [DOI] [PMC free article] [PubMed] [Google Scholar]
- (53).Evans P. Acta Crystallogr D Biol Crystallogr. 2006;62:72–82. doi: 10.1107/S0907444905036693. [DOI] [PubMed] [Google Scholar]
- (54).Diederichs K, Karplus PA. Nat Struct Biol. 1997;4:269–275. doi: 10.1038/nsb0497-269. [DOI] [PubMed] [Google Scholar]
- (55).Weiss MS. Journal of Applied Crystallography. 2001;34:130–135. [Google Scholar]
Associated Data
This section collects any data citations, data availability statements, or supplementary materials included in this article.