

Abstract
Background
Newborn screening for deficiency in the lysosomal enzymes that cause Fabry, Gaucher, Krabbe, Niemann–Pick A/B, and Pompe diseases is warranted because treatment for these syndromes is now available or anticipated in the near feature. We describe a multiplex screening method for all five lysosomal enzymes that uses newborn-screening cards containing dried blood spots as the enzyme source.
Methods
We used a cassette of substrates and internal standards to directly quantify the enzymatic activities, and tandem mass spectrometry for enzymatic product detection. Rehydrated dried blood spots were incubated with the enzyme substrates. We used liquid-liquid extraction followed by solid-phase extraction with silica gel to remove buffer components. Acarbose served as inhibitor of an interfering acid α-glucosidase present in neutrophils, which allowed the lysosomal enzyme implicated in Pompe disease to be selectively analyzed.
Results
We analyzed dried blood spots from 5 patients with Gaucher, 5 with Niemann–Pick A/B, 11 with Pompe, 5 with Fabry, and 12 with Krabbe disease, and in all cases the enzyme activities were below the minimum activities measured in a collection of heterozygous carriers and healthy noncarrier individuals. The enzyme activities measured in 5–9 heterozygous carriers were approximately one-half those measured with 15–32 healthy individuals, but there was partial overlap of each condition between the data sets for carriers and healthy individuals.
Conclusion
For all five diseases, the affected individuals were detected. The assay can be readily automated, and the anticipated reagent and supply costs are well within the budget limits of newborn-screening centers.
The application of mass spectrometry in disease diagnostics is rapidly advancing. Major applications include (a) quantification of metabolites in dried blood spots (DBS)6 by tandem mass spectrometry (1); (b) identification and quantification of protein biomarkers in serum by surface-enhanced laser desorption/ionization mass spectrometry (2); (c) analysis of PCR-amplified DNA by MassArray to identify mutated genes (3); and (d) quantification of enzyme activities in cell lysates by affinity capture/elution electrospray ionization mass spectrometry (4). Among these applications, only the implementation of tandem mass spectrometry for the detection of inborn errors of metabolism in DBS has become routine clinical practice (5, 6).
The lysosomal storage diseases are a group of disorders that affect both somatic organs and the central nervous system. Depending on the disorder, they can manifest from birth to adulthood. Until recently, there has been minimal therapeutic intervention available to alter the natural course of the disorders, but with the recent availability of commercial preparations of recombinant enzymes, selective lysosomal disorders are now amenable to therapeutic intervention (7–9). There is excellent documentation that enzyme replacement therapy for Gaucher disease [acid β-glucocerebrosidase (ABG) deficiency] and Fabry disease [acid α-galactosidase A (GLA) deficiency] may alter the natural progression of the disorders and improve the clinical phenotype. Clinical trials are currently underway for Hurler syndrome and Pompe disease [lysosomal acid α-glucosidase (GAA) deficiency], disorders that manifest primarily in infancy (10). If these disorders could be detected before the onset of clinical symptoms, affected individuals would likely benefit from enzyme replacement therapy. A similar scenario is likely to evolve for Niemann–Pick disease, type A and B [acid sphingomyelinase (ASM) deficiency]. For Krabbe disease [galactocerebroside β-galactosidase (GALC) deficiency], there is compelling evidence that presymptomatic recognition and bone marrow transplantation may prevent the neurologic degeneration associated with this disorder. Thus, there is a growing consensus for development of newborn-screening methods to detect these disorders before the onset of clinical symptoms so that therapeutic interventions can be initiated.
In this report we show that it is possible to incubate rehydrated DBS from newborn-screening cards with buffer containing substrates for five lysosomal enzymes and to use tandem mass spectrometry for the multiplex detection of all five enzymatic products that are relevant to the diagnosis of Fabry, Gaucher, Krabbe, Niemann–Pick, and Pompe diseases. Our assay has the potential to allow screening programs to expand their coverage to include selected lysosomal storage disorders with only a minimal increase in cost and effort.
Materials and Methods
Materials
All ceramides and glycosylceramides were from Avanti Polar Lipids. The preparation of substrates (S) and internal standards (IS) for the GAA and GLA assays (GAA-S, GAA-IS, GLA-S, and GLA-IS; see Fig. 1) is described in the Data Supplement that accompanies the online version of this article at http://www.clinchem.org/content/vol50/issue10/. The compounds are available from the authors. Acarbose was from Toronto Research Chemicals, Inc. Recombinant GAA was a gift from Dr. J. Keutzer (Genzyme, Inc., Boston, MA). Polymorphonuclear leukocyte (PMN) lysate (stored at −20 °C) was prepared by extracting PMNs from purified human blood (11) with buffer containing 50 mmol/L HEPES (pH 7.5), 150 mmol/L NaCl, 10 g/L Triton X-100, 100 mL/L glycerol, 10 mmol/L MgCl2, 1 mmol/L phenylmethylsulfonyl fluoride, 1 mmol/L Na3VO4, 25 mmol/L NaF, 0.5 mmol/L p-nitrophenyl phosphate, 5 mmol/L glycerophosphate, 2 mmol/L EDTA, 2 mmol/L EGTA, 10 g/L aprotinin, 10 g/L pepstatin, and 10 g/L leupeptin. All experiments with DBS were conducted in compliance with Institutional Review Board review. DBS were kept at ambient temperature during shipment (<10 days) and then stored at 4 °C or −20 °C, as noted in the figure legends, in zip-lock plastic bags (one sealed bag inside of a second sealed bag). All affected patients had been diagnosed previously with established clinical and biochemical procedures. DBS from nonaffected individuals were obtained from adults (18 –55 years of age) and infants (3rd to 15th day postpartum). The age, gender, and date of DBS collection for all affected patients are listed in Table 2 of the online Data Supplement, as are the enzyme activity values.
Fig. 1. Substrates, products, and internal standards for the five lysosomal enzyme assays.

The masses of the products and internal standards are indicated. The ceramide products and internal standards ASM-P, ASM-IS, GALC-P, GALC-IS, ABG-P, and ABG-IS undergo CID to give the common imminium ion shown (m/z = 264). GLA-P, GLA-IS, GAA-P, and GAA-IS undergo neutral-loss CID to give four different secondary ammonium ions. Enzymatic reactions with DBS are shown by solid arrows, and CID is shown by dashed arrows.
ENZYME ASSAYS USING 2-mm DBS
We first performed the multiplex enzyme assay using one 2-mm DBS for each of the separate enzymatic reaction tubes; thus, five 2-mm DBS were needed to assay the five enzymes. Assays in which a single 5-mm DBS was extracted and distributed into the five separate enzyme reaction tubes will be discussed later.
Preparation of solutions
All solvent manipulations were carried out with pipettors (Pipetman; Rainin). Stock solutions of substrates, internal standards, and products (P) were prepared and stored in Teflon-septum-lined screw cap vials at −20 °C [3 mmol/L for ABG-S, ASM-S, and GALC-S in methanol; 10 mmol/L for GLA-S and GAA-S in methanol; 4 mmol/L for ABG-IS, ASM-IS, and GALC-IS in methanol and then diluted to 0.05 mmol/L in methanol; 10 mmol/L for GLA-IS and GAA-IS in methanol and then diluted to 0.1 mmol/L with H2O–methanol (2:1 by volume)].
To prepare the ASM assay solution, we added 200 μL of 3 mmol/L ASM-S solution and 480 μL of 0.05 mmol/L ASM-IS solution to a 5-mL vial. The solvent was removed in a desiccator attached to a vacuum pump to give a white residue. To the residue we added 15 μL of 120 g/L sodium taurocholate in water. The vial was vortex-mixed until all of the residue was dissolved; we then added 2.985 mL of 0.6 mol/L sodium acetate buffer, pH 5.5. The vial was vortex-mixed again, and any emulsion was broken by centrifugation. The final stock assay solution contained 0.2 mmol/L substrate, 8 μmol/L internal standard, 0.6 g/L sodium taurocholate, and 0.6 mol/L sodium acetate, pH 5.5. This assay cocktail, as well as all other assay cocktails, was stored at −20 °C and could undergo multiple freeze–thaw cycles without effect.
To prepare the GALC assay solution, we added 200 μL of 3 mmol/L GALC-S stock solution and 240 μL of 0.05 mmol/L GALC-IS solution to a 5-mL vial. The solvent was removed in a desiccator attached to a vacuum pump to give a white residue. To this residue we added 240 μL of 120 g/L sodium taurocholate and 12 g/L oleic acid (Aldrich) in water. The vial was vortex-mixed until the residue had dissolved; we then added 2.76 mL of 0.2 mol/L citrate-phosphate buffer, pH 4.5 (made by dissolving NaH2PO4 monohydrate in water to 0.2 mol/L, adding trisodium citrate to 0.1 mol/L, and adjusting to pH 4.5 with 6 mol/L HCl). The vial was vortex-mixed again, and any emulsion was broken by centrifugation. The final stock assay solution contained 0.2 mmol/L substrate, 4 μmol/L internal standard, 9.6 g/L sodium taurocholate, 0.96 g/L oleic acid, and 0.18 mol/L citrate-phosphate, pH 4.5.
To prepare the ABG assay solution, we added 200 μL of 3 mmol/L ABG-S solution and 480 μL of 0.05 mmol/L ABG-IS solution to a 5-mL vial. Solvent was removed in a desiccator attached to a vacuum pump to give a white residue. To the residue we added 240 μL of 120 g/L sodium taurocholate in water. The vial was vortex-mixed until all residue dissolved; we then added 2.76 mL of 0.4 mol/L citrate-phosphate buffer, pH 5.1. The vial was vortex-mixed again, and any emulsion was broken by centrifugation. The final stock assay solution contained 0.2 mmol/L substrate, 8 μmol/L internal standard, 9.6 g/L sodium taurocholate, and 0.37 mol/L citrate-phosphate, pH 5.1.
To prepare the GLA assay solution, we added 300 μL of 10 mmol/L GLA-S solution and 120 μL of 0.1 mmol/L GLA-IS solution to a 5-mL vial. The solvent was removed in a desiccator attached to a vacuum pump to give an oily residue. To the residue we added 15 μL of 120 g/L sodium taurocholate in water (cat. no. 861960; Aldrich). The vial was vortex-mixed until the residue dissolved; we then added 105 μL of 1 mol/L N-acetylgalactosamine and 1.38 mL of 0.4 mol/L sodium acetate buffer, pH 4.6. The vial was again vortex-mixed, and any emulsion was broken by centrifugation. The final assay stock solution contained 2.0 mmol/L substrate, 8 μmol/L internal standard, 1.2 g/L sodium taurocholate, 70 mmol/L N-acetyl-galactosamine, and 0.37 mol/L sodium acetate, pH 4.6.
To prepare the GAA assay solution, we added 120 μL of 10 mmol/L GAA-S solution, 120 μL of 0.1 mmol/L GAA-IS solution, 30 μL of 8 mmol/L acarbose in water (cat. no. A123500; Toronto Research Chemical, Inc.), and 1.8 μL of Triton X-100 to a 5-mL vial. The solvent was removed in a desiccator attached to a vacuum pump to give an oily residue. To the residue we added 3 mL of 0.2 mol/L citrate-phosphate buffer, pH 4.0. The vial was vortex-mixed until the residue was dissolved, and any emulsion was broken by centrifugation. The final stock assay solution contained 0.2 mmol/L substrate, 4 μmol/L internal standard, 0.6 g/L Triton X-100, 80 μmol/L acarbose, and 0.2 mol/L citrate-phosphate, pH 4.2.
Incubations
Aliquots (25 μL for ASM, GALC, ABG, and GAA; 12.5 μL for GLA) of the assay solutions (see above) were placed in individual 1.7-mL polypropylene Eppendorf tubes. To each tube we added a 2-mm-diameter DBS; we then capped the tubes and centrifuged them at 5000g (desktop centrifuge) for ~ 5–10 s to ensure that all liquid in each tube was at the bottom. Tubes were incubated for 20 –24 h at 37 °C with orbital shaking (150 rpm) in a thermostated air shaker.
Work up
After the desired incubation period, we added 100 μL of methanol–CHCl3 (2:1 by volume) to each tube except the GALC tube, and the liquid in each tube was mixed by aspiration five times with a Pipetman. The solutions from all tubes were combined in the GALC assay tube and mixed by aspiration five times with the Pipetman. To this tube we added 400 μL of CHCl3 followed by 400 μL of H2O (house deionized water). The tube was centrifuged at 5000g for 2 min in a desktop centrifuge.
The following steps can also be done in individual tubes or with a 96-well filter plate. An aliquot (300 μL) of the bottom layer was removed with a Pipetman and transferred directly to a glass-wool-plugged 1-mL Pipetman tip that was filled with silica gel (90 –110 mg, 230 – 400 mesh; Merck), with the tip placed inside of a 5-mL disposable glass culture tube. Solvent was pushed through the silica gel for ~2 s by attaching compressed air to the top of the Pipetman tip. An aliquot (600 μL) of 100 mL/L methanol in CHCl3 was applied to the silica gel, and the solvent was pushed through the gel with use of compressed air. The solvent was removed in a vacuum desiccator or with a stream of air. The residue was taken up in 200 μL of 5 mmol/L ammonium formate in methanol–CHCl3 (3:1 by volume). Samples were submitted to mass spectrometry or stored at −20 °C. For each enzyme assay, a blank was run as above, using a 2-mm blood-free filter paper disk.
ENZYME ASSAYS USING 5-mm DBS
Preparation of solutions
Assay cocktails were prepared as follows. For ABG, we added to a 5-mL vial 200 μL of 3 mmol/L ABG-S, 480 μL of 0.05 mmol/L ABG-IS, and 240 μL of 120 g/L sodium taurocholate in water. For the other lysosomal enzymes we used the following volumes: 200 μL of 3 mmol/L ASM-S, 240 μL of 0.05 mmol/L ASM-IS, and 15 μL of 120 g/L sodium taurocholate in water for ASM; 120 μL of 10 mmol/L GAA-S, 120 μL of 0.1 mmol/L GAA-IS, 30 μL of 8 mmol/L acarbose in water, and 1.8 μL of Triton X-100 for GAA; 200 μL of 3 mmol/L GALC-S, 240 μL of 0.05 mmol/L GALC-IS, 240 μL of 120 g/L sodium taurocholate, and 12 g/L oleic acid (Aldrich) in water for GALC; and 300 μL of 10 mmol/L GLA-S, 120 μL of 0.1 mmol/L GLA-IS, 15 μL of 120 g/L sodium taurocholate in water, 105 μL of 1 mol/L N-acetylgalactosamine in water (Sigma) for GLA.
Solvent was removed in a vacuum desiccator to give a white residue, which was dissolved in a total of 1.8 mL (see below) of 0.62 mol/L citrate-phosphate, pH 4.95 (made by dissolving NaH2PO4 monohydrate in water to 0.62 mol/L, adding trisodium citrate to 0.31 mol/L, and adjusting to pH 4.95 with 6 mol/L HCl) for ABG. For the other lysosomal enzymes we added the following volumes of buffers: 1.8 mL of 0.92 mol/L sodium acetate (pH 5.5) for ASM; 1.8 mL of 0.3 mol/L citrate-phosphate (pH 3.89) for GAA; 1.8 mL of 0.3 mol/L citrate-phosphate (pH 4.42) for GALC; and 300 μL of 1.7 mol/L sodium acetate (pH 4.56) for GLA. In all cases, 0.1 mL of solvent was added, followed by vortex-mixing until the residue was dissolved and then addition of the remaining solvent. Any emulsion was broken by centrifugation. Assay cocktails were stored at −20 °C.
The final ABG, ASM, GALC, and GAA assay mixtures were prepared by mixing 15 μL of the corresponding cocktail (see above) with 10 μL of DBS extract (see below), and the final GLA assay was prepared by mixing 2.5 μL of GLA cocktail with 10 μL of DBS extract. The final concentrations of the components of each assay are listed in Table 1.
Table 1.
Composition of the lysosomal enzyme assay mixtures.
| Assay | Assay volume, μL | Substrate, mmol/L | Internal standard, nmol | Buffer | Detergent | Additional components |
|---|---|---|---|---|---|---|
| ABG | 25 | 0.2 | 0.2 | 0.37 mol/L citrate-phosphate, pH 5.1 | 9.6 g/L sodium taurocholate | None |
| ASM | 25 | 0.2 | 0.1 | 0.55 mol/L sodium acetate, pH 5.5 | 0.6 g/L sodium taurocholate | None |
| GALC | 25 | 0.2 | 0.1 | 0.18 mol/L citrate-phosphate, pH 4.5 | 9.6 g/L sodium taurocholate | 0.96 g/L oleate |
| GAA | 25 | 0.4 | 0.1 | 0.18 mol/L citrate-phosphate, pH 4.0 | 0.6 g/L Triton X-100 | 80 μmol/L acarbose |
| GLA | 12.5 | 2.0 | 0.1 | 0.34 mol/L sodium acetate, pH 4.6 | 1.2 g/L sodium taurocholate | 70 mmol/L N-acetylgalactosamine |
DBS extraction
To a single well of a 96-well microtiter plate (cat. no. 655001; Greiner) we added a 5-mm diameter DBS disc followed by 80 μL of 20 mmol/L sodium phosphate, pH 7.0. The plate was sealed with aluminum foil tape (cat. no. 3M 425; 3 × 60; Hillas Packaging, Inc.) and was incubated for 1 h at 37 °C with orbital shaking (250 rpm) in a thermostated air shaker.
Incubation
To each of 5 wells of a 96-well polypropylene microtiter plate (cat. no. 21201; E&K Scientific, Inc.) we added 10 μL of the DBS extraction solution, followed by 15 μL of ASM, GALC, ABG, or GAA assay cocktail or 2.5 μL of GLA assay cocktail (one cocktail per well). The plate was sealed as above and incubated at 37 °C for 24 h with orbital shaking (150 rpm).
Work up
Reactions were quenched by the addition of 100 μL of methanol–CHCl3 (2:1 by volume) to each well. The solution in each well was mixed by aspiration five times with a Pipetman P200, and all five solutions were combined in 1 well of 96-well deep-well polypropylene plate (2.2 mL per well; cat. no. 2045; Megatier plates; Continental Lab Products). To the combined mixture we added 400 μL each of CHCl3 and H2O. The plate was then placed in a thermostated air shaker with orbital shaking (250 rpm). The mixture separated into two layers after 1 h, and 400 μL of the bottom layer was removed with a Pipetman and applied to a single well of a 96-well filter plate (cat. no. F20005; Innovative Microplate Inc.) previously loaded with 100 mg of silica gel (230 – 400 mesh; Merck) by a plate loader (see the online Data Supplement). The filter plate was placed in a vacuum manifold (cat. nos. MAVM0960R and MAVM0960T; Millipore) containing a deep-well polypropylene plate (cat. no. 2045; Megatier plates; Continental Lab Products) as the filtrate receiver. The pressure in the manifold was reduced by use of an oil pump. After filtration of the applied solutions, the wells were charged with 700 μL of methanol–CHCl3 (1:9 by volume), and filtration was continued. The solvent was removed from the receiver plate by use of a vacuum desiccator. The resulting residue was taken up in 200 μL of 5 mmol/L ammonium formate in methanol–CHCl3 (3:1 by volume). Samples were then submitted to mass spectrometry or stored at −20 °C.
MASS SPECTROMETRY
Data were obtained on a Sciex API-III plus triple-quadrupole mass spectrometer controlled by an Apple Macintosh Quadra 800 computer. The electrospray source operated in positive mode, and the ions were detected in parent-ion and neutral-loss scan modes (12). In the parent-ion scan, a selected product ion was passed through the last (Q3) mass analyzer, whereas the first mass analyzer (Q1) was scanned to transmit all precursor ions that gave rise to the selected product ion. In the neutral-loss scan, both Q1and Q3 were scanned such that at any point during the scan they were offset by a constant mass increment corresponding to the mass of a neutral fragment that was lost in dissociation. Data were acquired by Tune2.5 and analyzed by MacSpec3.3. The instrument was adjusted to give an optimized response for all analytes (detailed settings are given in Table 1 of the online Data Supplement). Samples were introduced by flow injection through a fused-silica capillary (i.d. = 100 μm) by use of a syringe drive (Harvard Apparatus) at a flow rate of 3.3 μL/min. The capillary was flushed with acetonitrile (four times 50 μL) after each sample. The amount of product was calculated from the ion abundance ratio of the product to the internal standard for a sample minus that of a blank, multiplied by the amount of added internal standard and divided by the response factor ratio of product to internal standard. The enzyme activity in units of μmol · h−1 · (L blood)−1 was calculated assuming that 10 μL of DBS extraction solution contained one eighth of the total blood contained in a 5-mm DBS (7.8 μL of blood) (13), i.e., 10 μL contained 0.98 μL of blood.
Results
DESIGN OF ASSAYS FOR LYSOSOMAL ENZYME
The structures of the substrates, products, and internal standards relevant to the assays for the five lysosomal enzymes ABG, ASM, GAA, GALC, and GLA are shown in Fig. 1 along with the products and internal standards. ABG-S, ASM-S, and GALC-S are synthetic sphingolipids containing N-linked fatty acyl chains that are shorter than the typical natural substrates. The corresponding products, ABG-P, ASM-P, and GALC-P, are nonnatural ceramides and thus are derived from the action of the lysosomal enzymes on the synthetic substrates without interference from endogenous natural ceramides. The structures of the internal standards and products differed only by the length of the fatty acyl chain (Fig. 1) and thus were differentiated in the mass spectrometer. The electro-spray ionization efficiency ratio of each product to the corresponding internal standard was close to unity for each pair (see Fig. 1 in the online Data Supplement; see Discussion for a suggestion of the frequency of calibration).
Although tandem mass spectrometry allows low-abundance analytes to be detected in complex mixtures, electrospray ionization of analytes is expected to be suppressed by the relatively large amounts of buffer components present in the DBS reaction mixtures (14). Thus, we developed a simple solid-phase extraction method using silica gel to remove buffer components. The ABG, ASM, and GALC products and internal standards passed immediately through the silica plug in a multiwell filter plate, whereas detergent and buffer salts were trapped on the solid phase. GAA and GLA can act on water-soluble polysaccharide substrates, but we designed synthetic lipidated substrates that would generate lipidated products (Fig. 1) that behaved on silica gel like the ceramide products. Thus, the products and internal standards from all five lysosomal enzyme reaction mixtures could be processed by a single silica gel purification. All of the pre-mass spectrometry sample steps were carried out in multiwell plates, facilitating a high-throughput analysis.
As shown in Fig. 1, all of the products and internal standards from the ABG, ASM, and GALC assays, on collision-induced dissociation (CID), generated the same protonated dienylideneimine (m/z 264). Thus, parent ion scanning (also known as precursor ion scanning) of the ion at m/z 264 allowed all six cations to be quantified. The GAA and GLA products contained an N-linked t-butyloxycarbonyl group, which provided a route for efficient neutral-loss fragmentation by loss of isobutene and CO2 during CID. Thus, we used neutral-loss scanning (loss of 100 atomic mass units) to selectively quantify the products and internal standards for the GAA and GLA reactions. The hydrocarbon linkers of GAA-P and GLA-P differed by one –CH2 group and thus were distinguished in the mass spectrometer; the internal standards were distinguished from the products by use of the pentadeuterated benzoyl group (a relatively inexpensive isotope label; Fig. 1).
INTERFERING ACID α-GLUCOSIDASES
The enzyme GAA, relevant to the diagnosis of Pompe disease, has an acidic pH optimum. Use of blood cells as a source of GAA together with a synthetic substrate is generally considered to be unreliable because of the presence of a second acid α-glucosidase in PMNs, known as the “renal” enzyme (RAAG; also known as maltase glucoamylase), because of its abundance in the kidneys (15). Thus, purified lymphocytes, fibroblasts, or muscle tissue are recommended for the biochemical diagnosis of Pompe disease (16). Tris (0.1 mol/L) has been reported to allow partial differentiation of GAA and RAAG (17), but we have found that the extent of differentiation is insufficient for a robust screening assay (not shown). Immunocapture procedures have been developed to allow a specific assay of GAA (18, 19), but the use of an antibody adds additional steps to the procedure and is too expensive for newborn screening. Furthermore, a GAA concentration of 0 has been measured with immunocapture assays in samples known to contain 10 –20% residual GAA activity (20). Selective extraction of water-soluble GAA from membrane-bound RAAG has been reported (21), but this method has not worked in our hands when we used DBS as an enzyme source.
We tested several known α-glucosidase inhibitors against recombinant GAA and a detergent extract of human PMNs as a source of GAA and RAAG. As shown in the top panel of Fig. 2, acid α-glucosidase activity in the PMN lysate decreased significantly with 0 –10 μmol/L acarbose, whereas recombinant GAA was relatively insensitive to this compound. As can be seen in Fig. 2, GAA was estimated to account for ~30% of the total acid α-glucosidase activity present in the PMN extract. The α-glucosidase inhibitor Ghavamiol (22) displayed the opposite specificity. At a concentration of 1 mmol/L, this compound inhibited ~96% of the recombinant GAA activity and <50% of the activity in the PMN extract (Fig. 2, bottom). Inhibition studies in which recombinant GAA was added to the PMN extract showed that all of the recombinant enzyme was inhibited by 1 mmol/L Ghavamiol in the presence of all of the components from the PMN lysate (Fig. 2, bottom). Dixon plot analysis indicated that acarbose inhibits recombinant GAA and PMN RAAG, with Ki values of 142 and 0.14 μmol/L, respectively (not shown). This analysis also yielded Km values of 0.73 and 0.36 mmol/L for GAA-S acted on by GAA and PMN RAAG, respectively. Other α-glucosidase inhibitors were tested, but none were highly selective for GAA or RAAG (see the online Data Supplement). We cannot be certain that GAA and RAAG are the only enzymes in PMNs responsible for the acid α-glucosidase activity, but the combined data strongly suggest that acarbose can be used to selectively block the non-GAA acid α-glucosidase activity present in DBS. The data below also support the usefulness of acarbose inhibition for the analysis of Pompe disease.
Fig. 2. Inhibition of acid α-glucosidases by acarbose (top) and Ghavamiol (bottom).

●, recombinant GAA; ▼, PMN enzymes; ■, recombinant GAA + PMN enzymes. PMN enzyme activity was measured in a Triton X-100 lysate of PMNs. Assays were performed as described in Materials and Methods except that the incubation time was 70 min, with 2.3 ng of recombinant GAA and 1.3 μg of PMN protein used per assay.
OPTIMIZATION OF ASSAYS
In principle, it should be possible to hydrate the DBS with a single buffer containing all five enzyme substrates and subject the reaction mixture to tandem mass spectrometry. However, after considerable effort, we were unable to find a single buffer that supported optimal activity of all five enzymes. The activity of each enzyme depends critically on pH and detergent concentration (see Figs. 2 and 3 in the online Data Supplement) and buffer composition. For example, the activity of ASM in citrate-phosphate (pH 5.5) was 50% that measured in sodium acetate at the same pH. Each enzyme was therefore assayed in its preferred buffer, and reaction mixtures were combined before purification and injection of a single solution into the tandem mass spectrometer.
The amount of product for each enzyme assay increased in a linear fashion during incubation periods of 0 –24 h (Fig. 3). For the ASM and GLA assays, the amount of product was proportional to the area of the DBS up to 6.3 mm2 (2 × 2 mm DBS), but for the ABG, GAA, and GALC assays, the plots were linear only up to a DBS area of 1.6 mm2 (0.5 × 2 mm DBS; Fig. 4). A flattening of the product-vs-DBS-area curve was observed at higher DBS areas. This is presumably attributable to the presence of one or more inhibitors in the blood because increased DBS area would lead to an increase in the inhibitor/substrate ratio, which determined the percentage of enzyme in the inhibited form. This hypothesis is supported by the observation that better linearity was observed when the assay volume was increased from 25 to 50 μL with the concentration of substrate held constant (not shown).
Fig. 3. Amount of enzymatic reaction product vs assay incubation time.

Each point is the mean (SD; error bars) of a triplicate assay, each carried out with one 2-mm DBS from a healthy adult per reaction tube. Assays as described in Materials and Methods except for the variation in the assay incubation time as indicated.
Fig. 4. Amount of enzymatic reaction product vs the number of 2-mm DBS.

Assays were done with DBS from a healthy adult. Each point is the mean (SD; error bars) of triplicate assays carried out as described in Materials and Methods except for variation in the number of DBS as indicated.
For all five enzymes, the amount of product showed a hyperbolic dependence on the substrate concentration (see Fig. 4 in the online Data Supplement), and Km values of 0.28, 0.058, 0.74, 0.24, and 3.0 mmol/L were obtained for ABG-S, ASM-S, GAA-S, GALC-S, and GLA-S, respectively. These are presumably apparent Km values; the actual values could be lower because of the possible presence of endogenous inhibitors in DBS.
The final assay conditions are given in Table 1. All conditions were optimized so that the cost of materials was minimized but the amount of enzymatic product was sufficient for reliable quantification by tandem mass spectrometry. In addition, reaction conditions were optimized to allow for the use of a common incubation time (20 –24 h), an advantage for high-throughput screening.
The use of a universal extraction buffer to extract a single DBS per patient for subsequent distribution into five assay reactions is advantageous for screening because it avoids the need to obtain several punches from the same DBS. This also reduces variation caused by inhomogeneous distribution of blood on the filter paper. We explored several extraction buffers to obtain the universal buffer given in the Materials and Methods. We compared the activities of the five enzymes when a single 2-mm DBS was used in each reaction mixture with that obtained when a 5-mm DBS was first extracted with universal buffer and the extract aliquoted into enzymatic reaction mixtures (data normalized to equivalent amount of blood assuming that a 2-mm DBS contains 1.25 μL of blood). The extraction efficiencies obtained with the universal buffer described in the Material and Methods were measured in 16 independent trials (four DBS from healthy adults, obtained between 2000 and 2003). The mean (SD) values were 50 (5)%, 47 (3)%, 51 (7)%, 70 (5)%, and 28 (2)% for ABG, ASM, GALC, GAA, and GLA, respectively. Higher extraction efficiencies for some enzymes could be achieved under different conditions, but we selected the buffer that gave the highest amount of GALC because this enzyme has the lowest specific activity of the five tested.
ENZYME ACTIVITIES
We examined the sample-to-sample reproducibility of the five enzyme assays by performing 14 independent assays for each enzyme. For this analysis, we took 14 punches from the newborn-screening card of a single patient (each card has five DBS). We could obtain up to eight punches per DBS; each punch was taken at a fixed radial distance from the DBS center (~4 mm). Each assay was carried out with a single 2-mm DBS per assay tube (for the details, see Materials and Methods). The CVs were 9.9%, 8.3%, 9.7%, 5.2%, and 4.6% for the ABG, ASM, GALC, GAA, and GLA assays, respectively. We also tested the within-run reproducibility of the tandem mass spectrometry analysis by analyzing the same post-silica-purification assay mixture 17 times over a 2-month period. The CVs were 8.1%, 6.6%, 5.6%, 3.3%, and 4.8% for the ABG, ASM, GALC, GAA, and GLA assays, respectively.
We then measured the activity of five enzymes, using DBS from noncarrier healthy adults, obtained between 2000 and 2003 and stored in sealed plastic bags at 4 °C. The results (Fig. 5) showed that the activities of four of the five enzymes did not vary with the age of the DBS (paired t-test, P >0.05). The exception was GALC, which showed a decrease in activity over the 4-year period (GALC activity in samples obtained in 2000 was 50% of that in samples obtained in 2003, 78% of the activity in samples obtained in 2001, and 85% of the activity in samples obtained in 2002). We therefore concluded that the stabilities of the five enzymes in the DBS stored at 4 °C are sufficient if used for newborn screening and, except for GALC, sufficient for retrospective analysis over a 4-year period. On the basis of these data, subsequent assays (see below) for GALC were carried out with DBS from 2003, whereas the other four assays were carried out with DBS from 2000–2003.
Fig. 5. Activities of lysosomal enzymes in DBS obtained between 2000 and 2003, as measured using a single 5-mm DBS extracted with universal extraction buffer.

Each box represents data obtained from 15 healthy adults. For each enzyme, data are arranged from 2000 to 2003 (left to right). All DBS were stored at 4 °C. The error bars indicate the range of values; and the boxes show the values between the 25th and 75th percentiles. Horizontal bars and ◆ in each box indicate the median and mean values, respectively.
The activities of all five enzymes in affected patients, heterozygous carriers, healthy adult noncarriers, and healthy infants (age <1 year) are shown in Fig. 6. For all assays, the DBS were extracted with universal extraction buffer. The data are presented in tabular data in Table 2. For ABG, ASM, GAA, and GLA, all patients showed deficient enzyme activity that was unambiguously distinguished from the activities in heterozygotes and healthy persons. The mean activity of obligate heterozygotes was approximately one half the mean activity in healthy adults, but the range of activities partially overlapped. DBS from patients with Krabbe disease (2003) had lower GALC activities than DBS from healthy adults and infants whose DBS were collected in the same year. No data were obtained for GALC heterozygotes (because of a lack of DBS). For all enzymes except ABG, the mean enzyme activities in healthy infants were higher than in healthy adults (Fig. 6), but the lower ends of the activity ranges of healthy adults and infants were approximately the same.
Fig. 6. Enzyme activities in affected patients, heterozygotes, and healthy controls obtained with extracts of a 5-mm DBS.
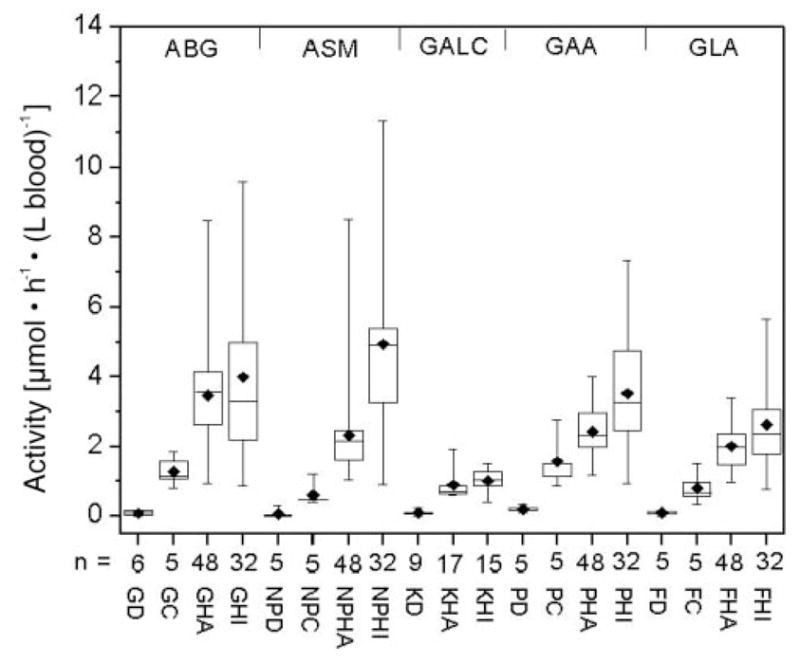
The number of individuals per group is indicated. GD, ABG activity in patients with Gaucher disease (1 infant, 2 juveniles, 3 adults); GC, ABG activity in heterozygous Gaucher adults; GHA, ABG activity in healthy adults; GHI, ABG activity in healthy infants; NPD, ASM activity in patients with Niemann–Pick disease types A and B (3 infants, 2 juveniles); NPC, ASM activity in heterozygous adults; NPHA, ASM activity in healthy adults; NPHI, ASM activity in healthy infants; KD, GALC activity in patients with Krabbe disease (1 infant, 2 juveniles, 1 adult, 5 of unknown age); KHA, GALC activity in healthy adults; KHI, GALC activity in healthy infants; PD, GAA activity in patients with Pompe disease (1 infant, 4 adults); PC, GAA activity in heterozygous adults; PHA, GAA activity in healthy adults; PHI, GAA activity in healthy infants; FD, GLA activity in patients with Fabry disease (3 juveniles, 2 adults); FC, GLA activity in heterozygous adults; FHA, GLA activity in healthy adults; FHI, GLA activity in healthy infants. DBS were stored at 4 °C except for the DBS obtained from GALC patients, which were stored at −20 °C.
Table 2.
Lysosomal enzyme activities in DBS.a
| Enzyme | Affected patients
|
Heterozygotes
|
Healthy adults
|
Healthy infants
|
||||||||||
|---|---|---|---|---|---|---|---|---|---|---|---|---|---|---|
| n | Maximum, μmol · h−1 · (L blood)−1 | % of mean of healthy adultsb | n | Minimum, μmol · h−1 · (L blood)−1 | Affected patient detection indexc | n | Activity, μmol · h−1 · (L blood)−1
|
n | Activity, μ mol · h−1 · (L blood)−1
|
|||||
| Maximum | Minimum | Median | Maximum | Minimum | Median | |||||||||
| 5-mm DBS extracted with universal extraction buffer | ||||||||||||||
| ABG | 6 | 0.18d | 5 | 5 | 0.81 | 22 | 48 | 8.49 | 0.94 | 3.36 | 32 | 9.60 | 0.89 | 3.31 |
| ASM | 5 | 0.32 | 14 | 5 | 0.40 | 80 | 48 | 8.53 | 1.05 | 2.12 | 32 | 11.3 | 0.92 | 4.41 |
| GALC | 9 | 0.20 | 19 | 0 | 17 | 1.92 | 0.6 | 0.72 | 15 | 1.53 | 0.42 | 1.01 | ||
| GAA | 5 | 0.33 | 14 | 5 | 0.89 | 37 | 48 | 4.02 | 1.19 | 2.19 | 32 | 7.33 | 0.93 | 3.12 |
| GLA | 5 | 0.17 | 9 | 5 | 0.34 | 50 | 48 | 3.40 | 0.97 | 1.91 | 32 | 5.65 | 0.77 | 2.23 |
| Single 2-mm DBS per enzymatic reaction | ||||||||||||||
| ABG | 5 | 0.47e | 7 | 5 | 1.29 | 36 | 20 | 13.6 | 2.01 | 6.54 | 32 | 19.2 | 1.77 | 6.04 |
| ASM | 5 | 0.21 | 5 | 5 | 0.67 | 31 | 20 | 6.87 | 1.42 | 4.25 | 32 | 19.4 | 1.93 | 9.19 |
| GALC | 9 | 0.23 | 13 | 0 | 16 | 2.53 | 0.94 | 1.75 | 15 | 2.93 | 0.81 | 2.02 | ||
| GAA | 11 | 0.17 | 5 | 9 | 1.14 | 15 | 20 | 8.50 | 1.24 | 3.59 | 32 | 10.8 | 1.36 | 4.58 |
| GLA | 5 | 0.25 | 4 | 5 | 0.59 | 42 | 20 | 10.9 | 1.11 | 7.23 | 32 | 19.7 | 1.08 | 7.50 |
For all assays except GALC, DBS were obtained between 2000 and 2003. For GALC assays, all DBS were obtained in 2003. All DBS were stored in sealed plastic bags at 4 °C.
Maximum enzyme activity observed among the affected patients divided by the mean activity measured for the healthy adults.
Maximum enzyme activity among the affected patients divided by the minimum activity among the heterozygotes, multiplied by 100. The lower the value of this number, the more reliable the assay is for detection of affected patients.
Blank values (obtained with an extract of a 5-mm blood-free filter disk) were subtracted to give the values. The blank values [mean (SD) for eight independent assays] are as follows: 0.12 (0.09), 0.10 (0.04), 0.21 (0.07), 0.06 (0.02), and 0.15 (0.02) μmol · h−1 · (L blood)−1 for ABG, ASM, GALC, GAA, and GLA, respectively. These values were calculated assuming that each assay would have contained 0.98 μL of blood.
Blank values (obtained with a 2-mm blood-free filter disc) were subtracted to give the values. The blank values [mean (SD) for eight independent assays] are as follows: 0.41 (0.15), 0.21 (0.09), 0.34 (0.12), 0.1 (0.03), and 0.26 (0.15) μmol · h−1 · (L blood)−1 for ABG, ASM, GALC, GAA, and GLA, respectively, assuming that each 2-mm blood-free DBS would have contained 1.25 μL of blood.
The activities of all five enzymes in patients, heterozygotes, healthy adults, and healthy infants as measured with assays using a single 2-mm DBS per reaction (rather than extraction of a single 5-mm DBS) are shown in Fig. 7. The activities of all five enzymes measured by the assays using a single 2-mm DBS per reaction (Fig. 7) were higher than those obtained by extraction of a single 5-mm DBS (Fig. 6) because of incomplete extraction of the single 5-mm DBS, as noted above. However, the differences in enzyme activities among patients, heterozygotes, and healthy controls shown in Fig. 6 were consistent with the results obtained with use of a 2-mm DBS for each assay reaction (Fig. 7). Although the absolute activities measured with the mass spectrometry assay differed from those measured with other types of enzyme assays, the relative activities for affected patients vs heterozygotes and healthy controls were generally similar to those reported previously (15).
Fig. 7. Enzymatic activities of affected patients, heterozygotes, and healthy controls obtained with a single 2-mm DBS per assay.
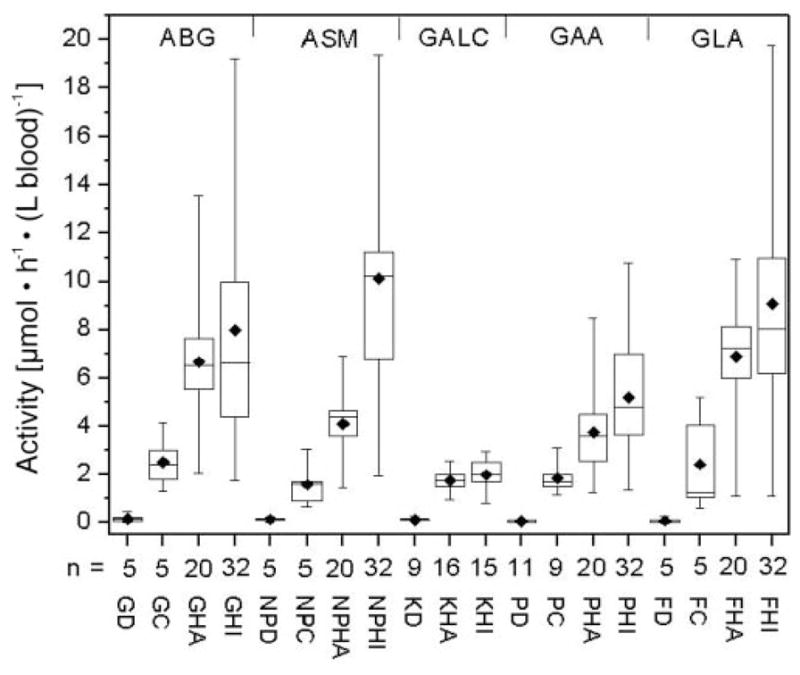
Abbreviations are as in the legend for Fig. 6. DBS were stored at 4 °C except for the DBS obtained from GALC patients, which were stored at −20 °C.
Discussion
The quantification of accumulated metabolites in DBS by tandem mass spectrometry can be used to detect up to ~ 30 genetic disorders in newborn-screening programs. Extending the analysis to the diagnosis of a subset of lysosomal storage diseases is warranted given that effective therapies for such diseases are currently available or in clinical development. On the basis of these criteria, we have developed a high-throughput multiplex assay for five lysosomal enzymes, ABG, ASM, GAA, GALC and GLA, in DBS. Previous studies have shown that these enzymes are active in DBS (18, 23–25). This allows the activities of these enzymes to be quantified by direct enzyme assay.
Mass spectrometric methods have been developed for the detection of accumulated metabolites resulting from Fabry disease (26), Gaucher disease (27), and Krabbe disease (28). These methods are sensitive and specific for quantification of metabolites and are believed to be useful in monitoring the effectiveness of therapeutic treatment. However, the usefulness of these methods for newborn screening is limited by the complicated pretreatment steps required before mass spectrometry, with a different procedure needed for each metabolite analyzed. In addition, the authors of these published studies state that the methods are not recommended for diagnostic purposes. The method described in the present study leads to unambiguous quantification of lysosomal enzymes because enzyme activity is measured directly. Furthermore, the data obtained to date suggest that the method is reliable for newborn screening for these five lysosomal enzyme deficiencies.
Conventional methods of quantifying enzymatic activity, such as spectrophotometry and fluorometry, have the limitations of nonspecificity and limited capacity for multiplexing. In addition, the incorporation of a chromophore or fluorophore into the substrate can give rise to false-negative results. For example, the use of an unnatural spectrophotometric substrate for assaying ASM has recently been shown to be problematic in that a mutant form of this enzyme shows normal activity on the artificial substrate but low activity on the naturally occurring sphingomyelin substrate (29). Quantification of enzymatic activity by tandem mass spectrometry is specific (the product is unambiguously identified and quantified), does not require substrate labeling, and is naturally multiplexable as long as the detected analytes and their CID fragments can be distinguished by their mass-to-charge ratios, which is typically the case. As shown in this work, the detection of five lysosomal enzymes that are traditionally measured by different analytical methods (18, 23, 24) can be achieved with a single analytical platform. The method described here, in which tandem mass spectrometry is used to directly quantify enzymes in DBS, should be generally applicable to almost any enzyme that retains activity in a rehydrated DBS. The potential of this method to assay other enzymes of significance to newborn screening is under active investigation.
The use of acarbose as an inhibitor to completely suppress the activity of RAAG while retaining most of the GAA activity represents a simple, inexpensive, and reliable method for diagnosis of Pompe disease in DBS. Considering the known costs for commercially available reagents and supplies and using a conservative estimate of the cost to manufacture those components of the multiplex assay that are not currently commercially available, i.e., GAA-S, GAA-IS, GLA-S, and GLA-IS, we estimate an overall reagent and supply cost of $0.72 per individual for all assay steps before tandem mass spectrometry (see Table 3 of the online Data Supplement). This cost is compatible with budgetary constraints of newborn-screening programs. The mass spectrometry costs are difficult to estimate at this time. It is likely, but not yet confirmed, that the sample derived from the set of five lysosomal enzyme assays can be infused into the mass spectrometer together with the sample for amino acid and acylcarnitine analysis. All of the species can be distinguished by multiple reaction monitoring, but it remains to be seen whether components of the lysosomal enzyme assay sample significantly suppress the ionization of the amino acid and acylcarnitine derivatives.
In the present study we used the extract of a 5-mm DBS to assay all five lysosomal enzymes or used a 2-mm DBS for each of the five enzymatic reaction mixtures. The latter method is more sensitive because enzymes are not quantitatively extracted from a DBS. Given that the lowest measured activities were for GALC, it might be best to use a single 2-mm DBS to assay this enzyme and a 5-mm DBS subjected to enzyme extraction to assay the other four lysosomal enzymes. Both punches can be obtained from the same DBS (2-mm punch taken first from the center of the DBS, followed by a 5-mm concentric punch to give a “washer”-shaped punch). We have verified that this double-punch method gives assay results that are indistinguishable from those obtained from 2- and 5-mm punches obtained from different DBS (not shown). These results were obtained by extracting the 5-mm washer punch with 64 μL of universal extraction buffer (20 mmol/L sodium phosphate, pH 7.0) and using 10-μL aliquots for the ABG, ASM, GAA, and GLA assays.
The sample preparation steps before tandem mass spectrometry are simple liquid transfers using microtiter plate reaction vessels. Thus, all steps are amenable to automation by use of programmable pipetting robotics. However, manual manipulation is perfectly acceptable using a handheld, multichannel pipettor, especially when fewer than ~500 patient DBS are analyzed per day (the typical load of a statewide newborn-screening laboratory in the United States). As summarized in Table 1 of the online Data Supplement, 1.3 min of sample infusion time is needed to quantify the five lysosomal enzymes by use of a Sciex API-III plus triple quadrupole mass spectrometer. Currently available tandem mass spectrometers are expected to produce a 4-fold or higher increase in ion current, which is anticipated to reduce the sample infusion time by at least 16-fold.
The GAA and GLA assays make use of internal standards that are chemically identical but isotopically distinguishable from the enzymatically generated products, whereas the ABG, ASM, and GALC assays make use of internal standards that are close in structure to the products but not chemically identical. Thus, calibration curves of the type shown in Fig. 1 of the online Data Supplement derived from mass spectrometric analysis of standard solutions of product and internal standard are required for these latter three assays. The calibration curves showed a good linear behavior with predicted product/internal standard concentration ratios within ±0.049 –0.066 of the actual measured ratios. The largest relative errors are expected at very low product/internal standard concentration ratios, corresponding to DBS from affected patients. Considering the generally very good linearity of the product/internal standard concentration ratios from the mass spectrometric data, calibration with two product/internal standard mixtures should be sufficient in day-to-day measurements. The internal standard concentration should be adjusted to be equal to the mean of product concentrations based on assays of healthy individuals. The calibration mixtures should be measured at product/internal standard concentration ratios of 1 (corresponding to the mean of the healthy population) and 0.5 (as an approximate midpoint of the heterozygous population). The two-point calibration should be performed before and after each analytical run of multiple samples, e.g., from a 96-well plate.
Although the detection rate for affected patients was 100% in the current study, additional analyses with a larger number of DBS are in progress to further evaluate our method. We are also exploring the conversion of our assay to high throughput (hundreds of samples analyzed per day) as well as other issues such as the number of blank samples analyzed per multiwell plate of patient samples. It should also be mentioned that in cases of abnormal or nondiscriminative results obtained with a DBS, a blood sample for lymphocyte isolation or a fibroblast skin culture should be requested for confirmation of the enzyme deficiency.
Supplementary Material
Acknowledgments
This work was supported by grants from the National Institutes of Health (DK67859), Genzyme Inc., and the Natural Sciences and Engineering Research Council of Canada. We are grateful to Joan Keutzer, Helmut Kallwass, Kate Zhang, and Knut Brockmann for discussions and providing DBS and to Martin Sadilek for technical assistance with mass spectrometry. Some of the DBS from patients with Krabbe and Pompe disease were kindly supplied by the Hunter’s Hope Foundation (Orchard Park, NY) and by D. Millington (Duke University, Durham, NC), respectively.
Footnotes
Nonstandard abbreviations: DBS, dried blood spot; ABG, acid β-glucocerebrosidase; GLA, acid α-galactosidase A; GAA, lysosomal acid α-glucosidase; ASM, acid sphingomyelinase; GALC, galactocerebroside β-galactosidase; PMN, polymorphonuclear leukocyte; CID, collision-induced dissociation; RAAG, renal acid α-glucosidase.
References
- 1.Chace DH, Kalas TA, Naylor EW. Use of tandem mass spectrometry for multianalyte screening of dried blood specimens from newborns. Clin Chem. 2003;49:1797–817. doi: 10.1373/clinchem.2003.022178. [DOI] [PubMed] [Google Scholar]
- 2.Wulfkuhle JD, Paweletz CP, Steeg PS, Petricoin EF, Liotta L. Proteomic approaches to the diagnosis, treatment, and monitoring of cancer. Adv Exp Med Biol. 2003;532:59–68. doi: 10.1007/978-1-4615-0081-0_7. [DOI] [PubMed] [Google Scholar]
- 3.Jurinke C, van den Boom D, Cantor CR, Koster H. The use of MassARRAY technology for high throughput genotyping. Adv Biochem Eng Biotechnol. 2002;77:57–74. doi: 10.1007/3-540-45713-5_4. [DOI] [PubMed] [Google Scholar]
- 4.Gerber SA, Scott CR, Turecek F, Gelb MH. Direct profiling of multiple enzyme activities in human cell lysates by affinity chromatography/electrospray ionization mass spectrometry: application to clinical enzymology. Anal Chem. 2001;73:1651–7. doi: 10.1021/ac0100650. [DOI] [PubMed] [Google Scholar]
- 5.Schulze A, Lindner M, Kohlmuller D, Olgemoller K, Mayatepek E, Hoffmann GF. Expanded newborn screening for inborn errors of metabolism by electrospray ionization-tandem mass spectrometry: results, outcome, and implications. Pediatrics. 2003;111:1399–406. doi: 10.1542/peds.111.6.1399. [DOI] [PubMed] [Google Scholar]
- 6.Wilcken B, Wiley V, Hammond J, Carpenter K. Screening newborns for inborn errors of metabolism by tandem mass spectrometry. N Engl J Med. 2003;348:2304–12. doi: 10.1056/NEJMoa025225. [DOI] [PubMed] [Google Scholar]
- 7.Grabowski GA, Hopkin RJ. Enzyme therapy for lysosomal storage disease: principles, practice, and prospects. Annu Rev Genomics Hum Genet. 2003;4:403–36. doi: 10.1146/annurev.genom.4.070802.110415. [DOI] [PubMed] [Google Scholar]
- 8.Kaye EM. Lysosomal storage diseases. Curr Treat Options Neurol. 2001;3:249–56. doi: 10.1007/s11940-001-0006-9. [DOI] [PubMed] [Google Scholar]
- 9.Schiffmann R, Brady RO. New prospects for the treatment of lysosomal storage diseases. Drugs. 2002;62:733–42. doi: 10.2165/00003495-200262050-00002. [DOI] [PubMed] [Google Scholar]
- 10.Winke LP, Kamphoven JH, van den Hout JH, Severijnen LA, van Doorn PA, Reuser AJ, et al. Morphological changes in muscle tissue of patients with infantile Pompe’s disease receiving enzyme replacement therapy. Muscle Nerve. 2003;27:743–51. doi: 10.1002/mus.10381. [DOI] [PubMed] [Google Scholar]
- 11.Degousee N, Ghomashchi F, Stefanski E, Singer AG, Smart BP, Borregaard N, et al. Groups IV, V and X phospholipases A2 in human neutrophils. J Biol Chem. 2001;277:5061–73. doi: 10.1074/jbc.M109083200. [DOI] [PubMed] [Google Scholar]
- 12.Busch KL, Glish GL, McLuckey SA. Techniques and applications of tandem mass spectrometry. New York: VCH Publishers; 1988. Mass spectrometry/mass spectrometry; pp. 311–5. [Google Scholar]
- 13.Mei JV, Alexander JR, Adam BW, Hannon WH. Use of filter paper for the collection and analysis of human whole blood specimens. J Nutr. 2001;131:1631S–6S. doi: 10.1093/jn/131.5.1631S. [DOI] [PubMed] [Google Scholar]
- 14.Wang G, Cole RB. Electrospray ionization mass spectrometry. In: Sons JW, editor. Fundamentals, instrumentation and applications. New York: 1997. pp. 137–74. [Google Scholar]
- 15.Scriver CR, Beaudet AL, Sly WS, Valle D, editors. The metabolic and molecular bases of inherited disease. New York: McGraw-Hill; 1995. [Google Scholar]
- 16.Koster JF, Slee RG, Hulsmann WC. The use of leucocytes as an aid in the diagnosis of glycogen storage disease type II (Pompe’s disease) Clin Chim Acta. 1974;51:319–25. doi: 10.1016/0009-8981(74)90319-2. [DOI] [PubMed] [Google Scholar]
- 17.Ortiz de Apodaca MA, Fernandez E, de la Fuente G. Tris discriminates between the different α-glucosidase activities from extracts of human neutrophils. J Inherit Metab Dis. 1992;15:213–9. doi: 10.1007/BF01799633. [DOI] [PubMed] [Google Scholar]
- 18.Umapathysivam K, Hopwood JJ, Meikle PJ. Determination of acid α-glucosidase activity in blood spots as a diagnostic test for Pompe disease. Clin Chem. 2001;47:1378–83. [PubMed] [Google Scholar]
- 19.Shin YS, Endres W, Unterreithmeier J, Rieth M, Schaub J. Diagnosis of Pompe’s disease using leukocyte preparations. Kinetic and immunological studies of 1,4-α-glucosidase in human fetal and adult tissues and cultured cells. Clin Chim Acta. 1985;148:9–19. doi: 10.1016/0009-8981(85)90295-5. [DOI] [PubMed] [Google Scholar]
- 20.Ausems MG, Wokke JH, Reuser AJ, van Diggelen OP. Juvenile and adult-onset acid maltase deficiency in France: genotype-phenotype correlation. Neurology. 2001;57:1938. doi: 10.1212/wnl.57.10.1938. [DOI] [PubMed] [Google Scholar]
- 21.Dreyfus JC, Poenaru L. White blood cells and the diagnosis of α-glucosidase deficiency. Pediatr Res. 1980;14:342–4. doi: 10.1203/00006450-198004000-00017. [DOI] [PubMed] [Google Scholar]
- 22.Ghavami A, Johnston BD, Jensen MT, Svensson B, Pinto BM. Synthesis of nitrogen analogues of salacinol and their evaluation as glycosidase inhibitors. J Am Chem Soc. 2001;123:6268–71. doi: 10.1021/ja0103750. [DOI] [PubMed] [Google Scholar]
- 23.Chamoles NA, Blanco M, Gaggioli D. Fabry disease: enzymatic diagnosis in dried blood spots on filter paper. Clin Chim Acta. 2001;308:195–6. doi: 10.1016/s0009-8981(01)00478-8. [DOI] [PubMed] [Google Scholar]
- 24.Chamoles NA, Blanco M, Gaggioli D, Casentini C. Gaucher and Niemann-Pick diseases—enzymatic diagnosis in dried blood spots on filter paper: retrospective diagnoses in newborn-screening cards. Clin Chim Acta. 2002;317:191–7. doi: 10.1016/s0009-8981(01)00798-7. [DOI] [PubMed] [Google Scholar]
- 25.Li Y, Brockman K, Turecek F, Scott CR, Gelb MH. Tandem mass spectrometry for the direct assay of enzymes in dried blood spots: application to newborn screening for Krabbe disease. Clin Chem. 2004;50:638–40. doi: 10.1373/clinchem.2003.028381. [DOI] [PubMed] [Google Scholar]
- 26.Boscaro F, Pieraccini G, la Marca G, Bartolucci G, Luceri C, Luceri F, et al. Rapid quantitation of globotriaosylceramide in human plasma and urine: a potential application for monitoring enzyme replacement therapy in Anderson-Fabry disease. Rapid Commun Mass Spectrom. 2002;16:1507–14. doi: 10.1002/rcm.728. [DOI] [PubMed] [Google Scholar]
- 27.Fujiwaki T, Yamaguchi S, Tasaka M, Sakura N, Taketomi T. Application of delayed extraction-matrix-assisted laser desorption ionization time-of-flight mass spectrometry for analysis of sphingolipids in pericardial fluid, peritoneal fluid and serum from Gaucher disease patients. J Chromatogr B. 2002;776:115–23. doi: 10.1016/s1570-0232(02)00177-0. [DOI] [PubMed] [Google Scholar]
- 28.Whitfield PD, Sharp PC, Taylor R, Meikle P. Quantification of galactosylsphingosine in the twitcher mouse using electrospray ionization-tandem mass spectrometry. J Lipid Res. 2001;42:2092–5. [PubMed] [Google Scholar]
- 29.Harzer K, Rolfs A, Bauer P, Zschiesche M, Mengel E, Backes J, et al. Niemann-Pick disease type A and B are clinically but also enzymatically heterogeneous: pitfall in the laboratory diagnosis of sphingomyelinase deficiency associated with the mutation Q292K. Neuropediatrics. 2003;34:301–6. doi: 10.1055/s-2003-44668. [DOI] [PubMed] [Google Scholar]
Associated Data
This section collects any data citations, data availability statements, or supplementary materials included in this article.