

Abstract
Large-scale meta-analyses of genome-wide association scans (GWAS) have been successful in discovering common risk variants with modest and small effects. The detection of lower frequency signals will undoubtedly require concerted efforts of at least similar scale. We investigate the sample size-dictated power limits of GWAS meta-analyses, in the presence and absence of modest levels of heterogeneity and across a range of different allelic architectures. We find that data combination through large-scale collaboration is vital in the quest for complex trait susceptibility loci, but that effect size heterogeneity across meta-analysed studies drawn from similar populations does not appear to have a profound effect on sample size requirements.
Keywords: genetic study, sample size, heterogeneity, replication, study design
Introduction
The advent of genome-wide association scans (GWAS) has undoubtedly changed the field of complex trait genetics dramatically over the last few years. GWAS became feasible following an alignment of possibilities, including large-scale sample size availability, an improved understanding of human genome sequence variation, advances in high-accuracy, high-throughput genotyping technologies, and a deeper appreciation of analytical considerations for the interpretation of data. The first wave of GWAS led to the successful identification of multiple common variants and, in general, reaped the low-hanging fruit, i.e. variants closely-tagging causal alleles with modest to large effect sizes [WTCCC, 2007]. However, individual studies are limited in power by finite sample sizes. Wide collaborative networks culminated in consortium formation with the purpose of meta-analysing at the genome-wide scale, increasing sample size without the need for de novo genotyping. By synthesizing summary association statistics across multiple GWAS, power is increased and novel discoveries have been made, for example in type 2 diabetes, colorectal cancer, coronary artery disease and fat distribution [Voight et al., 2010; Houlston et al., 2010; Preuss et al., 2010; Heid et al., 2010].
The vast majority of GWAS meta-analyses to date have focused on populations of similar ancestry (primarily European), circumventing the complications of locus heterogeneity that can have profound effects on power when combining data across different genetic architectures. Statistical heterogeneity is a challenge not only for meta-analyses across diverse populations, but also across similar-ancestry datasets when effect sizes are dissimilar. Allelic heterogeneity, which is conceivably the case for loci containing multiple low frequency/ rare variants, represents an additional challenge.
The field is poised to continue with ever-increasing large-scale GWAS meta-analyses in parallel to entering the era of next generation association studies involving whole-exome or whole-genome sequencing. In this work, we investigate when GWAS meta-analyses may reach a point of diminishing returns in terms of power to detect disease-associated variants, in the presence and absence of modest levels of heterogeneity and across a range of different allelic architectures.
Replication of findings before declaring success, i.e. before claiming the detection of established disease associations, has become the sine qua non in GWAS. The larger the discovery sample, the smaller the effect sizes that a GWAS meta-analysis can detect. This factor, in combination with winner’s curse (i.e. the fact that the originally identified effect size is likely to be overestimated in comparison to its true value), can translate into a requirement for replication datasets that supersede the discovery set in sample size. For current meta-analysis efforts that involve several tens of thousands of samples (even surpassing 100,000, for example for quantitative anthropometric traits such as height), identifying appropriately sized replication datasets can be extremely challenging. Here we also explore the combined power of the discovery (stage 1) and replication (stage 2) sets to detect associations at genome-wide significance, with a focus on sample size requirements.
Methods
We obtained estimates for the sample sizes required for a range of genetic effect sizes and different risk allele frequencies, keeping power constant at 80%. We investigated different scenarios involving a combination of stage 1 (discovery) and stage 2 (replication) samples, to mimic realistic GWAS meta-analysis studies and their follow-up. We considered a sample of cases and an equal number of controls. This 1:1 ratio was kept constant throughout all simulations for stage 1 and stage 2 and when considering the effects of heterogeneity. The disease trait was set to have a population risk of 0.05. We assumed that we were measuring the effect of the causal variant itself and examined power under the additive model in the log-odds ratio of the risk allele.
Stage1 (discovery)
Using the software package Quanto version 1.2.4 [Gauderman, 2002] we estimated the sample sizes required for 12 different ORs ranging from 1.05-3.0 (with increments of 0.05) and 15 different risk allele frequencies ranging from 0.001-0.5 (with initial increments of 0.001, followed by 0.01 then 0.1). We applied 3 different thresholds of significance: p<1×10⁻⁴, p<1×10⁻⁵ and p<5×10⁻⁸ (genome-wide significant) (Figure 1).
Figure 1. Overview of study design.
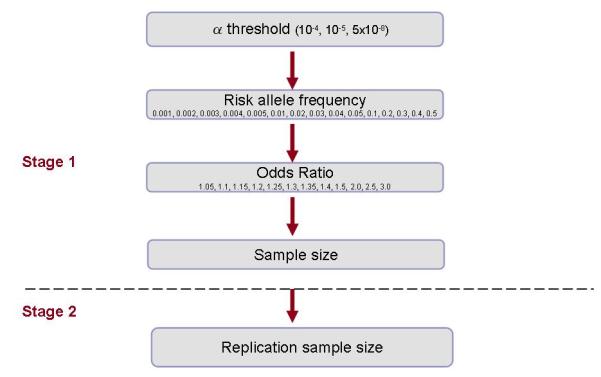
Stage 1 sample sizes were estimated using the following design parameters: population risk of 0.05, additive inheritance model, case-control ratio of 1:1, 80% power. Replication sample sizes were established using the following design parameters: 80% power to detect 100 signals from a GWAS of 2 million markers, α=5×10⁻⁸.
Stage2 (replication)
Using the software package CaTS [Skol et al., 2006] we assumed that 100 signals (0.005%) from 2 million markers of a GWAS meta-analysis (for example, using HapMap data to impute genotypes at untyped variants) were selected for replication in stage 2. This number of markers is representative of the first follow-up step for most GWAS meta-analysis efforts. The sample size necessary to replicate the stage 1 signals at a final significance threshold of 5×10⁻⁸ in a combined meta-analysis was calculated for each of the scenarios for each of the 3 stage 1 significance thresholds. A combined p-value surpassing genome-wide significance is typically taken as evidence for robust association at disease-associated loci. Sample sizes could not be estimated beyond a threshold of 1,000,000. A total of 540 scenarios were examined.
Heterogeneity
We selected three of the above scenarios for further investigation through simulations incorporating heterogeneity. These were:
Allele freq = 0.30, OR = 1.25 (common SNP, moderate effect size)
Allele freq = 0.05, OR = 1.25 (low-frequency SNP, moderate effect size)
Allele freq = 0.01, OR = 3.0 (low-frequency SNP, large effect size)
Evidence for heterogeneity of genetic effects is commonly investigated using two statistics: Cochran’s Q statistic of homogeneity and the I2 measure [Higgins et al., 2003]. We used I2 to quantify the effect of heterogeneity. The I2 measure has a very intuitive interpretation and allows assessing statistical significance and the extent of heterogeneity simultaneously. Different extents of heterogeneity wereconsidered for each of the 3 scenarios. We assigned adjectives of none, low, moderate and high heterogeneity to I2 values less than 15%, between 15% and 35%, between 35% and 70%, and greater than 70%, respectively (calculated as the mean across all simulations carried out for the scenario considered) [Higgins et al., 2003].
For our simulations, we assumed a meta-analysis of 10 studies with equal sample size and with a 1:1 case-control ratio. Disease prevalence was fixed at 0.05 (as above). For a given scenario, the allele frequency was fixed, while the ORs varied across studies to produce the selected, combined meta-analysis OR. The amount of variability depends on the level of heterogeneity considered in the scenario under analysis.
In each scenario, 10,000 replicates of data were simulated. In each replicate, and for each of the 10 studies, the genotypes of the SNP were simulated independently based on the allele frequency considered and assuming Hardy-Weinberg equilibrium. Conditional upon the genotype data, the case-control status was simulated according to the additive model. The association analysis was then performed in a logistic regression modelling framework. Based on this, fixed-effects meta-analysis was carried out, including a test of heterogeneity. Based on these simulations, power to detect association at a significance level of 5×10⁻⁸ was estimated, with mean I2 determined to evaluate heterogeneity. These simulations were repeated for different sample sizes in order to verify which would reach a detection power of 80%.
Results
Estimated sample sizes for stage 1 and stage 2 are given for each of the stage 1 significance thresholds of 1×10⁻⁴ (Table 1), 1×10⁻⁵ (Table 2) and 5×10⁻⁸ (Table 3) in the absence of heterogeneity. As expected, the results demonstrate a relationship between sample size, risk allele frequency (RAF), and the size of the genetic effect (Figures 2, 3 and 4). As the genetic variant becomes rarer and the odds ratio becomes smaller, the sample size required to detect the signal becomes increasingly large.
Table 1.
Sample size for stage 1 and stage 2 for a range of RAFs and ORs. Sizes are calculated for detection of 80% power at a significance level of 1×10⁻⁴ for stage 1 and a combined stage 1 and 2 significance level of 5×10⁻⁸. Estimates are based on assumptions of 1:1 case:control ratios and a population risk of 0.05.
| OR | RAF | |||||||||||||||
|---|---|---|---|---|---|---|---|---|---|---|---|---|---|---|---|---|
| 0.001 | 0.002 | 0.003 | 0.004 | 0.005 | 0.01 | 0.02 | 0.03 | 0.04 | 0.05 | 0.1 | 0.2 | 0.3 | 0.4 | 0.5 | ||
| 1.05 | stage1 | >1000000 | >1000000 | >1000000 | >1000000 | >1000000 | 930100 | 470000 | 316700 | 240100 | 194200 | 102700 | 58000 | 44400 | 39000 | 37600 |
| stage2 | 760991 | 384545 | 259118 | 196445 | 158891 | 84027 | 47455 | 36327 | 31909 | 30764 | ||||||
| 1.1 | stage1 | >1000000 | >1000000 | 790000 | 593100 | 475000 | 238800 | 120700 | 81400 | 61700 | 50000 | 26500 | 15000 | 11600 | 10200 | 9900 |
| stage2 | 646364 | 485264 | 388636 | 195382 | 98755 | 66600 | 50482 | 40909 | 21682 | 12273 | 9491 | 8345 | 8100 | |||
| 1.15 | stage1 | >1000000 | 539800 | 360300 | 270500 | 216600 | 108900 | 55100 | 37200 | 28200 | 22800 | 12100 | 6900 | 5300 | 4700 | 4600 |
| stage2 | 441655 | 294791 | 221318 | 177218 | 89100 | 45082 | 30436 | 23073 | 18655 | 9900 | 5645 | 4336 | 3845 | 3764 | ||
| 1.2 | stage1 | 621900 | 311300 | 207800 | 156000 | 125000 | 62900 | 31800 | 21500 | 16300 | 13200 | 7000 | 4000 | 3100 | 2800 | 2700 |
| stage2 | 508827 | 254700 | 170018 | 127636 | 102273 | 51464 | 26018 | 17591 | 13336 | 10800 | 5727 | 3273 | 2536 | 2291 | 2209 | |
| 1.25 | stage1 | 407800 | 204100 | 136300 | 102300 | 82000 | 41200 | 20900 | 14100 | 10700 | 8700 | 4600 | 2700 | 2100 | 1850 | 1800 |
| stage2 | 333655 | 166991 | 111518 | 83700 | 67091 | 33709 | 17100 | 11536 | 8755 | 7118 | 3764 | 1800 | 1400 | 1514 | 1473 | |
| 1.3 | stage1 | 290000 | 145200 | 96900 | 72800 | 58300 | 29300 | 14900 | 10000 | 7600 | 6200 | 3300 | 1900 | 1500 | 1350 | 1300 |
| stage2 | 237273 | 118800 | 79282 | 59564 | 47700 | 23973 | 9933 | 8182 | 6218 | 4133 | 2700 | 1555 | 1227 | 900 | 1064 | |
| 1.35 | stage1 | 218000 | 109200 | 72900 | 54700 | 43800 | 22100 | 11200 | 7600 | 5700 | 4700 | 2500 | 1400 | 1100 | 1000 | 1000 |
| stage2 | 178364 | 89345 | 48600 | 36467 | 29200 | 14733 | 7467 | 5067 | 4664 | 3133 | 1667 | 1400 | 1100 | 1000 | 818 | |
| 1.4 | stage1 | 170700 | 85500 | 57100 | 42900 | 34300 | 17300 | 8800 | 5900 | 4500 | 3700 | 2000 | 1100 | 900 | 800 | 800 |
| stage2 | 139664 | 69955 | 38067 | 28600 | 22867 | 11533 | 5867 | 3933 | 3000 | 2467 | 1333 | 1100 | 600 | 655 | 655 | |
| 1.5 | stage1 | 114200 | 57200 | 38200 | 28700 | 23000 | 11600 | 5900 | 4000 | 3000 | 2700 | 1300 | 800 | 600 | 550 | 550 |
| stage2 | 93436 | 38133 | 25467 | 19133 | 15333 | 7733 | 3933 | 2667 | 2000 | 1667 | 1064 | 431 | 491 | 450 | 450 | |
| 2 | stage1 | 34700 | 17400 | 11600 | 8700 | 7000 | 3500 | 1800 | 1200 | 900 | 800 | 400 | 250 | 200 | 200 | 200 |
| stage2 | 23133 | 11600 | 7733 | 5800 | 4667 | 2333 | 1200 | 800 | 736 | 431 | 327 | 167 | 133 | 108 | 133 | |
| 2.5 | stage1 | 18200 | 9100 | 6100 | 4600 | 3700 | 1900 | 950 | 650 | 500 | 400 | 250 | 150 | 100 | 100 | 100 |
| stage2 | 12133 | 6067 | 3285 | 2477 | 1992 | 1023 | 512 | 350 | 269 | 267 | 83 | 64 | 300 | 122 | 300 | |
| 3 | stage1 | 11800 | 5900 | 4000 | 3000 | 2400 | 1200 | 600 | 400 | 350 | 300 | 150 | 100 | 100 | 100 | 100 |
| stage2 | 6354 | 3177 | 2154 | 1615 | 1292 | 646 | 400 | 267 | 117 | 100 | 81 | 43 | 18 | 18 | 25 |
Table 2.
Sample size for stage 1 and stage 2 for a range of RAFs and ORs. Sizes are calculated for detection of 80% power at a significance level of 1×10⁻⁵ for stage 1 and a combined stage 1 and 2 significance level of 5×10⁻⁸. Estimates are based on assumptions of 1:1 case:control ratios and a population risk of 0.05.
| OR | RAF | |||||||||||||||
|---|---|---|---|---|---|---|---|---|---|---|---|---|---|---|---|---|
| 0.001 | 0.002 | 0.003 | 0.004 | 0.005 | 0.01 | 0.02 | 0.03 | 0.04 | 0.05 | 0.1 | 0.2 | 0.3 | 0.4 | 0.5 | ||
| 1.05 | stage1 | >1000000 | >1000000 | >1000000 | >1000000 | >1000000 | >1000000 | 580400 | 391100 | 296500 | 239800 | 126900 | 71700 | 54900 | 48200 | 46500 |
| stage2 | >1000000 | 193467 | 130367 | 98833 | 79933 | 42300 | 23900 | 18300 | 16067 | 15500 | ||||||
| 1.1 | stage1 | >1000000 | >1000000 | 975600 | 732500 | 586600 | 294900 | 149100 | 100500 | 76200 | 61700 | 32700 | 18600 | 14300 | 12600 | 12200 |
| stage2 | 325200 | 244167 | 195533 | 98300 | 49700 | 33500 | 25400 | 20567 | 10900 | 6200 | 4767 | 4200 | 4067 | |||
| 1.15 | stage1 | >1000000 | 666600 | 444900 | 334000 | 267500 | 134500 | 68000 | 45900 | 34800 | 28200 | 15000 | 8500 | 6600 | 5800 | 5700 |
| stage2 | 222200 | 148300 | 111333 | 89167 | 44833 | 22667 | 15300 | 11600 | 9400 | 5000 | 2833 | 2200 | 1933 | 1800 | ||
| 1.2 | stage1 | 768000 | 384400 | 256600 | 192700 | 154300 | 77600 | 39300 | 26500 | 20100 | 16300 | 8700 | 5000 | 3900 | 3400 | 3350 |
| stage2 | 192000 | 96100 | 64150 | 48175 | 38575 | 25867 | 9825 | 8833 | 6700 | 4075 | 2175 | 1250 | 975 | 1133 | 1117 | |
| 1.25 | stage1 | 503600 | 252100 | 168300 | 126400 | 101200 | 50900 | 25800 | 17400 | 13200 | 10700 | 5700 | 3300 | 2600 | 2300 | 2250 |
| stage2 | 125900 | 63025 | 42075 | 31600 | 25300 | 12725 | 6450 | 4350 | 3300 | 2675 | 1900 | 825 | 650 | 575 | 750 | |
| 1.3 | stage1 | 358100 | 179300 | 119700 | 89900 | 72000 | 36200 | 18300 | 12400 | 9400 | 7600 | 4100 | 2400 | 1800 | 1650 | 1600 |
| stage2 | 89525 | 44825 | 29925 | 22475 | 18000 | 9050 | 4575 | 3100 | 2350 | 1900 | 1025 | 600 | 600 | 550 | 533 | |
| 1.35 | stage1 | 269300 | 134800 | 90000 | 67600 | 54100 | 27200 | 13800 | 9300 | 7100 | 5800 | 3100 | 1800 | 1400 | 1250 | 1250 |
| stage2 | 67325 | 33700 | 22500 | 16900 | 13525 | 6800 | 3450 | 2325 | 1775 | 1450 | 775 | 450 | 350 | 417 | 313 | |
| 1.4 | stage1 | 210900 | 105600 | 70500 | 52900 | 42400 | 21300 | 10800 | 7300 | 5600 | 4500 | 2400 | 1400 | 1100 | 1000 | 1000 |
| stage2 | 52725 | 26400 | 17625 | 13225 | 10600 | 5325 | 2700 | 1825 | 1400 | 1125 | 600 | 350 | 367 | 250 | 250 | |
| 1.5 | stage1 | 141000 | 70600 | 47100 | 35400 | 28400 | 14300 | 7200 | 4900 | 3700 | 3000 | 1600 | 1000 | 750 | 700 | 700 |
| stage2 | 35250 | 17650 | 11775 | 8850 | 7100 | 3575 | 1800 | 1225 | 925 | 750 | 533 | 250 | 188 | 175 | 175 | |
| 2 | stage1 | 42800 | 21400 | 14300 | 10800 | 8600 | 4400 | 2200 | 1500 | 1150 | 950 | 500 | 300 | 250 | 250 | 250 |
| stage2 | 10700 | 5350 | 3575 | 2700 | 2150 | 1100 | 550 | 375 | 288 | 238 | 125 | 75 | 63 | 44 | 63 | |
| 2.5 | stage1 | 22400 | 11200 | 7500 | 5700 | 4500 | 2300 | 1200 | 800 | 600 | 500 | 300 | 200 | 150 | 150 | 150 |
| stage2 | 5600 | 2800 | 1875 | 1006 | 1125 | 575 | 212 | 141 | 150 | 88 | 33 | 2 | 26 | 17 | 26 | |
| 3 | stage1 | 14600 | 7300 | 4900 | 3700 | 3000 | 1500 | 800 | 550 | 400 | 300 | 200 | 100 | 100 | 100 | 100 |
| stage2 | 2576 | 1288 | 865 | 653 | 529 | 265 | 89 | 61 | 71 | 100 | 11 | 43 | 18 | 18 | 25 |
Table 3.
Sample size requirements for a range of RAFs and ORs. Sizes are calculated for detection of 80% power at a significance level of 5×10⁻⁸ for stage 1. Estimates are based on assumptions of 1:1 case:control ratios and a population risk of 0.05.
| OR | RAF | ||||||||||||||
|---|---|---|---|---|---|---|---|---|---|---|---|---|---|---|---|
| 0.001 | 0.002 | 0.003 | 0.004 | 0.005 | 0.01 | 0.02 | 0.03 | 0.04 | 0.05 | 0.1 | 0.2 | 0.3 | 0.4 | 0.5 | |
|
1.0
5 |
>100000 0 |
>100000 0 |
>100000 0 |
>100000 0 |
>100000 0 |
>100000 0 |
83110 0 |
56000 0 |
42460 0 |
34340 0 |
18170 0 |
10260 0 |
7850 0 |
6900 0 |
6660 0 |
| 1.1 | >100000 0 |
>100000 0 |
>100000 0 |
>100000 0 |
>100000 0 |
422300 | 21350 0 |
14390 0 |
10920 0 |
88300 | 46800 | 26600 | 2040 0 |
1800 0 |
1745 0 |
|
1.1
5 |
>100000 0 |
954500 | 637100 | 478300 | 383100 | 192700 | 97400 | 65700 | 49900 | 40400 | 21500 | 12200 | 9400 | 8400 | 8150 |
| 1.2 | >100000 0 |
550500 | 367400 | 275900 | 221000 | 111200 | 56200 | 38000 | 28800 | 23300 | 12400 | 7100 | 5500 | 4900 | 4800 |
|
1.2
5 |
721100 | 361000 | 241000 | 180900 | 144900 | 72900 | 36900 | 24900 | 18900 | 15300 | 8200 | 4700 | 3700 | 3300 | 3200 |
| 1.3 | 512800 | 256700 | 171400 | 128700 | 103100 | 51900 | 26300 | 17700 | 13500 | 10900 | 5800 | 3400 | 2600 | 2400 | 2300 |
|
1.3
5 |
385600 | 193000 | 128900 | 96800 | 77500 | 39000 | 19800 | 13400 | 10200 | 8200 | 4400 | 2600 | 2000 | 1800 | 1800 |
| 1.4 | 301900 | 151200 | 100900 | 75800 | 60700 | 30600 | 15500 | 10500 | 8000 | 6500 | 3500 | 2000 | 1600 | 1400 | 1400 |
| 1.5 | 201900 | 101100 | 67500 | 50700 | 40600 | 20500 | 10400 | 7000 | 5300 | 4300 | 2300 | 1400 | 1100 | 1000 | 1000 |
| 2 | 61300 | 30700 | 20500 | 15400 | 12400 | 6200 | 3200 | 2200 | 1650 | 1350 | 750 | 450 | 400 | 350 | 350 |
| 2.5 | 32100 | 16100 | 10800 | 8100 | 6500 | 3300 | 1700 | 1150 | 900 | 700 | 400 | 250 | 200 | 200 | 200 |
| 3 | 20900 | 10500 | 7000 | 5300 | 4200 | 2100 | 1100 | 800 | 600 | 500 | 300 | 200 | 150 | 150 | 150 |
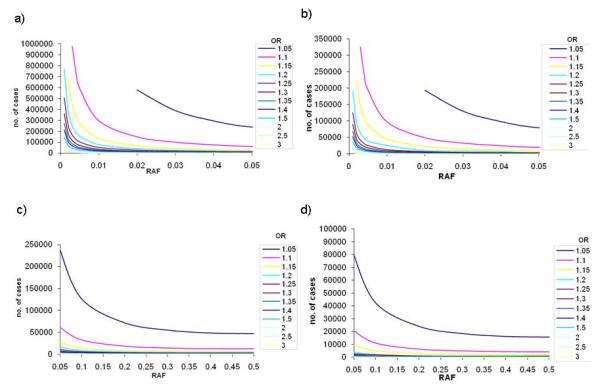
Figure 2.

Sample sizes required to reach 80% power in stage 1 (a) and (c) for a=1×10⁻⁴, and stage 2 (b) and (d) for an overall α=5×10⁻⁸ across a range of ORs and risk allele frequencies. (a) and (b) present results for lower risk allele frequencies (up to 0.05); (c) and (d) present results for common risk allele frequencies (0.05 to 0.5).
Figure 3.
Sample sizes required to reach 80% power in stage 1 (a) and (c) for α=1×10⁻⁵, and stage 2 (b) and (d) for an overall α=5×10⁻⁸ across a range of ORs and risk allele frequencies. (a) and (b) present results for lower risk allele frequencies (up to 0.05); (c) and (d) present results for common risk allele frequencies (0.05 to 0.5).
Figure 4.
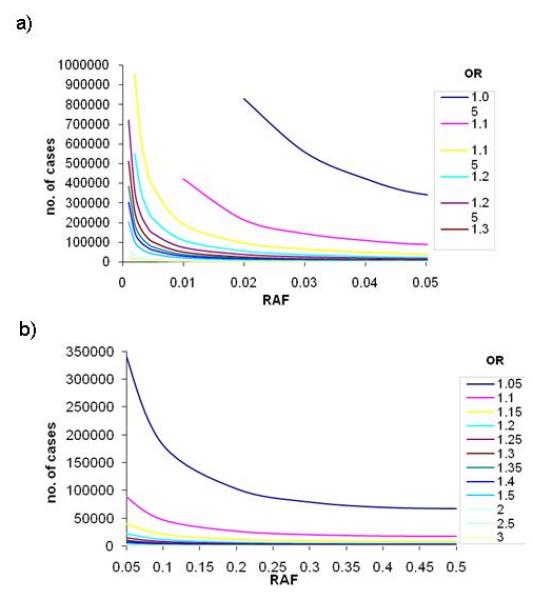
Sample sizes required to reach 80% power in stage 1 for α=5×10⁻⁸ across a range of ORs and risk allele frequencies. (a) presents results for lower risk allele frequencies (up to 0.05); (b) presents results for common risk allele frequencies (0.05 to 0.5).
Stage 1
Altering significance levels for declaring success can have profound effects on sample size requirements. As a representative example, at a significance level of 1×10⁻⁴, approximately 120,000 cases are required to detect a risk variant with RAF 0.02 and allelic OR 1.10. This sample size increases to 150,000 when the significance threshold is decreased to 1×10⁻⁵, and to 215,000 when the significance threshold is 5×10⁻⁸. Upholding the genome-wide threshold of significance of 5×10⁻⁸ requires at least 50,000 cases and an equal number of controls to detect ORs of 1.15 and below even for variants with common allele frequencies (>0.05).
Figure 2(a) shows that for low RAFs ranging from 0.001 to 0.005, the number of cases required to detect a signal at p<1×10⁻⁴ is pragmatic (~1,300 cases) for large genetic effects (OR 3.0). The identification of more commonly-encountered ORs in complex traits (1.20-1.30), however, requires between 58,000 and 125,000 cases.
Large-scale consortia are now starting to surpass combined sample sizes of 100,000. Datasets of this size provide adequate power to detect association with low frequency alleles (RAF down to 0.01) and modest effect sizes of at least 1.20 at genome-wide significance thresholds. However, required sample sizes rapidly approach 200,000 cases for RAFs below 0.01. The detection of association with alleles of MAF<0.05 and a small effect size (allelic OR of 1.05) requires samples sizes of over 340,000 cases and an equal number of controls.
Appropriate sample sizes for the detection of association signals at common variants (MAF>0.05) are more readily achievable (Figure 2c), as demonstrated by the success of GWAS meta-analyses to date. The reported median RAF of 531 signals from published GWAS studies of common diseases [Hindorff et al., 2009] was 0.36, interquartile range (IQR) 0.21-0.53, and the median OR was 1.33, IQR 1.12-1.61. The sample sizes required to obtain 80% power at genome-wide significance in order to detect these effects would be 4,118 (RAF 0.36, OR 1.33), 1,460 (RAF 0.53, OR 1.61) and 36,132 (RAF 0.21, OR 1.12) respectively (cases and controls combined).
Stage 2
We estimated replication set sample sizes required to obtain 80% power to detect associations at α=5×10⁻⁸ across the combined stage 1 and stage 2 analysis, i.e. the discovery set and the replication set. When the stage 1 threshold is set to 1×10⁻⁴, an equal number of samples are required in stage 2 to replicate the stage 1 signals for a final genome-wide threshold of 5×10⁻⁸ (Figure 2b and 2d) across all ranges of allele frequencies and ORs.
If the significance threshold for stage 1 is decreased to 1×10⁻⁵, the second stage samples sizes required to obtain a final p-value of 5×10⁻⁸ are lower. However the first stage requires a larger sample size to surpass the initial significance threshold (Figure 3b and 3d) and the combined sample sizes remain similar for both stage 1 thresholds. For example, detection of a signal with OR 1.25 and RAF 0.05 at α=1×10⁻⁵ requires 10,700 cases (and an equal number of controls) in stage 1, and 2,675 cases in stage 2 for a combined α=5×10⁻⁸. If the stage 1 significance threshold were set to 1×10⁻⁴ the respective sample sizes would be 8,700 in stage 1 and 7,118 in stage 2.
Importantly, these calculations were based on the assumption of no heterogeneity between the discovery and replication sets, and we assumed that the replication dataset was drawn from the same population as the stage 1 samples.
Heterogeneity
The relationship between sample size, RAF and OR in the presence of heterogeneity is consistent with that derived from power calculations carried out in the absence of heterogeneity (Table 4). We observe that, as expected, a larger sample size is required as heterogeneity increases. Interestingly, however, the incremental increase needed does not appear to be substantial. For example, in the frequently-encountered scenario of a common variant with a modest effect size (RAF 0.30 and OR 1.25), it is necessary to increase the case sample size by ~600 individuals when heterogeneity levels are high in comparison with that needed when all studies have similar effects. This number decreases to 400 in the presence of more modest levels of heterogeneity.
Table 4.
Total number of samples (across 10 studies with equal sample size, and 1:1 case:control ratio) required at different levels of heterogeneity (measured using I2). Results are based on 10,000 simulations.
| Allele Frequency | Meta-analysis OR | Mean I2 | Number of cases (*) |
|---|---|---|---|
| 0.30 | 1.25 | 0.11 | 3121 (**) |
| 0.21 | 3515 | ||
| 0.45 | 3639 | ||
| 0.76 | 3766 | ||
| 0.05 | 1.25 | 0.11 | 13768 (**) |
| 0.26 | 15253 | ||
| 0.50 | 15674 | ||
| 0.82 | 15971 | ||
| 0.01 | 3.00 | 0.05 | 2314 (**) |
| 0.17 | 2455 | ||
| 0.50 | 2629 | ||
| 0.80 | 2852 |
Number of cases required for 80% power to detect association at a significance level of 5×10⁻⁸.
All studies with ORs equal to the meta-analysis OR.
The increase in sample numbers required for lower RAFs (0.05) and the same genetic effect size of 1.25 in the presence of high heterogeneity is more pronounced (additional 2,000 cases needed to achieve the same power). However, this represents a smaller proportional increase in sample size (14%). Overall, the number of additional samples required to overcome loss of power due to heterogeneity is modest.
Discussion
The issue of statistical power and sample size in genetic association studies has previously been addressed in the literature. For example, Fisher and Lewis [2008] found that required sample sizes increase dramatically with decreasing levels of linkage disequilibrium (LD) between the marker and causal variant. Yang and colleagues [2010] demonstrated that when the disease prevalence is low (<0.10), a case-control study design with a 1:1 ratio of cases and controls is more powerful than a quantitative trait association study. Moonesinghe and colleagues [2008] showed that meta-analysis sample size requirements increase steeply when small genetic effects were considered and also in the presence of high levels of between-study heterogeneity. Pereira and colleagues [2009] demonstrated the importance of choosing the correct model for meta-analysis calculations in simulated combinations of several GWAS data sets.
Our findings indicate that, within our simulation framework parameters, the impact of heterogeneity on sample size requirements is not substantial. Whilst, as expected, increased sample sizes are required to counteract the effect of increasing heterogeneity, even with modest ORs of 1.25 and low allele frequencies of 0.05, only approximately 20% more samples are required to maintain the same statistical power for genome-wide significance. This observation may be underpinned by the fact that high levels of heterogeneity in our study were attained by considering a wide range of ORs among the 10 studies contributing to the meta-analysis, including easily-detectable large effect sizes. There are many parameters one can vary in simulation experiments and each can have implications in the downstream results. In our simulations, we assume a meta-analysis of studies with equal sample size. For scenarios in which studies have different sample sizes, results may vary from those presented here. In the presence of high heterogeneity, the number of samples needed is expected to depend on the sample size of the studies with the largest effect sizes. The required sample sizes may increase comparatively to those observed in our simulation study if the sample sizes of the studies with the largest effects decrease.
In the presence of substantial allelic heterogeneity, an alternative approach would be to undertake random-effects analysis which does not make an assumption of homogeneity across studies, in which case the sample sizes required may deviate from the numbers presented here. The level of heterogeneity observed in a meta-analysis should in any case be taken into account, and results interpreted with caution when the observed heterogeneity is high.
Sample size and power have been at the heart of genetic association study design for several decades. Recent advances in the field have made genome-wide scans possible and have ushered in a new era of successful complex disease locus identification. The power constraints of studies conducted thus far have led to the discovery of associations with common-frequency variants of large or modest effect size. Indeed, meta-analyses of GWAS to date have, most probably, identified the vast majority if not all risk variants with moderate effects and common allele frequencies. The formation of large-scale international consortia is now enabling the accrual of sample sizes surpassing 100,000. For example, a recent combined analysis across ~184,000 individuals identified ~180 loci affecting human height variation. As with the vast majority of other complex traits, the proportion of phenotypic variation explained by the combined set of established signals is less than 10% [Lango Allen et al., 2010]. This recurrent observation indicates that further genetic determinants of complex traits remain unidentified. Their allele frequency and effect size spectra could be diverse, with multiple common-frequency variants of small effect size, and/or low-frequency and rare variants of modest/larger effect size contributing towards this missing heritability. Using comprehensive power calculations, we find that the detection and replication of signals within these RAF and OR constraints require large sample sizes (currently achievable through large-scale collaborative efforts) in order to reach genome-wide levels of significance, and that effect size heterogeneity across meta-analysed studies drawn from similar populations does not appear to have a profound effect on sample size requirements.
Acknowledgements
The authors thank Will Rayner for help with data management and John Ioannidis for commenting on the manuscript. JA and EZ are supported by the Wellcome Trust (WT088885/Z/09/Z), KC is supported by a Botnar Fellowship and by the Wellcome Trust (WT079557MA), and AM is supported by the Wellcome Trust (WT081682/Z/06/Z).
References
- Fisher SA, Lewis CM. Power of genetic association studies in the presence of linkage disequilibrium and allelic heterogeneity. Hum Hered. 2008;66:210–222. doi: 10.1159/000143404. [DOI] [PMC free article] [PubMed] [Google Scholar]
- Gauderman WJ. Sample size requirements for matched case-control studies of gene-environment interaction. Stat Med. 2002;21:35–50. doi: 10.1002/sim.973. [DOI] [PubMed] [Google Scholar]
- Heid IM, Jackson AU, Randall JC, Winkler TW, Qi L, Steinthorsdottir V, Thorleifsson G, Zillikens MC, Speliotes EK, Mägi R, Workalemahu T, White CC, Bouatia-Naji N, Harris TB, Berndt SI, Ingelsson E, Willer CJ, Weedon MN, Luan J, Vedantam S, Esko T, Kilpeläinen TO, Kutalik Z, Li S, Monda KL, Dixon AL, Holmes CC, Kaplan LM, Liang L, Min JL, Moffatt MF, Molony C, Nicholson G, Schadt EE, Zondervan KT, Feitosa MF, Ferreira T, Allen HL, Weyant RJ, Wheeler E, Wood AR, MAGIC. Estrada K, Goddard ME, Lettre G, Mangino M, Nyholt DR, Purcell S, Smith AV, Visscher PM, Yang J, McCarroll SA, Nemesh J, Voight BF, Absher D, Amin N, Aspelund T, Coin L, Glazer NL, Hayward C, Heard-Costa NL, Hottenga JJ, Johansson A, Johnson T, Kaakinen M, Kapur K, Ketkar S, Knowles JW, Kraft P, Kraja AT, Lamina C, Leitzmann MF, McKnight B, Morris AP, Ong KK, Perry JR, Peters MJ, Polasek O, Prokopenko I, Rayner NW, Ripatti S, Rivadeneira F, Robertson NR, Sanna S, Sovio U, Surakka I, Teumer A, van Wingerden S, Vitart V, Zhao JH, Cavalcanti-Proença C, Chines PS, Fisher E, Kulzer JR, Lecoeur C, Narisu N, Sandholt C, Scott LJ, Silander K, Stark K, Tammesoo ML, Teslovich TM, Timpson NJ, Watanabe RM, Welch R, Chasman DI, Cooper MN, Jansson JO, Kettunen J, Lawrence RW, Pellikka N, Perola M, Vandenput L, Alavere H, Almgren P, Atwood LD, Bennett AJ, Biffar R, Bonnycastle LL, Bornstein SR, Buchanan TA, Campbell H, Day IN, Dei M, Dörr M, Elliott P, Erdos MR, Eriksson JG, Freimer NB, Fu M, Gaget S, Geus EJ, Gjesing AP, Grallert H, Grässler J, Groves CJ, Guiducci C, Hartikainen AL, Hassanali N, Havulinna AS, Herzig KH, Hicks AA, Hui J, Igl W, Jousilahti P, Jula A, Kajantie E, Kinnunen L, Kolcic I, Koskinen S, Kovacs P, Kroemer HK, Krzelj V, Kuusisto J, Kvaloy K, Laitinen J, Lantieri O, Lathrop GM, Lokki ML, Luben RN, Ludwig B, McArdle WL, McCarthy A, Morken MA, Nelis M, Neville MJ, Paré G, Parker AN, Peden JF, Pichler I, Pietiläinen KH, Platou CG, Pouta A, Ridderstråle M, Samani NJ, Saramies J, Sinisalo J, Smit JH, Strawbridge RJ, Stringham HM, Swift AJ, Teder-Laving M, Thomson B, Usala G, van Meurs JB, van Ommen GJ, Vatin V, Volpato CB, Wallaschofski H, Walters GB, Widen E, Wild SH, Willemsen G, Witte DR, Zgaga L, Zitting P, Beilby JP, James AL, Kähönen M, Lehtimäki T, Nieminen MS, Ohlsson C, Palmer LJ, Raitakari O, Ridker PM, Stumvoll M, Tönjes A, Viikari J, Balkau B, Ben-Shlomo Y, Bergman RN, Boeing H, Smith GD, Ebrahim S, Froguel P, Hansen T, Hengstenberg C, Hveem K, Isomaa B, Jørgensen T, Karpe F, Khaw KT, Laakso M, Lawlor DA, Marre M, Meitinger T, Metspalu A, Midthjell K, Pedersen O, Salomaa V, Schwarz PE, Tuomi T, Tuomilehto J, Valle TT, Wareham NJ, Arnold AM, Beckmann JS, Bergmann S, Boerwinkle E, Boomsma DI, Caulfield MJ, Collins FS, Eiriksdottir G, Gudnason V, Gyllensten U, Hamsten A, Hattersley AT, Hofman A, Hu FB, Illig T, Iribarren C, Jarvelin MR, Kao WH, Kaprio J, Launer LJ, Munroe PB, Oostra B, Penninx BW, Pramstaller PP, Psaty BM, Quertermous T, Rissanen A, Rudan I, Shuldiner AR, Soranzo N, Spector TD, Syvanen AC, Uda M, Uitterlinden A, Völzke H, Vollenweider P, Wilson JF, Witteman JC, Wright AF, Abecasis GR, Boehnke M, Borecki IB, Deloukas P, Frayling TM, Groop LC, Haritunians T, Hunter DJ, Kaplan RC, North KE, O’Connell JR, Peltonen L, Schlessinger D, Strachan DP, Hirschhorn JN, Assimes TL, Wichmann HE, Thorsteinsdottir U, van Duijn CM, Stefansson K, Cupples LA, Loos RJ, Barroso I, McCarthy MI, Fox CS, Mohlke KL, Lindgren CM. Meta-analysis identifies 13 new loci associated with waist-hip ratio and reveals sexual dimorphism in the genetic basis of fat distribution. Nat Genet. 2010;42:949–960. doi: 10.1038/ng.685. [DOI] [PMC free article] [PubMed] [Google Scholar]
- Higgins JP, Thompson SG, Deeks JJ, Altman DG. Measuring inconsistency in meta-analyses. Br. Med. J. 2003;327:557–560. doi: 10.1136/bmj.327.7414.557. [DOI] [PMC free article] [PubMed] [Google Scholar]
- Hindorff LA, Sethupathy P, Junkins HA, Ramos EM, Mehta JP, Collins FS, Manolio TA. Potential etiologic and functional implications of genome-wide association loci for human diseases and traits. Proc Natl Acad Sci U S A. 2009;106:9362–9367. doi: 10.1073/pnas.0903103106. [DOI] [PMC free article] [PubMed] [Google Scholar]
- Houlston RS, Cheadle J, Dobbins SE, Tenesa A, Jones AM, Howarth K, Spain SL, Broderick P, Domingo E, Farrington S, Prendergast JG, Pittman AM, Theodoratou E, Smith CG, Olver B, Walther A, Barnetson RA, Churchman M, Jaeger EE, Penegar S, Barclay E, Martin L, Gorman M, Mager R, Johnstone E, Midgley R, Niittymäki I, Tuupanen S, Colley J, Idziaszczyk S, COGENT Consortium. Thomas HJ, Lucassen AM, Evans DG, Maher ER, CORGI Consortium. COIN Collaborative Group. COINB Collaborative Group. Maughan T, Dimas A, Dermitzakis E, Cazier JB, Aaltonen LA, Pharoah P, Kerr DJ, Carvajal-Carmona LG, Campbell H, Dunlop MG, Tomlinson IP. Meta-analysis of three genome-wide association studies identifies susceptibility loci for colorectal cancer at 1q41, 3q26.2, 12q13.13 and 20q13.33. Nat Genet. 2010;42:973–977. doi: 10.1038/ng.670. [DOI] [PMC free article] [PubMed] [Google Scholar]
- Lango Allen H, Estrada K, Lettre G, Berndt SI, Weedon MN, Rivadeneira F, Willer CJ, Jackson AU, Vedantam S, Raychaudhuri S, Ferreira T, Wood AR, Weyant RJ, Segrè AV, Speliotes EK, Wheeler E, Soranzo N, Park JH, Yang J, Gudbjartsson D, Heard-Costa NL, Randall JC, Qi L, Smith A Vernon, Mägi R, Pastinen T, Liang L, Heid IM, Luan J, Thorleifsson G, Winkler TW, Goddard ME, Lo K Sin, Palmer C, Workalemahu T, Aulchenko YS, Johansson A, Zillikens M Carola, Feitosa MF, Esko T, Johnson T, Ketkar S, Kraft P, Mangino M, Prokopenko I, Absher D, Albrecht E, Ernst F, Glazer NL, Hayward C, Hottenga JJ, Jacobs KB, Knowles JW, Kutalik Z, Monda KL, Polasek O, Preuss M, Rayner NW, Robertson NR, Steinthorsdottir V, Tyrer JP, Voight BF, Wiklund F, Xu J, Zhao J Hua, Nyholt DR, Pellikka N, Perola M, Perry JR, Surakka I, Tammesoo ML, Altmaier EL, Amin N, Aspelund T, Bhangale T, Boucher G, Chasman DI, Chen C, Coin L, Cooper MN, Dixon AL, Gibson Q, Grundberg E, Hao K, Junttila M Juhani, Kaplan LM, Kettunen J, König IR, Kwan T, Lawrence RW, Levinson DF, Lorentzon M, McKnight B, Morris AP, Müller M, Ngwa J Suh, Purcell S, Rafelt S, Salem RM, Salvi E, Sanna S, Shi J, Sovio U, Thompson JR, Turchin MC, Vandenput L, Verlaan DJ, Vitart V, White CC, Ziegler A, Almgren P, Balmforth AJ, Campbell H, Citterio L, De Grandi A, Dominiczak A, Duan J, Elliott P, Elosua R, Eriksson JG, Freimer NB, Geus EJ, Glorioso N, Haiqing S, Hartikainen AL, Havulinna AS, Hicks AA, Hui J, Igl W, Illig T, Jula A, Kajantie E, Kilpeläinen TO, Koiranen M, Kolcic I, Koskinen S, Kovacs P, Laitinen J, Liu J, Lokki ML, Marusic A, Maschio A, Meitinger T, Mulas A, Paré G, Parker AN, Peden JF, Petersmann A, Pichler I, Pietiläinen KH, Pouta A, Ridderstråle M, Rotter JI, Sambrook JG, Sanders AR, Schmidt C Oliver, Sinisalo J, Smit JH, Stringham HM, Walters G Bragi, Widen E, Wild SH, Willemsen G, Zagato L, Zgaga L, Zitting P, Alavere H, Farrall M, McArdle WL, Nelis M, Peters MJ, Ripatti S, van Meurs JB, Aben KK, Ardlie KG, Beckmann JS, Beilby JP, Bergman RN, Bergmann S, Collins FS, Cusi D, den Heijer M, Eiriksdottir G, Gejman PV, Hall AS, Hamsten A, Huikuri HV, Iribarren C, Kähönen M, Kaprio J, Kathiresan S, Kiemeney L, Kocher T, Launer LJ, Lehtimäki T, Melander O, Mosley TH, Jr, Musk AW, Nieminen MS, O’Donnell CJ, Ohlsson C, Oostra B, Palmer LJ, Raitakari O, Ridker PM, Rioux JD, Rissanen A, Rivolta C, Schunkert H, Shuldiner AR, Siscovick DS, Stumvoll M, Tönjes A, Tuomilehto J, van Ommen GJ, Viikari J, Heath AC, Martin NG, Montgomery GW, Province MA, Kayser M, Arnold AM, Atwood LD, Boerwinkle E, Chanock SJ, Deloukas P, Gieger C, Grönberg H, Hall P, Hattersley AT, Hengstenberg C, Hoffman W, Mark Lathrop G, Salomaa V, Schreiber S, Uda M, Waterworth D, Wright AF, Assimes TL, Barroso I, Hofman A, Mohlke KL, Boomsma DI, Caulfield MJ, Cupples L Adrienne, Erdmann J, Fox CS, Gudnason V, Gyllensten U, Harris TB, Hayes RB, Jarvelin MR, Mooser V, Munroe PB, Ouwehand WH, Penninx BW, Pramstaller PP, Quertermous T, Rudan I, Samani NJ, Spector TD, Völzke H, Watkins H, Wilson JF, Groop LC, Haritunians T, Hu FB, Kaplan RC, Metspalu A, North KE, Schlessinger D, Wareham NJ, Hunter DJ, O’Connell JR, Strachan DP, Wichmann HE, Borecki IB, van Duijn CM, Schadt EE, Thorsteinsdottir U, Peltonen L, Uitterlinden AG, Visscher PM, Chatterjee N, Loos RJ, Boehnke M, McCarthy MI, Ingelsson E, Lindgren CM, Abecasis GR, Stefansson K, Frayling TM, Hirschhorn JN. Hundreds of variants clustered in genomic loci and biological pathways affect human height. Nature. 2010;467:832–838. doi: 10.1038/nature09410. [DOI] [PMC free article] [PubMed] [Google Scholar]
- Moonesinghe R, Khoury MJ, Liu T, Ioannidis JP. Required sample size and nonreplicability thresholds for heterogeneous genetic associations. Proc Natl Acad Sci U S A. 2008;105:617–622. doi: 10.1073/pnas.0705554105. [DOI] [PMC free article] [PubMed] [Google Scholar]
- Pereira TV, Patsopoulos NA, Salanti G, Ioannidis JP. Discovery properties of genome-wide association signals from cumulatively combined data sets. Am. J Epidemiol. 2009;170:1197–1206. doi: 10.1093/aje/kwp262. [DOI] [PMC free article] [PubMed] [Google Scholar]
- Preuss M, König IR, Thompson JR, Erdmann J, Absher D, Assimes TL, Blankenberg S, Boerwinkle E, Chen L, Cupples LA, Hall AS, Halperin E, Hengstenberg C, Holm H, Laaksonen R, Li M, März W, McPherson R, Musunuru K, Nelson CP, Burnett MS, Epstein SE, O’Donnell CJ, Quertermous T, Rader DJ, Roberts R, Schillert A, Stefansson K, Stewart AF, Thorleifsson G, Voight BF, Wells GA, Ziegler A, Kathiresan S, Reilly MP, Samani NJ, Schunkert H, CARDIoGRAM Consortium Design of the Coronary ARtery DIsease Genome-Wide Replication And Meta-Analysis (CARDIoGRAM) Study: A Genome-wide association meta-analysis involving more than 22 000 cases and 60 000 controls. Circ Cardiovasc Genet. 2010;3:475–483. doi: 10.1161/CIRCGENETICS.109.899443. [DOI] [PMC free article] [PubMed] [Google Scholar]
- Skol AD, Scott LJ, Abecasis GR, Boehnke M. Joint analysis is more efficient than replication-based analysis for two-stage genome-wide association studies. Nat. Genet. 2006;38:209–213. doi: 10.1038/ng1706. [DOI] [PubMed] [Google Scholar]
- Voight BF, Scott LJ, Steinthorsdottir V, Morris AP, Dina C, Welch RP, Zeggini E, Huth C, Aulchenko YS, Thorleifsson G, McCulloch LJ, Ferreira T, Grallert H, Amin N, Wu G, Willer CJ, Raychaudhuri S, McCarroll SA, Langenberg C, Hofmann OM, Dupuis J, Qi L, Segrè AV, van Hoek M, Navarro P, Ardlie K, Balkau B, Benediktsson R, Bennett AJ, Blagieva R, Boerwinkle E, Bonnycastle LL, Boström K Bengtsson, Bravenboer B, Bumpstead S, Burtt NP, Charpentier G, Chines PS, Cornelis M, Couper DJ, Crawford G, Doney AS, Elliott KS, Elliott AL, Erdos MR, Fox CS, Franklin CS, Ganser M, Gieger C, Grarup N, Green T, Griffin S, Groves CJ, Guiducci C, Hadjadj S, Hassanali N, Herder C, Isomaa B, Jackson AU, Johnson PR, Jørgensen T, Kao WH, Klopp N, Kong A, Kraft P, Kuusisto J, Lauritzen T, Li M, Lieverse A, Lindgren CM, Lyssenko V, Marre M, Meitinger T, Midthjell K, Morken MA, Narisu N, Nilsson P, Owen KR, Payne F, Perry JR, Petersen AK, Platou C, Proença C, Prokopenko I, Rathmann W, Rayner NW, Robertson NR, Rocheleau G, Roden M, Sampson MJ, Saxena R, Shields BM, Shrader P, Sigurdsson G, Sparsø T, Strassburger K, Stringham HM, Sun Q, Swift AJ, Thorand B, Tichet J, Tuomi T, van Dam RM, van Haeften TW, van Herpt T, van Vliet-Ostaptchouk JV, Walters GB, Weedon MN, Wijmenga C, Witteman J, Bergman RN, Cauchi S, Collins FS, Gloyn AL, Gyllensten U, Hansen T, Hide WA, Hitman GA, Hofman A, Hunter DJ, Hveem K, Laakso M, Mohlke KL, Morris AD, Palmer CN, Pramstaller PP, Rudan I, Sijbrands E, Stein LD, Tuomilehto J, Uitterlinden A, Walker M, Wareham NJ, Watanabe RM, Abecasis GR, Boehm BO, Campbell H, Daly MJ, Hattersley AT, Hu FB, Meigs JB, Pankow JS, Pedersen O, Wichmann HE, Barroso I, Florez JC, Frayling TM, Groop L, Sladek R, Thorsteinsdottir U, Wilson JF, Illig T, Froguel P, van Duijn CM, Stefansson K, Altshuler D, Boehnke M, McCarthy MI, MAGIC investigators. GIANT Consortium Twelve type 2 diabetes susceptibility loci identified through large-scale association analysis. Nat. Genet. 2010;42:579–589. doi: 10.1038/ng.609. [DOI] [PMC free article] [PubMed] [Google Scholar]
- Yang J, Benyamin B, McEvoy BP, Gordon S, Henders AK, Nyholt DR, Madden PA, Heath AC, Martin NG, Montgomery GW, Goddard ME, Visscher PM. Common SNPs explain a large proportion of the heritability for human height. Nat Genet. 2010;42:565–569. doi: 10.1038/ng.608. [DOI] [PMC free article] [PubMed] [Google Scholar]
- Yang J, Wray NR, Visscher PM. Comparing apples and oranges: equating the power of case-control and quantitative trait association studies. Genet Epidemiol. 2010;34:254–7. doi: 10.1002/gepi.20456. [DOI] [PubMed] [Google Scholar]
- WTCCC Genome-wide association study of 14,000 cases of seven common diseases and 3,000 shared controls. Nature. 2007;447:661–678. doi: 10.1038/nature05911. [DOI] [PMC free article] [PubMed] [Google Scholar]