Abstract
Background
Obesity, hypertension, and hypertriglyceridemia are important risk factors for type 2 diabetes (T2D). We wanted to assess the risk associated with these three factors alone and in combination, and the relative importance of these and several other risk factors (eg, nonfasting glucose) as predictors of T2D.
Methods
Risk factors in a Norwegian population (n = 109,796) aged 40–45 years were measured in health studies in 1995–1999. Blood glucose-lowering drugs dispensed in 2004–2009 were used to estimate the incidence of T2D. Groups based on combinations of body mass index (BMI), diastolic blood pressure, and triglycerides were defined by using the 50% and 90% quantiles for each variable for men and women. The relative importance of BMI, triglycerides, total cholesterol, high-density lipoprotein cholesterol, glucose, blood pressure, and year of birth for predicting T2D was assessed using deviance from univariate and multivariate logistic regression models. Height, weight, and blood pressure were measured. All biomarkers were measured in nonfasting blood samples.
Results
In the various groups of BMI, triglycerides, and diastolic blood pressure, the incidence of T2D ranged from 0.5% to 19.7% in men and from 0.15% to 21.8% in women. BMI was the strongest predictor of incident T2D, followed by triglyceride levels in women and glucose levels in men. The inclusion of risk factors other than BMI, glucose, triglycerides, and blood pressure in multivariate models only marginally improved the prediction.
Conclusion
BMI was the strongest predictor of type 2 diabetes. At defined levels of BMI, the incidence of T2D varied substantially with triglyceride levels and blood pressure. Thus, controlling triglycerides and blood pressure in middle-aged individuals should be targeted to prevent later onset of T2D.
Keywords: type 2 diabetes, body mass index, triglycerides, blood pressure, glucose, risk factors
Background
The global prevalence of diabetes is rapidly increasing.1,2 In Norway, the prevalence of the population treated with blood glucose-lowering drugs increased from 2.4% in 2004 to 3.1% in 2010.3,4 Both type 1 and type 2 diabetes (T2D) may occur at any age, but T2D is mainly diagnosed after the age of 40 years, while type 1 diabetes is more common in children and young adults.2,5 T2D is a metabolic disorder, with high blood glucose levels caused by insulin resistance and a relative deficiency of insulin. According to the American Diabetes Association, T2D accounts for at least 90% of all cases of diabetes.6 Hypertension and dyslipidemia, such as low high-density lipoprotein (HDL) levels and hypertriglyceridemia are risk factors for T2D,7–9 and also increase the risk of cardiovascular complications in patients with diabetes.10
Overweight and obesity are also strongly associated with T2D.11,12 Early identification of the population at risk is important in preventing T2D.13 An Icelandic study showed that high levels of body mass index (BMI), triglycerides, and blood pressure were present long before the onset of T2D.14
Obesity is an important risk factor for T2D, but a question for further research is why every individual with obesity does not develop T2D.15 The aim of our study was to quantify the risk of T2D associated with various combinations of levels of BMI, triglycerides, and blood pressure, in a Norwegian cohort of men and women aged 40–45 years. We also wanted to quantify the relative importance of these three risk factors, plus others, such as nonfasting glucose, as predictors for T2D.
Methods
Variables and study population
Measurements of weight, height, blood pressure, triglycerides, total cholesterol, HDL cholesterol, and glucose in the period 1995–1999 were obtained from Norwegian health studies. All biomarkers were measured in nonfasting blood samples. Questionnaires completed by participants in the studies included information about cardiovascular disease, diabetes, and use of antihypertensives. The health study program began in 1985, but measurements of glucose and HDL cholesterol were not included before 1994 and 1995, respectively. All Norwegian men and women aged 40–42 years and some aged 43–45 years were invited to participate in the studies. Fifteen of the 19 Norwegian counties participated in the program in 1995–1999 and are represented in our study population. A description of the health study in the county of Nordland has been published.16 The response rate declined from about 80% in 1985 to 60% in 1999.
Weight, height, and blood pressure were measured at the screening site according to standardized procedures. After a 2-minute rest, three recordings of systolic and diastolic blood pressure were performed at one-minute intervals using an automated device. The average of the second and third measurement was used in our study. Weight was measured to the nearest 0.5 kg, and height to the nearest cm. BMI was calculated as weight (kg) divided by height (m) squared.
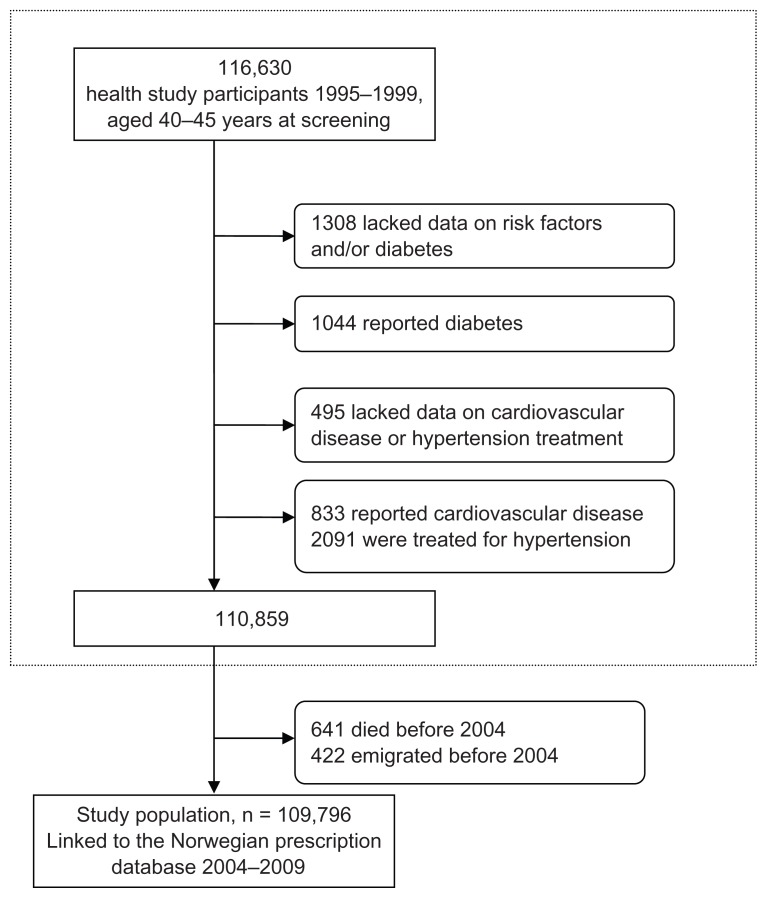
A total of 116,630 individuals were candidates for the study population. Individuals who reported cardiovascular disease, diabetes, and antihypertensive use at screening were excluded. Individuals with missing data and those who died or emigrated before January 1, 2004 were also excluded. Overall, 6834 individuals were excluded, leaving 109,796 for analysis (50,711 men and 59,085 women). A flow chart of the study population is given in eFigure 1.
Information from the health studies and the Norwegian Prescription Database (NorPD; see below) were linked using the unique 11-digit personal identification number assigned to every person living in Norway at birth or immigration. All participants included from the health studies gave consent for use of their data in research. Permission for linkage was given by the Norwegian Data Inspectorate and the Regional Committee for Medical Research Ethics.
Estimating T2D incidence
Since January 2004, all pharmacies in Norway have been obliged to send information about every dispensed prescription to the NorPD electronically.3 Blood glucose-lowering drugs are classified in Anatomical Therapeutic Chemical classification group A10. Insulins are classified in subgroup A10A and noninsulins in A10B.17 Individuals who had at least one prescription for a blood glucose-lowering drug (A10) dispensed in the period January 1, 2004 to December 31, 2009 were defined in our study as having T2D.
Statistical analysis
Ranking of risk factors by deviance
The variables described above were ranked according to the strength of their association with incident T2D by using the deviance from univariate logistic regression models. Deviance is a measure of how well the statistical model describes the observed data, with a lower deviance implying a better fit (see Appendix for details). This was done separately for men and women. The variables were entered as continuous. Triglycerides were log-transformed due to their skewed distribution.
The effects of each additional risk factor when the more important risk factors were accounted for were assessed as follows: starting with a model including only the variable yielding the smallest deviance, all the other variables were added, one by one. The variable that led to the largest decrease in deviance was added at each step. No interaction terms were included.
T2D risk according to BMI, triglycerides, and blood pressure
First, each individual was allocated to one of three BMI groups (B1, B2, or B3), one of three triglyceride groups (T1, T2, or T3), and one of three diastolic blood pressure groups (D1, D2, or D3), based on the 50% and 90% quantiles of the respective variables for each gender. They were further allocated to one of the 27 combined BiTjDk groups, where i, j, and k = 1, 2, or 3. For example, a person with a BMI below the 50% quantile (B1), triglycerides above the 90% quantile (T3), and diastolic blood pressure between the 50% and 90% quantile (D2) was allocated to group B1T3D2. The incidence of T2D was calculated for each BiTjDk group. The relative risks associated with belonging to group BiTjDk were calculated with B1T1D1 and BiT1D1 as reference groups, adjusted for year of birth, HDL cholesterol, total cholesterol, and glucose. Robust Poisson regression18 was used to calculate relative risks. The motivation for the asymmetric choice of quantiles was to have sufficiently large reference groups (BiT1D1, i = 1, 2, 3) to contain a reasonable number of individuals who later developed T2D. Relative risks were chosen rather than odds ratios because relative risks are easier to interpret, but because the Poisson regression did not describe the relationship between glucose as a continuous variable and T2D well, we entered glucose as a 12-level categorical variable defined by the 10, 20, 30, 40, 50, 60, 70, 80, 90, 95, and 99% quantiles by gender. The other variables adjusted for were entered as continuous.
The analyses were done in R, using the generalized linear model function to compute relative risks and deviances, and the vcovHC function of the sandwich package was used to compute robust standard error estimates for the relative risk estimates.18–20
Results
Analyses of deviance
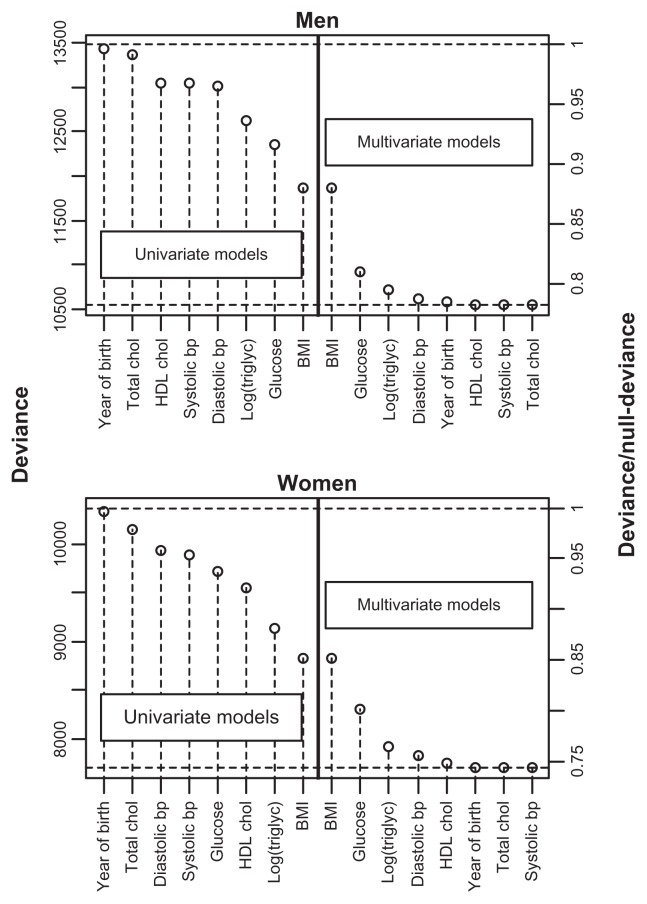
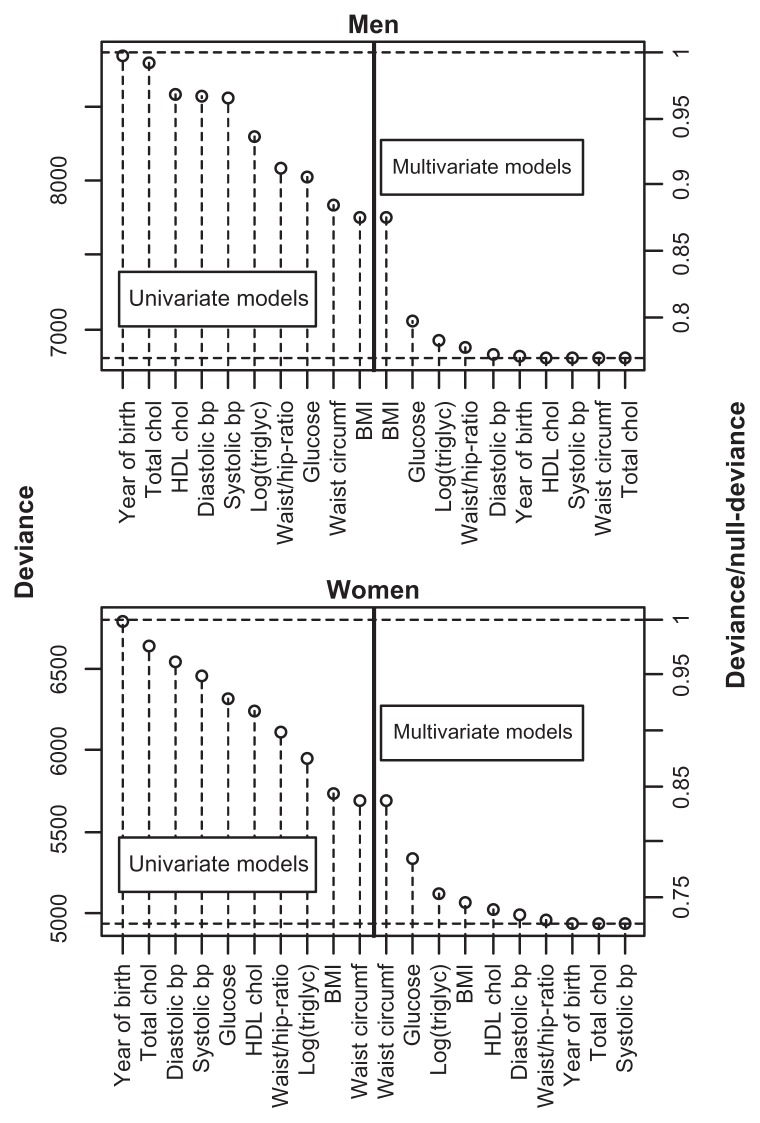
BMI was the single variable that best predicted T2D in both genders, followed by triglycerides in women and glucose in men (Figure 1). In women, HDL cholesterol was also a better predictor than glucose. In the multivariate model, glucose was the second most important variable for both men and women (Figure 1). For women, this indicates that knowing only their triglyceride or HDL cholesterol level was more informative than knowing only the glucose level with respect to predicting T2D. However, if the BMI was already known, additional information about glucose was more important for prediction purposes than additional information about triglycerides. Little was gained by adding variables other than BMI, glucose, triglycerides, and blood pressure (Figure 1).
Figure 1.
Deviance from univariate and multivariate logistic regression models with incident T2D as the outcome variable and the explanatory variables given on the x-axis.
Notes: For the multivariate models, the variables to the left for, and including, the actual variable were included in the model. The upper and lower dashed horizontal lines show the null-deviance and the deviance of the model with all variables included, respectively. On the right axes, the deviance is divided by the null-deviance.
Abbreviations: BMI, body mass index; bp, blood pressure; chol, cholesterol; triglyc, triglycerides; T2D, type 2 diabetes; HDL, high-density lipoprotein.
Analyses of groups
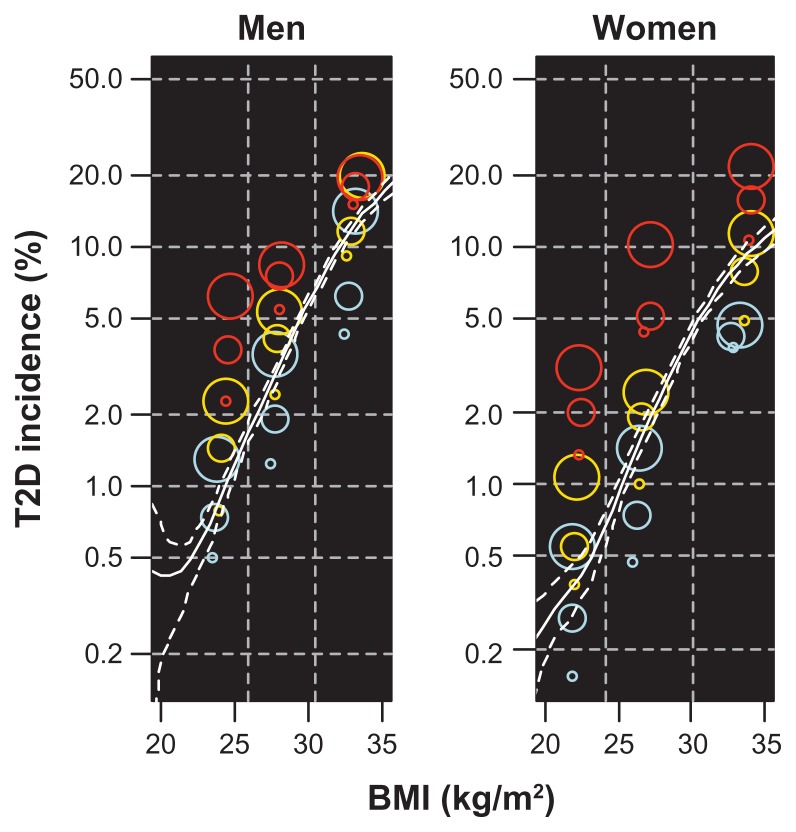
The BMI, triglyceride, and diastolic blood pressure groups, used to define the BiTjDk groups, are given in Table 1, and baseline characteristics for selected groups are given in Table 2. A total of 2523 subjects (2.3% of the study population) had at least one prescription of blood glucose-lowering drugs dispensed between January 1, 2004 and December 31, 2009, indicating that they had developed T2D. The prevalence varied from 0.15% in the female B1T1D1 group to 21.8% in the female B3T3D3 group (Table 3, Figure 2). For both men and women, a BMI around 32–33 kg/m2 at baseline, combined with the lowest levels of blood pressure and triglycerides, was associated with approximately the same incidence of T2D as a BMI of 20–23 kg/m2 combined with the highest level of blood pressure and triglycerides (Figure 2). The incidence of T2D in the B3T3D3 group compared with the B1T1D1 group was 39 times higher in men and 142 times higher in women, decreasing to relative risks of 18 and 43, respectively, after adjustment. Within the three BMI groups, the incidence of T2D varied substantially with blood pressure and triglyceride levels (Table 3). At defined levels of BMI and triglycerides, the T2D incidence increased with increasing blood pressure, and at defined levels of BMI and blood pressure, the T2D incidence increased with increasing levels of triglycerides (Table 3, Figure 2).
Table 1.
Body mass index, triglycerides, and diastolic blood pressure groups defined by 50% and 90% quantiles, by gender
| Men | Women | |||||
|---|---|---|---|---|---|---|
|
|
|
|||||
| Group 1 | Group 2 | Group 3 | Group 1 | Group 2 | Group 3 | |
| Body mass index (kg/m2) | ≤25.9 | 26.0–30.4 | ≥30.5 | ≤24.1 | 24.2–30.1 | ≥30.2 |
| Triglycerides (mmol/L) | ≤1.80 | 1.81–3.74 | ≥3.75 | ≤1.14 | 1.15–2.26 | ≥2.27 |
| Diastolic blood pressure (mmHg) | ≤77.0 | 77.1–89.5 | ≥89.6 | ≤71.5 | 71.6–84.5 | ≥84.6 |
Table 2.
Baseline characteristics for subjects in the lowest and highest groups of body mass index (B), triglycerides (T), and diastolic blood pressure (D), and for the total study population (subjects with and without T2D, n = 109,796)
| Combinations of BMI, triglycerides, and diastolic blood pressure | Total population | |||||||||
|---|---|---|---|---|---|---|---|---|---|---|
|
|
|
|||||||||
| B1T1D1 | B1T1D3 | B1T3D1 | B1T3D3 | B3T1D1 | B3T1D3 | B3T3D1 | B3T3D3 | No T2D | T2D | |
| Men | ||||||||||
| n | 10,167 | 856 | 533 | 143 | 467 | 190 | 315 | 284 | 49,216 | 1495 |
| Deaths by 2004 (%) | 0.7 | 1.6 | 1.3 | 0.0 | 0.4 | 1.0 | 0.3 | 0.4 | ||
| Age in 2004 (years) | 47.8 | 48.6 | 47.8 | 48.7 | 47.5 | 48.0 | 47.5 | 48.1 | 48.0 | 48.3 |
| BMI (kg/m2) | 23.4 | 23.8 | 24.3 | 24.6 | 32.4 | 33.2 | 33.0 | 33.5 | 26.1 | 30.1 |
| Systolic BP (mmHg) | 122.7 | 148.1 | 125.3 | 147.8 | 127.9 | 154.6 | 128.5 | 154.7 | 131.3 | 139.0 |
| Diastolic BP (mmHg) | 69.6 | 94.6 | 70.7 | 95.5 | 71.2 | 96.6 | 71.8 | 97.0 | 77.3 | 82.9 |
| Glucose (mmol/L) | 5.1 | 5.3 | 5.4 | 5.7 | 5.2 | 5.4 | 5.6 | 5.9 | 5.2 | 6.5 |
| Triglycerides (mmol/L) | 1.2 | 1.2 | 4.8 | 5.1 | 1.4 | 1.4 | 5.2 | 5.4 | 2.1 | 3.2 |
| HDL cholesterol (mmol/L) | 1.3 | 1.4 | 1.0 | 1.0 | 1.2 | 1.2 | 0.9 | 1.0 | 1.2 | 1.1 |
| Total cholesterol (mmol/L) | 5.3 | 5.6 | 6.2 | 6.5 | 5.4 | 5.7 | 6.4 | 6.6 | 5.7 | 6.0 |
| Women | ||||||||||
| n | 11,026 | 1114 | 612 | 129 | 405 | 151 | 427 | 412 | 58,057 | 1028 |
| Deaths by 2004 (%) | 0.3 | 0.5 | 0.5 | 3.0 | 0.0 | 0.7 | 0.7 | 0.0 | ||
| Age in 2004 (years) | 47.8 | 48.5 | 47.8 | 48.2 | 47.5 | 48.2 | 47.6 | 48.3 | 48.0 | 48.3 |
| BMI (kg/m2) | 21.8 | 21.9 | 22.3 | 22.4 | 32.9 | 33.2 | 33.9 | 34.1 | 24.7 | 30.8 |
| Systolic BP (mmHg) | 112.8 | 141.4 | 114.9 | 142.5 | 119.4 | 149.7 | 121.2 | 149.4 | 121.8 | 132.5 |
| Diastolic BP (mmHg) | 64.1 | 90.4 | 64.7 | 90.9 | 65.3 | 91.4 | 65.8 | 92.3 | 71.9 | 78.6 |
| Glucose (mmol/L) | 5.0 | 5.1 | 5.2 | 5.4 | 5.0 | 5.2 | 5.5 | 5.6 | 5.1 | 6.0 |
| Triglycerides (mmol/L) | 0.8 | 0.8 | 2.9 | 3.0 | 0.9 | 0.9 | 3.3 | 3.4 | 1.3 | 2.4 |
| HDL cholesterol (mmol/L) | 1.6 | 1.7 | 1.2 | 1.3 | 1.4 | 1.4 | 1.1 | 1.1 | 1.5 | 1.2 |
| Total cholesterol (mmol/L) | 5.0 | 5.2 | 5.7 | 5.9 | 5.1 | 5.3 | 6.0 | 6.2 | 5.3 | 5.8 |
Abbreviations: BP, blood pressure; BMI, body mass index; HDL, high-density lipoprotein.
Table 3.
Incidence and relative risk of T2D in groups of BMI (B), triglycerides (T), and diastolic blood pressure (D)
| Group | n | Cases | Pcta | RRb | RRc (95% CI) | RRd | RRe (95% CI) |
|---|---|---|---|---|---|---|---|
| Men | |||||||
| B1T1D1 | 10,167 | 51 | 0.50 | Ref | Ref | Ref | Ref |
| B1T1D2 | 5175 | 38 | 0.73 | 1.5 | 1.4 (0.9–2.1) | 1.5 | 1.4 (0.9–2.1) |
| B1T1D3 | 856 | 11 | 1.3 | 2.6 | 2.3 (1.2–4.4) | 2.6 | 2.3 (1.2–4.4) |
| B1T2D1 | 4716 | 37 | 0.78 | 1.6 | 1.3 (0.8–1.9) | 1.6 | 1.3 (0.8–1.9) |
| B1T2D2 | 3039 | 44 | 1.4 | 2.9 | 2.2 (1.5–3.3) | 2.9 | 2.2 (1.5–3.3) |
| B1T2D3 | 659 | 15 | 2.3 | 4.5 | 3.3 (1.9–5.7) | 4.5 | 3.3 (1.9–5.7) |
| B1T3D1 | 533 | 12 | 2.3 | 4.5 | 2.8 (1.5–5.2) | 4.5 | 2.8 (1.5–5.2) |
| B1T3D2 | 512 | 19 | 3.7 | 7.4 | 4.8 (2.8–8.0) | 7.4 | 4.8 (2.8–8.0) |
| B1T3D3 | 143 | 9 | 6.3 | 12.5 | 6.5 (3.4–12.6) | 12.5 | 6.5 (3.4–12.6) |
| B2T1D1 | 4045 | 50 | 1.2 | 2.5 | 2.4 (1.6–3.5) | Ref | Ref |
| B2T1D2 | 3112 | 59 | 1.9 | 3.8 | 3.5 (2.4–5.0) | 1.5 | 1.5 (1.0–2.1) |
| B2T1D3 | 765 | 27 | 3.5 | 7.0 | 6.3 (4.0–10.0) | 2.9 | 2.7 (1.7–4.2) |
| B2T2D1 | 4082 | 99 | 2.4 | 4.8 | 3.8 (2.7–5.4) | 2.0 | 1.6 (1.1–2.2) |
| B2T2D2 | 4085 | 171 | 4.2 | 8.3 | 6.2 (4.5–8.6) | 3.4 | 2.6 (1.9–3.6) |
| B2T2D3 | 1130 | 60 | 5.3 | 10.6 | 7.2 (4.9–10.4) | 4.3 | 3.0 (2.1–4.4) |
| B2T3D1 | 1022 | 56 | 5.5 | 10.9 | 7.3 (4.9–10.7) | 4.4 | 3.0 (2.1–4.5) |
| B2T3D2 | 1250 | 94 | 7.5 | 15.0 | 9.3 (6.6–13.2) | 6.1 | 3.9 (2.8–5.5) |
| B2T3D3 | 419 | 35 | 8.4 | 16.7 | 9.0 (5.8–13.9) | 6.8 | 3.8 (2.5–5.8) |
| B3T1D1 | 467 | 20 | 4.3 | 8.5 | 7.9 (4.8–13.1) | Ref | Ref |
| B3T1D2 | 579 | 36 | 6.2 | 12.4 | 10.9 (7.2–16.5) | 1.5 | 1.4 (0.8–2.3) |
| B3T1D3 | 190 | 27 | 14.2 | 28.3 | 21.3 (13.6–33.2) | 3.3 | 2.7 (1.6–4.6) |
| B3T2D1 | 904 | 83 | 9.2 | 18.3 | 13.0 (9.2–18.3) | 2.1 | 1.6 (1.0–2.6) |
| B3T2D2 | 1197 | 138 | 11.5 | 23.0 | 14.9 (10.8–20.7) | 2.7 | 1.9 (1.2–3.0) |
| B3T2D3 | 505 | 100 | 19.8 | 39.5 | 24.4 (17.4–34.1) | 4.6 | 3.1 (2.0–4.9) |
| B3T3D1 | 315 | 48 | 15.2 | 30.4 | 17.5 (11.9–25.7) | 3.6 | 2.2 (1.4–3.6) |
| B3T3D2 | 560 | 100 | 17.9 | 35.6 | 18.7 (13.2–26.3) | 4.2 | 2.4 (1.5–3.7) |
| B3T3D3 | 284 | 56 | 19.7 | 39.3 | 18.4 (12.6–26.7) | 4.6 | 2.3 (1.4–3.8) |
| Women | |||||||
| B1T1D1 | 11,026 | 17 | 0.15 | Ref | Ref | Ref | Ref |
| B1T1D2 | 6586 | 18 | 0.27 | 1.8 | 1.7 (0.9–3.3) | 1.8 | 1.7 (0.9–3.3) |
| B1T1D3 | 1114 | 6 | 0.54 | 3.5 | 3.3 (1.3–8.3) | 3.5 | 3.3 (1.3–8.3) |
| B1T2D1 | 5571 | 21 | 0.38 | 2.4 | 1.7 (0.9–3.3) | 2.4 | 1.7 (0.9–3.3) |
| B1T2D2 | 3845 | 21 | 0.55 | 3.5 | 2.4 (1.3–4.6) | 3.5 | 2.4 (1.3–4.6) |
| B1T2D3 | 748 | 8 | 1.1 | 6.9 | 4.5 (1.9–10.4) | 6.9 | 4.5 (1.9–10.4) |
| B1T3D1 | 612 | 8 | 1.3 | 8.5 | 4.4 (1.9–10.2) | 8.5 | 4.4 (1.9–10.2) |
| B1T3D2 | 504 | 10 | 2.0 | 12.9 | 5.9 (2.7–12.9) | 12.9 | 5.9 (2.7–12.9) |
| B1T3D3 | 129 | 4 | 3.1 | 20.1 | 7.3 (2.6–20.6) | 20.1 | 7.3 (2.6–20.6) |
| B2T1D1 | 5200 | 24 | 0.46 | 3.0 | 2.8 (1.5–5.2) | Ref | Ref |
| B2T1D2 | 3906 | 29 | 0.74 | 4.8 | 4.2 (2.3–7.7) | 1.6 | 1.5 (0.9–2.6) |
| B2T1D3 | 778 | 11 | 1.4 | 9.2 | 7.5 (3.5–15.9) | 3.1 | 2.7 (1.3–5.4) |
| B2T2D1 | 4742 | 47 | 0.99 | 6.4 | 4.2 (2.4–7.4) | 2.1 | 1.5 (0.9–2.5) |
| B2T2D2 | 4601 | 87 | 1.9 | 12.3 | 7.6 (4.5–12.9) | 4.1 | 2.7 (1.7–4.3) |
| B2T2D3 | 1156 | 28 | 2.4 | 15.7 | 9.1 (5.0–16.6) | 5.2 | 3.2 (1.9–5.6) |
| B2T3D1 | 1077 | 47 | 4.4 | 28.3 | 12.9 (7.3–22.7) | 9.5 | 4.6 (2.8–7.6) |
| B2T3D2 | 1407 | 71 | 5.0 | 32.7 | 13.3 (7.7–22.9) | 10.9 | 4.8 (3.0–7.6) |
| B2T3D3 | 491 | 50 | 10.2 | 66.0 | 22.7 (12.9–39.8) | 22.1 | 8.1 (5.0–13.2) |
| B3T1D1 | 405 | 15 | 3.7 | 24.0 | 20.5 (10.3–40.7) | Ref | Ref |
| B3T1D2 | 527 | 22 | 4.2 | 27.1 | 20.4 (10.9–38.4) | 1.1 | 1.0 (0.5–1.9) |
| B3T1D3 | 151 | 7 | 4.6 | 30.1 | 22.3 (9.5–52.4) | 1.3 | 1.1 (0.5–2.6) |
| B3T2D1 | 910 | 44 | 4.8 | 31.4 | 18.2 (10.4–31.9) | 1.3 | 0.9 (0.5–1.6) |
| B3T2D2 | 1399 | 109 | 7.8 | 50.5 | 26.4 (15.8–44.3) | 2.1 | 1.3 (0.8–2.2) |
| B3T2D3 | 529 | 60 | 11.3 | 73.6 | 36.4 (21.2–62.5) | 3.1 | 1.8 (1.0–3.1) |
| B3T3D1 | 427 | 45 | 10.5 | 68.4 | 25.0 (14.2–44.1) | 2.8 | 1.2 (0.7–2.1) |
| B3T3D2 | 832 | 129 | 15.5 | 100.6 | 35.8 (21.2–60.5) | 4.2 | 1.7 (1.0–3.0) |
| B3T3D3 | 412 | 90 | 21.8 | 141.7 | 43.3 (25.3–74.2) | 5.9 | 2.1 (1.2–3.6) |
Notes:
Incidence of T2D as a percentage;
crude relative risks. The B1T1D1 group is reference for all BiTjDk groups;
relative risks adjusted for glucose, total cholesterol, HDL cholesterol, and year of birth. The B1T1D1 group is reference for all BiTjDk groups;
crude relative risks. The BiT1D1 group is reference for the BiTjDk groups, i = 1,2,3;
relative risks adjusted for glucose, total cholesterol, HDL cholesterol, and year of birth. The BiT1D1 group is reference for the BiTjDk groups, i = 1,2,3.
Abbreviations: CI, confidence interval; HDL, high-density lipoprotein; RR, relative risk; T2D, type 2 diabetes.
Figure 2.
Incidence of T2D by BMI, triglycerides, and diastolic blood pressure.
Notes: Colored points: Incidence in 27 groups defined by the 50% and 90% quantiles of BMI, triglycerides, and blood pressure, by gender. BMI groups are distinguished by vertical dashed lines, triglyceride groups by color (blue, orange, and red indicate increasing levels), and blood pressure group by point size (increasing size for increasing levels). The x-coordinate of each point indicates the mean BMI in the corresponding BiTjDk group. White lines: smoothing spline estimate of incidence of T2D by BMI only, with 95% bootstrapped confidence band.
Abbreviations: BMI, body mass index; T2D, type 2 diabetes.
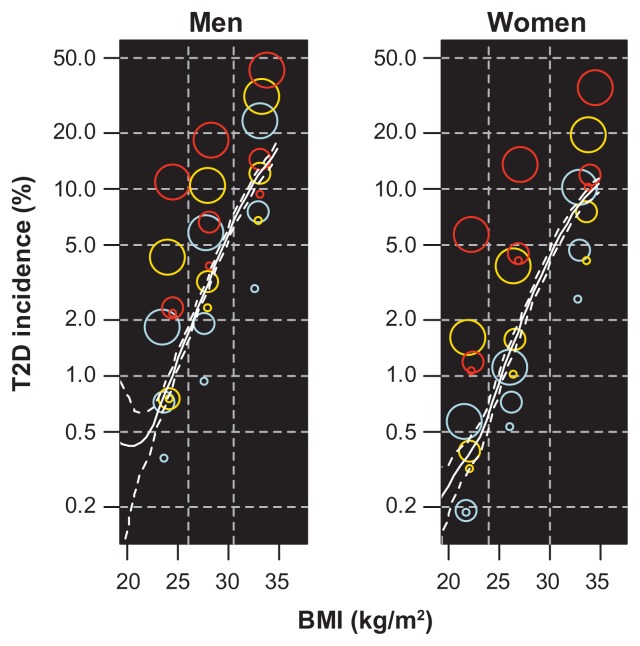
A similar analysis with diastolic blood pressure replaced by nonfasting glucose as the third grouping variable was performed. As expected, the variation in T2D incidence with triglycerides and glucose within the BMI groups was larger than the variation when diastolic blood pressure was used (eFigure 2).
Discussion
Obesity is positively associated with hypertriglyceridemia and hypertension, and all three are known risk factors for T2D.12 In our study of Norwegians aged 40–45 years, BMI was the single variable that best predicted T2D 5–15 years later. However, at defined levels of BMI, the T2D incidence varied substantially with triglyceride levels and diastolic blood pressure, also after adjustment for nonfasting glucose, HDL cholesterol, total cholesterol, and year of birth.
In deviance analyses including glucose, the strongest predictors for development of T2D were BMI, glucose, triglycerides, and blood pressure. Additional information about HDL cholesterol and total cholesterol had little impact on the prediction. In the Framingham study, clinical models including BMI (trichotomized), fasting glucose, triglycerides, HDL cholesterol, blood-pressure (all dichotomized), age (categorized), gender, and parental history predicted T2D equally as well as other models including more detailed clinical information.5 When risk factors are modeled as continuous rather than categorical, even less information could be needed.
BMI is a measure of general obesity. From a clinical aspect, abdominal and visceral obesity are considered to be more closely related to T2D than general obesity. Waist circumference and waist-hip ratio are used as measures of abdominal fat. In a meta-analysis of 32 studies, the three measurements were almost identical with regard to their ability to predict incident T2D.21 In our study population, information about waist and hip circumference was available for a subsample of 76,560 individuals. In this sample, BMI and waist circumference were equally good predictors for T2D (eFigure 3), which is logical because the two were strongly correlated (correlation 0.82 for men and 0.85 for women). The waist-hip ratio was less correlated with BMI (correlation about 0.5) and less related to T2D.
Other variables, such as smoking, physical activity, alcohol consumption, education, and heart rate, were included as variables in early analyses, but because they only marginally decreased the deviance in the multivariate analyses they were excluded in the final analysis. However, these variables increased the predictability in groups with low metabolic scores in another Norwegian study.22
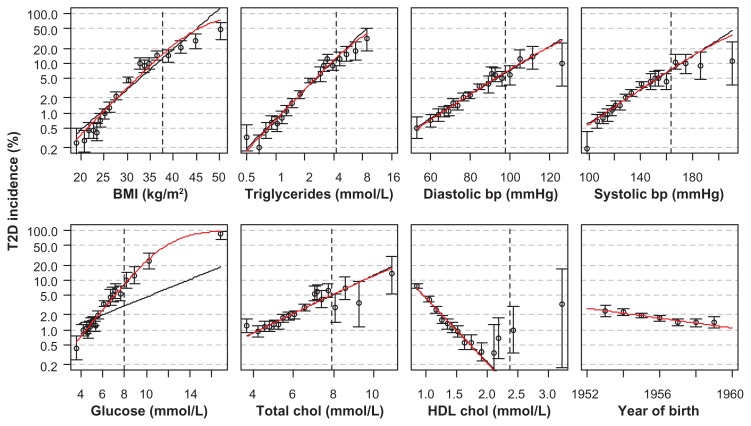
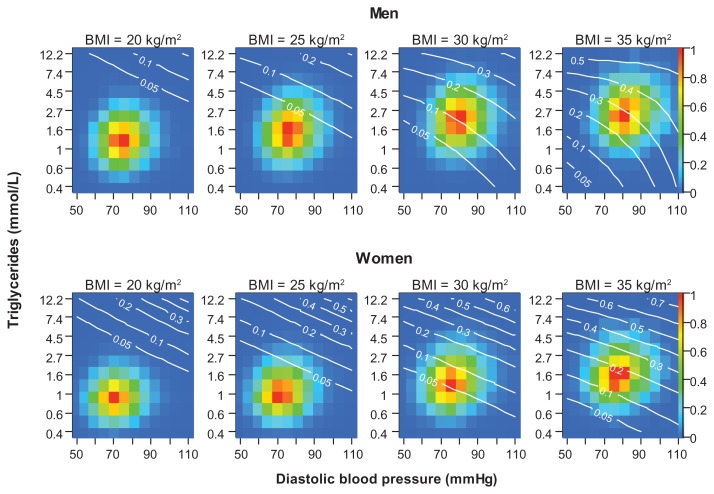
The relationships between the variables examined and T2D incidence were fairly well described by logistic regression models (eFigure 4). In many risk prediction models, continuous variables are categorized,23 which implies loss of information. A multivariate model, such as the one used for calculating deviances in our study, can also be used for risk prediction. An example is given in eFigure 5.
Strengths and limitations
The main strength of this study was the large study population in a narrow age range where medicine use and mortality could be traced. The size of the study population made it possible to create combined groups with various levels of BMI, triglycerides, and blood pressure to study their combined effect on incidence of T2D.
Self-reported diabetes at baseline was used as an exclusion criterion, but erroneous self-reports may have led to inclusion of individuals who had already been diagnosed with diabetes. In Okura et al, 99 (66%) of 150 American patients who had a diabetes diagnosis in their medical records answered “yes” when asked whether a medical practitioner had informed them that they had diabetes.24 The percentage was 77% in the age group of 45–65 years. Margolis et al reported roughly the same response in a population of 161,808 American women aged 50–79 years.25 However, it should be noted that 37 of the 51 false-negative responders in the study by Okura et al answered “yes” when asked whether they had a diagnosis of borderline diabetes.
Some patients with undiagnosed diabetes at baseline are probably included in the population. For example, of 58 people in our study population with a nonfasting blood glucose of >15 mmol/L at baseline, 55 were dispensed diabetes drugs in 2004–2009. Many of these probably had undiagnosed diabetes at baseline. The reduction in the diagnostic criterion of the fasting plasma glucose from 7.8 mmol/L to 7.0 mmol/L between the time of screening and follow-up26 may imply that some individuals who were not diagnosed with T2D at screening would have been diagnosed during follow-up, even though their fasting plasma glucose levels were unchanged. All biomarkers in our study were measured in nonfasting blood samples and this will probably give higher levels compared with fasting samples.
Another limitation of the study was that the subjects were not monitored during follow-up. Their BMI, blood pressure, triglycerides, and other biomarkers may have changed because of lifestyle modification and use of antihypertensives and lipid-modifying agents (statins), which may have blurred the associations.27,28
Finally, we had no information about genetic disposition in our study population, but this is unlikely to have influenced the results significantly. A case-control study with 2598 controls and 2309 cases showed that inclusion of genetic information in a model with BMI, age, and gender only marginally increased TD2 predictability.29
Hypoglycemic drugs as an outcome indicator for type 2 diabetes
The use of dispensed blood glucose-lowering drugs as a proxy for T2D eliminates the problem of recall bias in self-reporting, but can also lead to false negatives (untreated or undiagnosed T2D) and false positives (people without T2D being treated with diabetes medicine).
T2D patients who are controlled only with lifestyle measures (eg, physical activity and dietary modification) will not be identified and neither will individuals with unknown T2D. According to the Norwegian Diabetes Association, about 70% of T2D patients need medication. On the other hand, very few, if any, individuals in our study population would be prescribed blood glucose-lowering drugs for diabetes without having the disease. However, individuals who were dispensed insulin only could be either patients with type 1 diabetes or T2D. In total, 137 individuals were only treated with insulin in our population (5% of total cases), and given that our study population was middle-aged, most of them probably had T2D.
Conclusion
Our study confirms that BMI is the strongest predictor of T2D. However, at defined levels of BMI, the incidence of T2D varied substantially with triglyceride levels and blood pressure. The addition of other variables to BMI, triglycerides, glucose, and blood pressure in multivariate models had little impact on the prediction of T2D. The results indicate that levels of triglycerides and blood pressure are independent risk factors. Thus, triglyceride and blood pressure control in middle-aged individuals should also be targeted to prevent later onset of T2D.
Appendix
Deviance
Deviance is a goodness-of-fit measure defined as -2 times the difference in log-likelihood between the current model and a saturated model (ie, a model that fits the data perfectly). In the logistic regression case, the deviance equals −2 ∑[yi log(μi) + (1−yi)log(1−μi)] where yi are the observed data (1 if individual i has T2D, 0 if not) and μi are the fitted values from the maximum likelihood model. If adding a new covariate to a given multivariate model does not lead to a reduction in deviance, its inclusion has little benefit because it does not decrease the discrepancy between the model and the data. The null-deviance is the deviance from the model with no covariates, where μi = n−1∑yi (the predicted T2D risk for each individual equals the average incidence of T2D in the population, independent of the characteristics of the individual).
eFigure 1.
Flow chart of study population.
Note: Exclusion of participants from the Norwegian health studies 1995–1999.
eFigure 2.
Incidence of T2D by BMI, triglycerides, and glucose.
Notes: Colored points: incidence in 27 groups defined by the 50% and 90% quantiles of BMI, triglycerides, and glucose, by gender. BMI groups are distinguished by vertical dashed lines, triglyceride groups by color (blue, orange, and red indicate increasing levels), and glucose groups by point size (increasing size for increasing levels). The x coordinate of each point indicates the mean BMI in the corresponding BiTjGk group. White lines: smoothing spline estimate of incidence of type 2 diabetes by glucose only, with 95% bootstrapped confidence band. The 50% and 90% quantiles for glucose were 5.1 and 6.4 for men and 5.0 and 6.1 for women, the quantiles for BMI and triglycerides are given in Table 1.
Abbreviations: BMI, body mass index; T2D, type 2 diabetes.
eFigure 3.
Deviance from univariate and multivariate logistic regression models, with incident T2D as the outcome variable and the explanatory variables given on the x axis.
Notes: For the multivariate models, the variables to the left for, and including, the actual variable were included in the model. Population: 35,281 men and 41,279 women screened between 1996 and 1999 with measurements of waist and hip circumference.
Abbreviations: BMI, body mass index; bp, blood pressure; chol, cholesterol; T2D, type 2 diabetes; HDL, high-density lipoprotein; circumf, circumference; triglyc, triglycerides.
eFigure 4.
Incidence of T2D for women in groups defined by the 1, 5, 15, 25, 35, 45, 55, 65, 75, 85, 95, 96, 97, 98, 99.5, 99.8, and 99.95% quantiles of the actual variables, with 95% binomial confidence intervals.
Notes: The x values for the points equal the means of the groups. A vertical dashed line is drawn at the 99% quantile for each variable. The curves show the fits of Poisson (black) and logistic (red) regressions. Triglycerides were log-transformed in the regressions. The data were similar for men.
Abbreviations: BMI, body mass index; bp, blood pressure; chol, cholesterol; T2D, type 2 diabetes; HDL, high-density lipoprotein.
eFigure 5.
Predicted probability (white curves/numbers) for developing T2D before age 60 years for a 42-year-old man (top) and woman (bottom) with BMI equal to 20, 25, 30 or 35 kg/m2 at given levels of triglycerides and blood pressure.
Notes: The color of each cell indicates the number of individuals in the study population with the given level of triglycerides and blood pressure according to the color scale on the right y axes. Blue cells (value 0) have zero individuals, and at each level of BMI the red cell (value 1) is the most common combination of triglycerides and blood pressure. An orange cell (value 0.8) has 20% less individuals than the red cell in the same plot. The probabilities were predicted from the fit of a multivariate logistic regression model to 175,079 men and 194,897 women participating in the health studies between 1985 and 1999. The variables included were BMI, triglycerides, and diastolic blood pressure (with interaction terms) and year of birth and year of screening (without interaction terms).
Abbreviations: BMI, body mass index; T2D, type 2 diabetes.
Footnotes
Disclosure
The authors report no conflicts of interest in this work.
References
- 1.Farag YM, Gaballa MR. Diabesity: an overview of a rising epidemic. Nephrol Dial Transplant. 2011;26(1):28–35. doi: 10.1093/ndt/gfq576. [DOI] [PubMed] [Google Scholar]
- 2.International Diabetes Federation. IDF Diabetes Atlas. 5th ed. Brussels, Belgium: International Diabetes Federation; 2011. [Accessed June 30, 2012]. Available from: http://www.idf.org/diabetesatlas. [Google Scholar]
- 3.Rønning M, Berg C, Furu K, et al. The Norwegian Prescription Database 2004–2008. Oslo, Norway: The Norwegian Institute of Public Health; 2009. [Accessed May 25, 2012]. Report No 2009:2. Available from: http://www.fhi.no/dokumenter/197a20d501.pdf. [Google Scholar]
- 4.Berg C, Furu K, Mahic M, et al. The Norwegian Prescription Database 2006–2010. Oslo, Norway: The Norwegian Institute of Public Health; 2011. [Accessed May 25, 2012]. Report No 2011:2. Available from: http://www.fhi.no/dokumenter/ca931352dc.pdf. [Google Scholar]
- 5.Wilson PWF, Meigs JB, Sullivan L, Fox CS, Nathan DM, D’Agostino RB. Prediction of incident diabetes mellitus in middle-aged adults – The Framingham Offspring Study. Arch Intern Med. 2007;167(10):1068–1074. doi: 10.1001/archinte.167.10.1068. [DOI] [PubMed] [Google Scholar]
- 6.American Diabetes Association. Diagnosis and classification of diabetes mellitus. Diabetes Care. 2012;35(Suppl):71. doi: 10.2337/dc12-s064. [DOI] [PMC free article] [PubMed] [Google Scholar]
- 7.Bakris G, Stockert J, Molitch M, et al. Risk factor assessment for new onset diabetes: literature review. Diabetes Obes Metab. 2009;11(3):177–187. doi: 10.1111/j.1463-1326.2008.00925.x. [DOI] [PubMed] [Google Scholar]
- 8.Joseph J, Svartberg J, Njølstad I, Schirmer H. Incidence of and risk factors for type-2 diabetes in a general population: the Tromsø Study. Scand J Public Health. 2010;38(7):768–775. doi: 10.1177/1403494810380299. [DOI] [PubMed] [Google Scholar]
- 9.Cleeman JI, Grundy SM, Becker D, et al. Executive summary of the Third Report of the National Cholesterol Education Program (NCEP) expert panel on detection, evaluation, and treatment of high blood cholesterol in adults (Adult Treatment Panel III) JAMA. 2001;285(19):2486–2497. doi: 10.1001/jama.285.19.2486. [DOI] [PubMed] [Google Scholar]
- 10.Turner RC, Millns H, Neil HA, et al. Risk factors for coronary artery disease in non-insulin dependent diabetes mellitus: United Kingdom Prospective Diabetes Study (UKPDS: 23) Br Med J. 1998;316(7134):823–828. doi: 10.1136/bmj.316.7134.823. [DOI] [PMC free article] [PubMed] [Google Scholar]
- 11.Mokdad AH, Ford ES, Bowman BA, et al. Prevalence of obesity, diabetes, and obesity-related health risk factors, 2001. JAMA. 2003;289(1):76–79. doi: 10.1001/jama.289.1.76. [DOI] [PubMed] [Google Scholar]
- 12.Bays HE, Chapman RH, Grandy S. The relationship of body mass index to diabetes mellitus, hypertension and dyslipidaemia: comparison of data from two national surveys. Int J Clin Pract. 2007;61(5):737–747. doi: 10.1111/j.1742-1241.2007.01336.x. [DOI] [PMC free article] [PubMed] [Google Scholar]
- 13.Alberti KG, Zimmet P, Shaw J. International Diabetes Federation: a consensus on Type 2 diabetes prevention. Diabet Med. 2007;24(5):451–463. doi: 10.1111/j.1464-5491.2007.02157.x. [DOI] [PubMed] [Google Scholar]
- 14.Olafsdottir E, Aspelund T, Sigurdsson G, et al. Unfavourable risk factors for type 2 diabetes mellitus are already apparent more than a decade before onset in a population-based study of older persons: from the Age, Gene/Environment Susceptibility-Reykjavik Study (AGES-Reykjavik) Eur J Epidemiol. 2009;24(6):307–314. doi: 10.1007/s10654-009-9343-x. [DOI] [PMC free article] [PubMed] [Google Scholar]
- 15.Eckel RH, Kahn SE, Ferrannini E, et al. Obesity and type 2 diabetes: what can be unified and what needs to be individualized? Diabetes Care. 2011;34(6):1424–1430. doi: 10.2337/dc11-0447. [DOI] [PMC free article] [PubMed] [Google Scholar]
- 16.Jacobsen BK, Stensvold I, Fylkesnes K, Kristiansen IS, Thelle DS. The Nordland Health Study. Design of the study, description of the population, attendance and questionnaire response. Scand J Soc Med. 1992;20(3):184–187. doi: 10.1177/140349489202000309. [DOI] [PubMed] [Google Scholar]
- 17.WHO Collaborating Centre for Drug Statistics Methodology. ATC Classification Index with DDDs, 2010. Oslo, Norway: Norwegian Institute of Public Health; 2011. [Google Scholar]
- 18.Zou G. A modified Poisson regression approach to prospective studies with binary data. Am J Epidemiol. 2004;159(7):702–706. doi: 10.1093/aje/kwh090. [DOI] [PubMed] [Google Scholar]
- 19.R: A Language and Environment for Statistical Computing. Version 2.8.0. Vienna, Austria: R Foundation for Statistical Computing; 2008. [Google Scholar]
- 20.Schmidt CO, Kohlmann T. When to use the odds ratio or the relative risk? Int J Public Health. 2008;53(3):165–167. doi: 10.1007/s00038-008-7068-3. [DOI] [PubMed] [Google Scholar]
- 21.Vazquez G, Duval S, Jacobs DR, Jr, Silventoinen K. Comparison of body mass index, waist circumference, and waist/hip ratio in predicting incident diabetes: a meta-analysis. Epidemiol Rev. 2007;29:115–128. doi: 10.1093/epirev/mxm008. [DOI] [PubMed] [Google Scholar]
- 22.Joseph J, Svartberg J, Njølstad I, Schirmer H. Risk factors for type 2 diabetes in groups stratified according to metabolic syndrome: a 10-year follow-up of the Tromsø Study. Eur J Epidemiol. 2011;26(2):117–124. doi: 10.1007/s10654-010-9540-7. [DOI] [PMC free article] [PubMed] [Google Scholar]
- 23.Collins GS, Mallett S, Omar O, Yu LM. Developing risk prediction models for type 2 diabetes: a systematic review of methodology and reporting. BMC Med. 2011;9:103. doi: 10.1186/1741-7015-9-103. [DOI] [PMC free article] [PubMed] [Google Scholar]
- 24.Okura Y, Urban LH, Mahoney DW, Jacobsen SJ, Rodeheffer RJ. Agreement between self-report questionnaires and medical record data was substantial for diabetes, hypertension, myocardial infarction and stroke but not for heart failure. J Clin Epidemiol. 2004;57(10):1096–1103. doi: 10.1016/j.jclinepi.2004.04.005. [DOI] [PubMed] [Google Scholar]
- 25.Margolis KL, Lihong Q, Brzyski R, et al. Validity of diabetes self-reports in the Women’s Health Initiative: comparison with medication inventories and fasting glucose measurements. Clin Trials. 2008;5(3):240–247. doi: 10.1177/1740774508091749. [DOI] [PMC free article] [PubMed] [Google Scholar]
- 26.Shaw JE, Zimmet PZ, McCarty D, de Courten M. Type 2 diabetes worldwide according to the new classification and criteria. Diabetes Care. 2000;23(Suppl 2):B5–B10. [PubMed] [Google Scholar]
- 27.Tirosh A, Shai I, Bitzur R, et al. Changes in triglyceride levels over time and risk of type 2 diabetes in young men. Diabetes Care. 2008;31(10):2032–2037. doi: 10.2337/dc08-0825. [DOI] [PMC free article] [PubMed] [Google Scholar]
- 28.Izzo R, de Simone G, Chinali M, et al. Insufficient control of blood pressure and incident diabetes. Diabetes Care. 2009;32(5):845–850. doi: 10.2337/dc08-1881. [DOI] [PMC free article] [PubMed] [Google Scholar]
- 29.Lango H, Type UK, Palmer CN, et al. Assessing the combined impact of 18 common genetic variants of modest effect sizes on type 2 diabetes risk. Diabetes. 2008;57(11):3129–3135. doi: 10.2337/db08-0504. [DOI] [PMC free article] [PubMed] [Google Scholar]


