Abstract
PNA probes for the specific detection of DNA from olive oil samples by microarray technology were developed. The presence of as low as 5% refined hazelnut (Corylus avellana) oil in extra-virgin olive oil (Olea europaea L.) could be detected by using a PNA microarray. A set of two single nucleotide polymorphisms (SNPs) from the Actin gene of Olive was chosen as a model for evaluating the ability of PNA probes for discriminating olive cultivars. Both unmodified and C2-modified PNAs bearing an arginine side-chain were used, the latter showing higher sequence specificity. DNA extracted from leaves of three different cultivars (Ogliarola leccese, Canino and Frantoio) could be easily discriminated using a microarray with unmodified PNA probes, whereas discrimination of DNA from oil samples was more challenging, and could be obtained only by using chiral PNA probes.
Keywords: PNA, olive oil, hazelnut oil, SNP, cultivar identification, DNA fingerprinting
Introduction
DNA analysis enables genotype fingerprinting with consequent identification of different organisms, thus allowing traceability along the food chain.1 Indeed, this technique can have interesting applications in the agro-food industry for the identification of species and cultivars of both raw materials and processed food, particularly when a protected designation of origin (PDO) has been assigned.2 Olive oil is a very important component of the so-called Mediterranean diet and extra-virgin olive oil is currently considered as a high quality product, with beneficial health properties related to its fatty acid balance and high polyphenolic content. PDO, protected geographical indication (PGI), and traditional specialty guaranteed (TSG) are important awards assigned to the quality of extra-virgin olive oil, recognized by the European Union,3 in relation to the quality and geographical origin of olive oils, establishing marketing standards and stating an obligatory regimen of origin designation for extra-virgin and virgin olive oils.4
Many studies have been published on the assessment of quality and authenticity of extra virgin olive oil,5 and a number of well-established methodologies are currently applied to control frauds and oil composition. However, distinction of oils having similar triglyceride composition requires complex and multiple-parameter approaches. For example, chemical analyses, based on the determination of specific metabolites, are able to detect the presence of hazelnut oil in olive oil, but only when its percentage exceeds 15–20%.6-9
As far as the possibility to distinguish the olive cultivars that have contributed to the oil blend, complications derive from the high number of cultivars of the species Olea europaea L., by the recent extension of cultivation of some traditional cultivars in new regions, and by the often occurring cases of synonymy.
DNA markers have been used for identification of olive cultivars, being independent from environmental fluctuations and on account of the high degree of polymorphism, which allows to effectively distinguish very similar cultivars and to solve homonymy cases. Molecular markers have been specially applied for cultivar discrimination,10 plant certification and collection management, whereas for defining olive oil composition new markers need to be developed based on single nucleotide mutations easily detectable at array level.11 At present, DNA analysis is more than a promising approach to distinguish the different cultivars from which the oil is produced,12 since it is not influenced by environmental and processing conditions in respect to other methods (i.e., metabolites). DNA extracted from olive oil has been studied by means of different techniques based on molecular markers. Amplified fragment length polymorphisms (AFLP),13 sequenced characterized amplified region (SCAR),14 simple sequence repeats (SSR, also referred to as microsatellites)15,16 have been used for the characterization of olive cultivars from olive oil. Detection of single nucleotide polymorphisms (SNPs) by ligation detection reaction (LDR)17 platform by using several olive SNPs has recently shown to be a very potent tool for olive oil cultivar characterization.
Recent studies18 have demonstrated the negative effect of storage length on DNA present in the oil, showing a progressive degradation of the recovered DNA. Thus, methods enabling the detection of short DNA fragments are more suitable, being more robust and allowing the tracing of partially degraded DNA.
The detection of SNP markers can be best performed using specific DNA analogs, which are superior to oligonucleotides, in terms of sequence selectivity, as probes. Among them, peptide nucleic acids (PNAs), oligonucleotide mimics in which the sugar phosphate backbone has been replaced by a polyamide chain, constituted by N-(2-aminoethyl)glycine units covalently linked to nucleobases through a carboxymethyl spacer (Fig. 1), have proven to be particularly suitable, showing higher affinity and higher single mismatch recognition than oligonucleotides. Modified PNAs, in particular chiral PNAs, were shown to be superior to unmodified PNAs in terms of sequence selectivity, a property particularly useful in biomedical applications.19,20
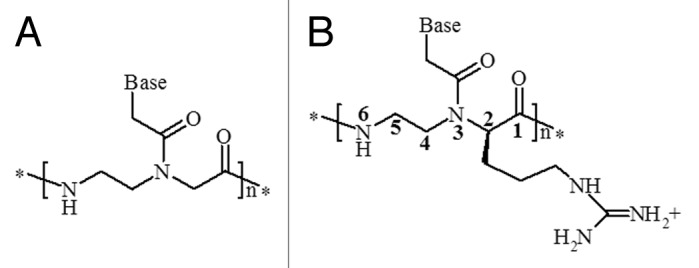
Figure 1. (A) Structure of a PNA, (B) C2-modified PNA containing an arginine monomer.
On account of these properties, PNAs have been used, in combination with different analytical techniques, in a wide variety of diagnostic methods for the detection of specific DNA tracts in biomedical and food research.21
In particular, PNA microarray technology proved to be very effective for the detection of genetically modified organisms (GMOs)22,23 or hidden allergens in food.24
A PNA microarray platform was also recently developed for the detection of SNPs related to tomato cultivars.25 PNAs have shown excellent properties also in the development of ultrasensitive techniques such as surface plasmon resonance (SPR) which allowed direct (PCR-free) detection of genomic DNA.26,27
Using PNA arrays, we have evaluated the possibility to detect and identify specific DNA sequences, which can be used for the assessment of the authenticity of olive oil, by revealing the presence of different oils or by fingerprinting the DNA of different olive cultivars, in a proof-of-principle approach. Thus, the aim of the present study was the application of the PNA microarray technology to the most challenging tasks of olive oil characterization: (1) the detection of hazelnut (Corylus avellana) oil adulteration, difficult to detect on the basis of the chemical composition and the amount of fatty acids being very similar in the two oils, and (2) the identification of olive oil cultivars by screening single nucleotide polymorphisms (SNPs). The former task requires the implementation of a method with high sensitivity, given the low amount of alien DNA in olive oil, and the latter needs highly selective probes.
Results and Discussion
DNA extraction from oil samples represents one of the most difficult tasks in DNA tracking in food. Several procedures are reported in the literature for the extraction of DNA from oil samples.28-31
We used a procedure based on a modification of the CTAB extraction after a thorough centrifugation of the sample, followed by treatment with low polarity solvents in order to eliminate the lipid components. The very small quantity of DNA thus obtained was sufficient for PCR amplification by appropriate protocols. An example of electrophoretic analysis of DNA extracted from different oil samples is reported in Figure 2. For SNP detection, the Wizard Magnetic method was used, since it allows the use of very low quantities of starting material.
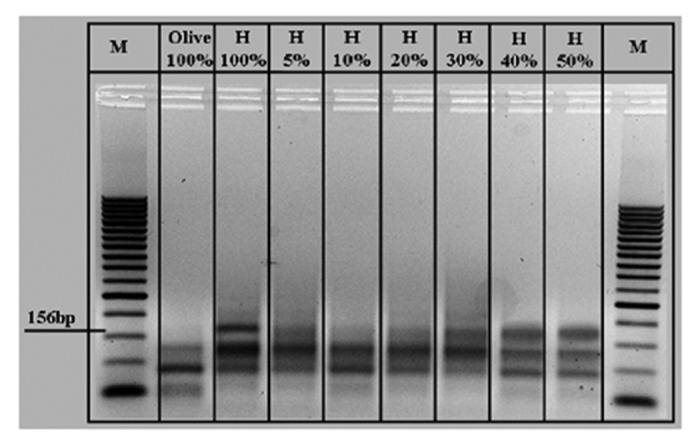
Figure 2. Duplex PCR reaction of DNA extracted from eight mixtures of extra-virgin olive oil containing different percentages of refined hazelnut oil (H). M, 50 bp molecular marker.
Detection of hazelnut oil
As a test for detecting adulteration of extra-virgin olive oil with alien-species oils, we chose refined hazelnut oil which is very similar to olive oil, as far as the fatty acid content, and therefore cannot be detected on the basis of the lipid composition. Refined hazelnut oil is very difficult to detect, due to the lack of characteristic components such as filbertone, which is detectable in non-refined oils using gas-chromatography (GC).32 Usually, the presence of hazelnut oil can be tracked using fractionation with TLC, followed by GC analysis of phytosterols in combination with multivariate analysis.5 However, the use of this method, which is quite cumbersome, becomes difficult when the hazelnut oil content in olive oil is lower than 10%. Moreover, hazelnut is an allergenic fruit, so hazelnut oil, even present in very low quantities, is not only a fraud but it is a potential hazard which could give rise to safety concerns
We took advantage of the PNA microarray platform previously developed by our group for the detection of hidden allergens in food. The platform contains a PNA specific for a tract of the Cor a1 gene of hazelnut. This platform was previously validated in terms of specificity (considering also the possible interference with other food allergens) and sensitivity, and the limit of detection was found to be in the nanomolar range.24 A set of samples obtained by mixing extra-virgin olive oil and refined hazelnut oil were prepared, with composition varying from 0% to 100% of hazelnut oil. The DNA extracted from these samples was amplified with the primers previously used for the amplification of the hazelnut DNA in food analysis. As a control, a duplex amplification using hazelnut specific primers and peanut specific primers (to detect unspecific signals) was used. The agarose gel electrophoresis, reported in Figure 2, showed the presence of hazelnut DNA, producing a specific PCR band of 156 bp, with different signal intensities but still not well defined. As expected, the pure extra virgin olive oil (100%) did not give rise to this PCR product.
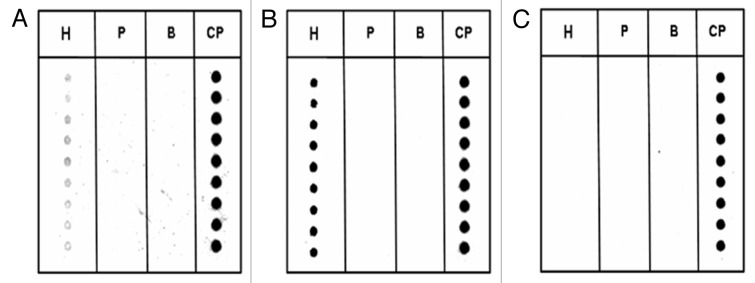
The PCR products obtained were subsequently further amplified with an asymmetric PCR protocol, in order to produce a Cy5-labeled single strand target DNA. This DNA was hybridized to the PNA array platform in order to confirm the presence of hazelnut-specific sequences. The results of the hybridization are reported in Figure 3 for extra virgin olive oil contaminated with 5% of refined hazelnut oil (Fig. 3A), the pure refined hazelnut oil (Fig. 3B) and the pure extra virgin olive oil (Fig. 3C). As it can be seen, the olive oil sample (Fig. 3C) did not give rise to a fluorescent signal, consistent with what was shown in the agarose gel electrophoresis. For the 5% sample, in contrast, though the PCR band was very weak, a significant signal was observed by the PNA array technique. Very intense signals were present in the case of higher percentages, as shown for the 100% hazelnut oil sample. No unspecific signals with the control PNA (specific for peanut) were observed in these experiments.
Figure 3. PNA array analyses of DNA extracted from oil mixtures containing: (A) 5% hazelnut oil, (B) 100% hazelnut oil and (C) no hazelnut oil (100% olive oil). H, hazelnut; P, peanut; B, blank deposition; CP, control probe depostition. Spots in each column represent replicates.
Thus, the PNA microarray platform is shown to be suitable for the detection of small amounts of hazelnut oil in olive oil, allowing to reveal alien contaminations and frauds.
Detection of different olive cultivars
Using selected DNA markers, namely SNP containing target sequences present in the Actin gene of the olive genome, it is possible to unequivocally identify different cultivars and to discriminate between them. The single nucleotide polymorphisms present in the olive Actin gene for the cultivars considered for this work are reported in Table 1.
Table 1. Summary of the single nucleotide polymorphisms found in the olive actin gene for a set of 12 cultivars.
| Cultivar/SNP position (bp) | 60 | 120 | 183 | 198 | 345 |
|---|---|---|---|---|---|
| Biancolilla |
A |
A |
G |
C |
G |
| Canino |
A |
R |
R |
S |
G |
| Carolea |
A |
A |
G |
C |
G |
| Coratina |
A |
A |
G |
C |
G |
| Frantoio |
A |
A |
G |
C |
G |
| Leccino |
A |
A |
G |
C |
R |
| Nocellara del Belice |
A |
A |
G |
C |
R |
| Ogliarola leccese |
T |
A |
G |
C |
G |
| Moraiolo |
A |
R |
R |
C |
G |
| Bosana |
A |
R |
R |
C |
G |
| Nocellara etnea |
A |
A |
G |
C |
R |
| Arbequina | A | A | G | C | G |
The numbers 60, 120, 183, 198 and 345 refer to the SNP positions on the Actin gene. R: A or G; S: C or G.
On the base of these data, three cultivars were chosen, Canino, Ogliarola leccese and Frantoio, because they differ one from another by the nucleotides present in position 60 and 198. Ogliarola leccese and Canino, which are commercially important, can in this way be identified unequivocally. Frantoio was chosen to represent the other ten cultivars reported in Table 1.
A set of four PNAs complementary to each SNP in the 60 and 198 positions of the PCR product were designed, and their sequences are reported in Table 2, together with the oligonucletides used for the set-up of the PNA array system.
Table 2. PNA and DNA oligonucleotide sequences used in the present study.
| PNA/DNA | Sequence | Role |
|---|---|---|
|
PNA-A60 |
H-TTACTCATTCACC-NH2 |
Complementary to DNA T60 (Ogliarola leccese) |
|
PNA-T60 |
H-TTACTCTTTCACC-NH2 |
Complementary to DNA A60 (all other cultivars) |
|
PNA-G198 |
H-TGATGGGCAGGTT-NH2 |
Complementary to DNA C198 (all cultivars) |
|
PNA-C198 |
H-TGATGGCCAGGTT-NH2 |
Complementary to DNA C198 (Canino) |
|
PNA-ch-A60 |
H-TTACTCA2D-ArgTTCACC-NH2 |
Containing a chiral monomer in the A 60 SNP position |
|
PNA-ch-T60 |
H-TTACTCT2D-Arg TTCACC-NH2 |
Containing a chiral monomer in the T 60 SNP position |
|
DNA-A60 |
GGTGAAAGAGTAA |
Canino and Frantoio DNA |
|
DNA-T60 |
GGTGAATGAGTAA |
Ogliarola leccese DNA |
|
DNA-G198 |
AACCTGGCCATCA |
Canino |
| DNA–C198 | AACCTGCCCATCA | All cultivars |
The positions of the SNPs are reported in bold. A2D-Arg and T2D-Arg refer to modified PNA monomers containing a d-arginine residue on the C2 carbon of the PNA backbone.
The PNA probes were synthesized as reported in the Materials and Methods, purified by HPLC, and characterized by HPLC-MS analysis. In order to evaluate their sequence selectivity, melting temperatures with the corresponding full-match and mismatch cDNA were measured by UV spectroscopy. The mismatched base for each PNA corresponded to the SNP to be discriminated. The results are reported in Table 3. The melting temperature distribution of the full-match hybrids was very wide, ranging from 48.5°C to 84.9°C, while the ΔTm parameter (Tm full match - Tmmismatch) was high (8–19°C) These differences enable the PNA to perform a good recognition of the point mutations, and even more stringent discrimination of unrelated sequences.
Table 3. Melting temperatures for the PNA synthesized with full match and singly mismatched DNA measured in PBS buffer.
| PNA | Tm fullmatch | Tm mismatch | ΔTm |
|---|---|---|---|
|
PNA-A60 |
54°C |
35°C |
19°C |
|
PNA-T60 |
46°C |
38°C |
8°C |
|
PNA-ch-A60 |
55°C |
35°C |
20°C |
|
PNA-ch-t60 |
48°C |
38°C |
10°C |
|
PNA-C198 |
81°C |
65°C |
16°C |
| PNA-G198 | 85°C | 70°C | 15°C |
c = 5 μM for each strand.
PNA array performance with oligonucleotides
The PNA probes were then deposited onto the array surface, together with a Cy5-labeled control probe, and hybridized with synthetic DNA oligonucleotides in order to assess their behavior in terms of specificity and duplex stability. Hybridization results obtained using a different cDNA target for each PNA array device are reported in Figure 4.
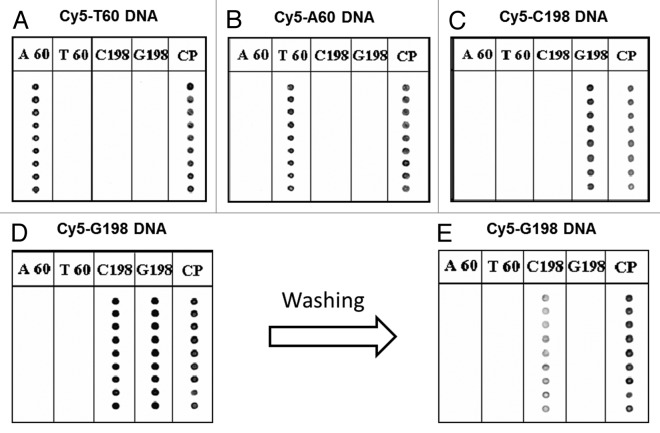
Figure 4. PNA array analysis of Cy5-labeled oligonucleotides (point mutations present in Ogliarola leccese) (headings refer to PNA probes deposited). (A) DNA T60; (B) DNA A60; (C) DNA C198; (D) DNA G198 with washing at room temperature; (E) G198 after washing at 60°C. Oligonucleotides concentrations were 0.5 µM; hybridization was performed in SSC 4x with 0.1%, SDS at 40°C for 2 h. Scan was performed at λex = 646 nm, λem = 664 nm; laser power 100%, gain 40%. Spots in each column represent replicates.
Figure 4A shows that PNA probes designed for the recognition of Ogliarola leccese are able to distinguish between the point mutation A/T onto the DNA target, while the nonspecific PNA probe does not give rise to a fluorescent signal.
The PNA probe G198 recognized correctly the presence of its complementary target DNA C198 (Fig. 4B) but it gave rise to a fluorescent signal also in the presence of the DNA G198 (Fig. 4C), producing a false-positive result. This problem was probably due to the low melting temperature difference between the PNA C198 hybridized with the fully complementary target (81.0°C) and the PNA G198, hybridized with the mismatched target (70.0°C). Thus, this array did not allow the point mutation recognition if hybridization was performed at 40°C. However, the unspecific signal was significantly reduced by washing the hybridized PNA array slide with double distilled water pre-warmed at 60°C (Fig. 4D).
In order to avoid lack of specificity in the analysis of oil samples containing very low amounts of DNA and very low percentages of one oil mixed with an excess of the other, performances of chiral PNA probes were compared with those of unmodified PNA under higher instrumental signal amplification. The results are reported in Figure 5. Chiral probes turned out to give rise to lower, but very specific, signals, whereas under the same conditions achiral PNA gave unspecific signals, which were very intense in the case of hybridization with the DNA T60 oligonucleotide, and to a lesser extent with the DNA A60.
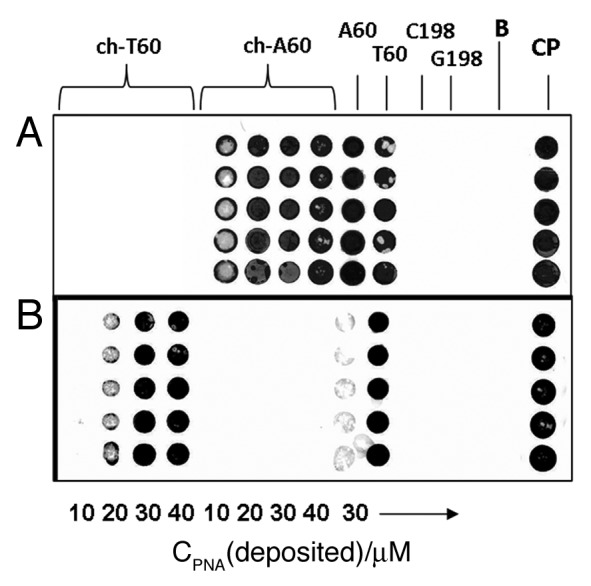
Figure 5. Comparison between PNA array data obtained by hybridization of Cy5-labeled oligonucleotides with chiral ch-T60 and ch-A60 and those obtained with achiral PNA probes: (A) hybridization of DNA T60; (B) hybridization of DNA A60. Chiral PNA were deposited using solutions with increasing probe concentrations: from left to right: 10, 20, 30 and 40 μM. Achiral PNA concentrations: 30 μM. G198 and C198 probes were also spotted on the same slide. B, blank; CP, deposition control. Spots in each column represent replicates.
As it is shown in Figure 5, achiral PNA A60 and T60 produce unspecific signals with both DNA T60 and A60, although to a lesser extent for the latter; in contrast, ch-A60 recognizes specifically DNA T60 (Fig. 5A) as well as ch-T60 recognizes only DNA A60 (Fig. 5B). The fluorescence response (DNA capture) varies with the amount of PNA deposited, which in turns depends on the concentration of the probes used in the spotting procedure, with an optimum at 30–40 µM.
Detection of DNA from olive leaves
Once the PNA array platform specificity was established, the PCR product hybridization was tested with the genomic DNA extracted from olive leaves. Individual genomic DNA from the leaves of the Ogliarola leccese and Canino cultivars was used for detection SNPs, as well as a mix of both cultivars (50–50%); Frantoio was used as a negative control together with a Blank (no genomic DNA) in order to assess the absence of contamination.
Amplification results for each genomic DNA (Fig. 6) show specificity of the primer pair used [only a PCR product of expected length (296 bp) was obtained] and the absence of contamination during PCR steps (lane B).
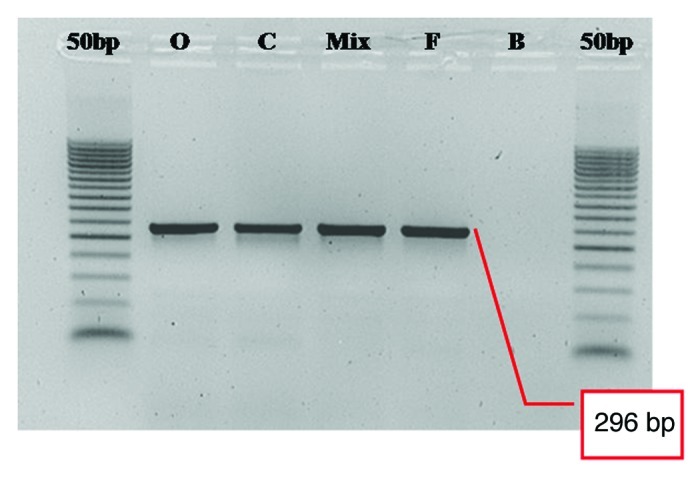
Figure 6. Agarose gel analysis of DNA extracted from leaves of different olive cultivars and amplified with primers 1 and 2 for the 296 bp trait containing the SNPs in position 60 and 198 bp of the actin gene. O, Ogliarola leccese; C, Canino; Mix, mixture of 50% Ogliarola leccese and 50% Canino; F, Frantoio; B, blank. Ladder of 50 bp is shown on both sides.
These double strand PCR products were subsequently amplified with an asymmetric PCR in order to obtain a single strand PCR product, Cy5-labeled.
Preliminary experiments with single-cultivar genomic DNA have established (data not shown) that the best temperature of hybridization was 30°C, since the unspecific hybridizations were reduced. Thus, single stranded PCR products were hybridized at 30°C for 2 h and with a solution containing 3x SSC and 0.1% SDS.
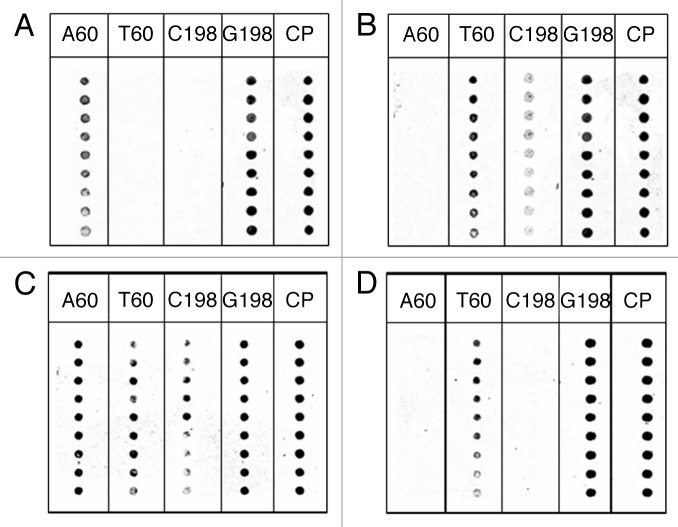
The results obtained by hybridization with the cultivar Ogliarola leccese (Fig. 7A) and Canino (Fig. 7B) are reported in Figure 7. As expected on account of the SNPs reported in Table 1, two specific fluorescent signals were obtained for the Ogliarola leccese cultivar. Both PNA A60 and G198 gave rise to a fluorescent signal since this cultivar has a thymine at position 60 and a cytosine at position 198 of the Actin gene. The Canino cultivar gave rise to three fluorescent signals being characterized by an adenine in position 60 and a heterozygote SNP (C/G) at position 198.
Figure 7. PNA array analysis of 296 bp PCR amplicons from olive leaves shown in Figure 6. (A) Ogliarola Leccese; (B) Canino; (C) mix, mixture 50–50% of both cultivars; (D) Frantoio. Spots in each column represent replicates.
The DNA mix, containing the DNA of Ogliarola leccese and Canino in a 1:1 ratio, showed the presence of all point mutations and, accordingly, PNA array produced four fluorescent signals, due to the presence of A60 and G198 (Ogliarola Leccese) and T60, C198 and G198 (Canino) DNA nucleobases. Finally, by testing the PNA array platform with the PCR product obtained by amplification of the DNA of the Frantoio cultivar, which has a pattern of SNP in position 60 and 198 identical to all cultivars listed in Table 1, except Canino and Ogliarola, it was possible to observe the expected spots corresponding to PNA T60 and G198.
Therefore, we have demonstrated that the PNA platform developed here may be able to distinguish the Ogliarola leccese and Canino cultivars from each other and from ten other different cultivars, here represented by Frantoio.
Detection of DNA in oil samples
Since DNA is present in very low amount in oil, the extraction procedure is the most critical point for analysis; therefore we tested a series of extraction methods: a modified CTAB, Wizard and Wizard Magnetic for food extraction kits. Wizard Magnetic was selected as the one providing the best results.
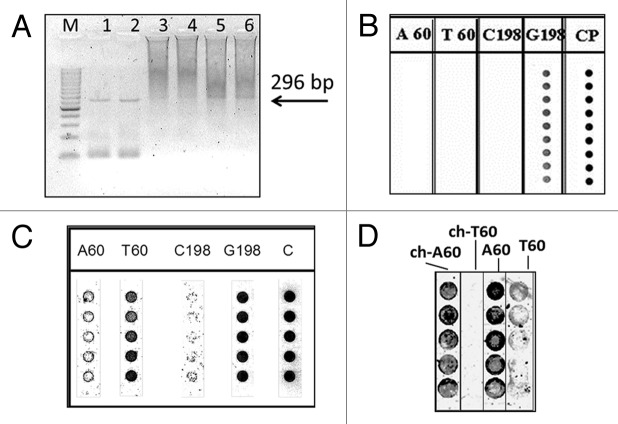
Agarose gel electrophoresis revealed very low quantities of amplified PCR product (Fig. 8A) and asymmetric PCR gave only a faint band of the desired size. However, using high power in the microarray scanner, distinguishable signals could be obtained.
Figure 8. Results obtained with DNA extracted from extra virgin olive oil samples. (A) Agarose gel analysis of the 296 bp PCR product from (1) Canino and (2) Ogliarola leccese, and of asymmetric PCR from Canino (3 and 5, replicates) and Ogliarola leccese (4 and 6, replicates); M 50 bp ladder marker; (B) PNA array analysis of the 296 bp DNA obtained by asymmetric PCR shown in (A); (C) PNA array analysis of DNA extracted from oil of the Canino cultivar using nested PCR and achiral PNA; (D) PNA array analysis obtained using chiral PNA (ch-A60 and ch-T60) in comparison with achiral PNA (A60, T60) with DNA extracted from Ogliarola leccese oil. Spots in each column of the PNA arrays represent replicates.
Surprisingly, only the G198 signal was detected, probably due to the high stability of the duplex formed by G198 PNA probe with its target. Probably due to the low amount of target DNA compared with leaves, the entire 296 bp segment was sequestered by the G198 PNA probe. Therefore, we chose to first amplify the entire 296 bp target, and then to perform a nested PCR using internal primers, in order to obtain two separate segments of 100 bp and 181 bp, each containing only one of the two SNP positions (position 60 for the 100 bp and position 198 for the 181 bp amplicons). On agarose gel analysis only the 181 bp segment was visible (results not shown). However, in the PNA array analysis signal of both regions could be detected, as shown in the case of the Canino cultivar in Figure 8C. Although the signal for the 198 position (C198) was fainter, it was consistent with results obtained with leaves of the same cultivar. However, at this very low concentration, unspecific signals from the A60 probe were significantly interfering. Similar results were obtained with the Ogliarola leccese cultivar (Fig. 8D).
In contrast, the use of chiral PNA probes (ch-A60 and ch-T60) improved selectivity, showing perfect match with the expected profile for this SNP in DNA from oil. Similar results were obtained using the chiral PNA on the DNA analysis of the Canino cultivar.
Conclusions
In this paper we have demonstrated that PNA probes can be used for the characterization of DNA from olive leaves and oil, allowing to easily detect the presence of oil obtained from other plant species, as demonstrated by the detection of hazelnut oil at a 5% level, which is difficult to trace with other methods. The sequence selectivity of PNA allowed detections of SNPs by PNA array technology if the DNA amount available was high, as in the case of plant tissues such as leaves. However, in the challenging problem of tracking DNA from oil by SNP detection, very high sequence specificity is necessary and this can be achieved using chiral variants of PNA monomers containing a d-arginine residue at the C2 position. As found in other studies on PNA arrays the signal intensity is lower when using chiral PNA probes, but selectivity is much higher. This is particularly important when low signals coming from oil analysis are considered.
However, due to the very low signal intensity, optimization of the entire process from oil to PNA array analysis should be performed. Ultrasensitive PNA-based techniques, allowing to selectively detect SNPs and point mutations with only few copies of DNA,22,23 can greatly improve this type of analysis.
Materials and Methods
Chemicals
PNA monomers were from Applera; (4-methylbenhydryl)amine (MBHA) resin was from Novabiochem (Inalco spa); O-(1H-7-azabenzotriazolyl)-N,N,N′,N′-tetramethyluronium hexafluorophosphate (HATU) and N,N-diisopropylethylamine (DIEA) were from Aldrich and N-methylpyrrolidone (NMP) was from Advance Biotech Italia srl. All solvents used for HPLC were of chromatographic grade. Doubly-distilled water was produced by Millipore Alpha-Q purification module. Oligonucleotides used for melting temperature measurement were purchased from Genset and Thermoelectron, and their purity was checked by ion-exchange HPLC.
Oil Samples
Monocultivar oils of the Ogliarola leccese, Canino and Frantoio cultivars, provided by CNR-IGV Perugia, were extracted by a lab oil mill and stored at room temperature in dark bottles for up to 2 years.
Model system for a mixture of hazelnut oil/extra virgin olive oil
For the hazelnut content test, commercial extra-virgin olive oil and refined hazelnut oil were mixed at 50–40–30–20–10–5% of blending. The two pure oils were analyzed separately.
Identification of SNPs in the olive Actin gene
The sequence of an olive Actin gene fragment was obtained by amplifying the DNA of the cultivar. Frantoio using degenerated primers derived from the alignment of other hortologous genes. On the Frantoio sequence were then designed new primers to amplify a set of 12 cultivars (Table 1) including 11 Italian and one Spanish (Arbequina) cultivars and amplicons were sequenced on a capillary sequencer ABI 3130 (Applied Biosystems). One sample per cultivar was analyzed, due to the clonal origin of each cultivar. Each sequence experiment was repeated twice and only clear SNPs were retained. No indels were observed on these fragments.
DNA extraction and amplification
Genomic DNA was extracted from leaves of the 12 olive cultivars by using the GenElute Plant mini kit (Sigma), following manufacturer instructions.
Extraction of DNA from oil
DNA extraction was performed from a sample of 10–15 mL with the following protocol based on CTAB extraction. The sample was separated in several test tubes (1.5 mL each) and centrifuged at 16,000 g for 10 min. The oil phase was discarded and the small pellets were used. To each of them, 500 µl of CTAB extraction buffer (20 g/l CTAB, 100 mM Tris pH 8.0, 20 mM EDTA, 1.4M NaCl) and 250 µl of n-hexane were added. The mixtures were stirred for 20 sec, incubated in a water bath at 65°C for about 1 h (mixing occasionally), then centrifuged at 16,000 g for 10 min. The aqueous layers were treated with 500 µl of chloroform and stirred for 20 sec, then centrifuged at 16,000 g for 10 min. To the aqueous layers, 1 ml of CTAB precipitation solution (5 g/l CTAB, 0.04M NaCl) was added; the samples were stirred and stored at room temperature for 1 h, then centrifuged at 16,000 g for 10 min and the liquid phase was discarded. The pellets were dissolved in 500 µl of a 1.2M NaCl solution and 500 µl of chloroform were added. These mixtures were stirred for 30 sec, centrifuged at 16,000 g for 10 min, after which the aqueous layer was recovered and treated with 400 µl of isopropanol and 50 µl of 3M sodium acetate (pH 5.2), stirred and centrifuged at 16,000 g for 10 min. The liquid phases were discarded and the pellets were washed with 200 µl of ethanol 70%, centrifuged at 16,000 g for 10 min, and the liquid phase was discarded. Each pellet was dried and resuspended in 50 μl of sterile water or TE buffer. All DNA solutions from the same oil sample were joined and dried in the same test tube and resuspended in 50 µl of water. The extracted DNA remained stable for two weeks at +4°C and for six months at -20°C. The DNA concentration was evaluated by UV absorption at 260 nm; 30 ng/μl stock solutions were prepared by dilution with double distilled water. For the detection of SNP in oil, the Wizard Magnetic DNA Purification System for Food (Promega) was used, starting from 250 μl of oil, according to the producer’s instructions.
Polymerase chain reaction
A PCR amplification targeting a DNA sequence characterizing the Cor a 1 isoform of an hazelnut allergen (GenBank AN Z72440.1), developed and validated in a previous work was designed.20 The primer sequences chosen for the analyses are Cor a 1_74 5′-TAGATTCCGACAACCTCATCC-3′ and Cor a 1_229 5′-CACAAAACGTACAACTCCTTGG-3′. The PCR primer Cor a 1_74 was labeled with a Cy5 fluorophore at the 5′ end in order to produce a labeled single DNA strand to be hybridized with the PNA array platform. The samples to be used on the array platform underwent a double amplification: the former step was used to amplify the target sequences, while the latter step was an asymmetric PCR used to selectively amplify the target DNA single strand to be hybridized on the array. Polymerase chain reactions were performed in a final volume of 50 μl. All reagents were supplied by Euroclone and primers from Thermoelectron. Concentration of reagents in the former PCR were: 1 × reaction buffer, 3 mM MgCl2, 0.2 mM dNTPs, 0.4 μM of each primer, 0.1 u/μl of hot start Blue Taq, 2 µl of genomic DNA (concentration was not quantifiable). The reaction buffer for the latter step (unbalanced PCR) was the same, apart from the primer concentrations brought to 0.2 μM for the oligonucleotide priming the non-target DNA strand, and 2.0 μM for the oligonucleotide priming the target DNA strand. The PCR was performed in a PCR-sprint thermal cycler (Thermohybaid) using the following conditions: one cycle of DNA denaturation and Blue Taq activation at 95°C for 5 min; 40 cycles consisting of DNA denaturation at 95°C for 50 sec, primer annealing at 60°C for 50 sec and elongation at 72°C for 50 sec; one step of final elongation at 72°C for 5 min.
To detect the olive Actin gene SNPs, the amplification reaction was performed as reported above but using a primer pair: primer 1 (forward) GTGGTTTCGTGAATGCCTGCTGC and primer 2 (reverse) Cy5-CTGGCTGGTCGTGACCTTACTG. The amplicon was 296 bp. A second set of primers was used for the subsequent nested PCR amplification of an internal sequence containing only the SNP positioned at 60 bp-using primer 2 (as above) and primer 3 (5′-TCATGTCTCTCACAATTTCCCGCTCTGCAG-3′). The segment containing the SNP at 198 bp was amplified using primer 1 (as above) and primer 4 (5′-Cy5-ACATTGCCCTTGACTATGAGTCAGGAGC-3′).
PNA design
The PNA sequences were first checked to minimize any secondary structure which would result in a loss of hybridization efficiency, using the online available program Mfold (www.idtdna.com/Scitools/Applications/mFold). Sequence specificity of probes was first evaluated using the blast homology search system from DDBJ (www.ddbj.nig.ac.jp/search/blast-e.html) and then, in order to avoid hybridization with any other non-target region among those amplified by the duplex PCR, by aligning the PNA sequences to the DNA sequences of the other amplified products. The sequences chosen for the analyses are reported in Table 1.
Synthesis of chiral PNA
The synthesis of C2-modified d-arginine containing chiral PNA was performed by the submonomeric strategy, as described in a previous paper,33 using Fmoc-protection at the α-amino group and Boc- protection at the terminal amino group.
PNAs were cleaved from the resins using a TFA-TFMSA mixture, precipitated with ethyl ether and dissolved in water. The crude products were analyzed by HPLC-MS and purified by RP-HPLC, using a Phenomenex C18 peptide column (3 μm, 250 mm × 10 mm) with a binary gradient (flow rate: 4 ml/min); eluent A: water/TFA = 100:0.2; eluent B: water/acetonitrile/TFA = 60:40:0.2; detector UV (260 nm). The purified products were characterized by Electrospray Ionisation-mass spectrometry (ESI-MS). Overall yields, after purification were in the range 3.5–10%.
PNA A60
Calculated: 532.3 [MH7]7+, 620.8 [MH6]6+, 744.8 [MH5]5+, 930.7 [MH4]4+, 1240.6 [MH3]3+. Found: 532.7 [MH7]7+, 621.3 [MH6]6+, 745.3 [MH5]5+, 931.3 [MH4]4+, 1241.3 [MH3]3+.
PNA T60
Calculated: 531.0 [MH7]7+, 619.3 [MH6]6+, 743.0 [MH5]5+, 928.5 [MH4]4+, 1237.6 [MH3]3+. Found: 531.4 [MH7]7+, 619.7 [MH6]6+, 743.5 [MH5]5+, 928.9 [MH4]4+, 1238.4 [MH3]3+.
PNA C198
Calculated: 555.3 [MH7]7+, 647.6 [MH6]6+, 777.0 [MH5]5+, 971.0 [MH4]4+. Found: 531.4 [MH7]7+, 619.7 [MH6]6+, 743.5 [MH5]5+, 928.9 [MH4]4+, 1238.4 [MH3]3+.
PNA G198
Calculated: 561.0 [MH7]7+, 654.3 [MH6]6+, 785.0 [MH5]5+, 981.0 [MH4]4+. Found: 561.4 [MH7]7+, 654.8 [MH6]6+, 785.5 [MH5]5+, 981.5 [MH4]4+.
Chiral PNA A60
Calculated: 546.4 [MH7]7+, 637.3 [MH6]6+, 764.6 [MH5]5+, 955.5 [MH4]4+. Found: 546.4 [MH7]7+, 637.6 [MH6]6+, 765.1 [MH5]5+, 955.8 [MH4]4+.
Chiral PNA T60
Calculated: 545.1 [MH7]7+, 638.8 [MH6]6+, 762.8 [MH5]5+, 953.2 [MH4]4+. Found: 545.4 [MH7]7+, 638.3 [MH6]6+, 763.2 [MH5]5+, 953.6 [MH4]4+.
Determination of the melting temperatures of the PNA/DNA duplexes
All hybridization experiments were performed in 10 mM phosphate buffer with 100 mM NaCl, 0.1 nM EDTA, pH 7.0. The PNA probes and the DNA targets were quantified by UV absorption at 260 nm and diluted to a 5 μM concentration each. Melting curves were obtained by using a Perkin Elmer λ Bio 20 UV spectrophotometer and recorded by heating samples at 0.5°C/min and following the absorbance variation at 260 nm. Melting temperature values were taken as the maximum of the first derivative of the melting curve.
PNA array preparation
CodeLink Activated Slides (Amersham Biosciences, 300011) were used as solid supports to which the N-terminal group of the PNA probes was covalently linked. Deposition of the probes was performed using a GMS 417 Arrayer (Genetic Microsystem) with a pin-and-ring deposition system. The deposition protocol was slightly changed in order to comply with the special requirement of the chemical structures of PNA probes. In particular, a carbonate buffer (100 mM, pH 9.0) containing 10% acetonitrile and 0.001% sodium dodecylsulphate (SDS) was used as deposition buffer. Moreover, after every deposition, the pin-and-ring system was washed twice with double distilled water for 10 sec, with acetonitrile/water (1:1), to avoid dragging of probes in subsequent depositions, and finally dried for 10 sec. The probes were coupled to the surface by leaving the slides for 12 h in a humid dark chamber (relative humidity 75%) at room temperature, and the remaining reactive sites were blocked by a 30′ immersion in a glass rack containing a 50 mM solution of ethanolamine, 0.1M TRIS, pH 9.0, pre-warmed at 50°C. The slides were washed twice with bidistilled water at room temperature and then slowly shaken for 30′ in plastic tubes containing a 4x sodium citrate salt (SSC) and 0.1% SDS buffer solution, pre-warmed at 50°C. Each slide was then washed with double distilled water at room temperature and dried by centrifugation in a plastic tube for 3′ at 800 rpm. Slides were then ready to undergo to the hybridization protocol or can be stored in a desiccated chamber for future use. Since a fluorescent control probe was deposited to check the efficiency of the deposition step, all previously described operations were performed away from direct light in order to prevent degradation of the Cy5 fluorophore, used to label the target sequences.
PNA array hybridization and detection
DNA samples to be tested were prepared by diluting 50 μl of the PCR product to a final volume of 65 μl and a final concentration of 4x SSC and 0.1% SDS buffer. Hybridization was performed by loading the samples to “in situ frame” chambers (Eppendorf, 0030 127.510) and leaving the slides under slow shaking for 2 h at 40°C. After the hybridization step, all slides were treated individually to prevent cross-contamination. They were then washed under slow shaking for 5′ with a 2x SSC, 0.1% SDS buffer, pre-warmed at temperature of hybridization, followed by a second wash for 1′ with 0.2x SSC and a final wash for 1′ with 0.1x SSC at room temperature. The slides were then spin-dried for 5′ at 1,000 rpm. All post-hybridization steps were performed in a dark environment to prevent degradation of the Cy5 fluorophore.
The fluorescent signal deriving from the hybridization was acquired using a GMS 418 Array Scanner (Genetic Microsystem) at λex = 646 nm and λem = 664 nm. To correctly compare the hybridization data, all reported images were acquired with an instrument laser power = 100% and photomultiplier gain = 40%.
Acknowledgments
This work was partially supported by grants from MIUR (PRIN07, PRIN09 and OLIBIO) and by MIPAF (RIOM).
Disclosure of Potential Conflicts of Interest
No potential conflicts of interest were disclosed.
Footnotes
Previously published online: www.landesbioscience.com/journals/artificialdna/article/20603
References
- 1.Marchelli R, Tedeschi T, Tonelli A. DNA analyses in food safety and quality: current status and expectations. In: Spoto G, Corradini R, eds. Detection of unamplified genomic DNA. Springer, 2012. [Google Scholar]
- 2.[EEC] European Economic Community. 1992. On the protection of geographical indications and designations of origin for agricultural products and foodstuffs; Council Regulation 2081/92.
- 3.[EC] European Commission. 2006. On the protection of geographical indications and designations of origin for agricultural products and foodstuffs; Council Regulation 510/2006.
- 4.[EC] European Commission. 2002. On marketing standards for olive oil; Commission Regulation 1019/2002.
- 5.Montealegre C, Marina Alegre ML, García-Ruiz C. Traceability markers to the botanical origin in olive oils. J Agric Food Chem. 2010;58:28–38. doi: 10.1021/jf902619z. [DOI] [PubMed] [Google Scholar]
- 6.Christopoulou E, Lazaraki M, Komaitis M, Kaselimis K. Effectiveness of determinations of fatty acids and triglycerides for the detection of adulteration of olive oils with vegetable oils. Food Chem. 2004;84:463–74. doi: 10.1016/S0308-8146(03)00273-5. [DOI] [Google Scholar]
- 7.Azadmard-Damirchi S. Review of the use of phytosterols as a detection tool for adulteration of olive oil with hazelnut oil. Food Addit Contam Part A Chem Anal Control Expo Risk Assess. 2010;27:1–10. doi: 10.1080/02652030903225773. [DOI] [PubMed] [Google Scholar]
- 8.Šmejkalová D, Piccolo A. High-power gradient diffusion NMR spectroscopy for the rapid assessment of extra-virgin olive oil adulteration. Food Chem. 2010;118:153–8. doi: 10.1016/j.foodchem.2009.04.088. [DOI] [Google Scholar]
- 9.Vaclavik L, Cajka T, Hrbek V, Hajslova J. Ambient mass spectrometry employing direct analysis in real time (DART) ion source for olive oil quality and authenticity assessment. Anal Chim Acta. 2009;645:56–63. doi: 10.1016/j.aca.2009.04.043. [DOI] [PubMed] [Google Scholar]
- 10.Baldoni L, Cultrera NGM, Mariotti R, Ricciolini C, Arcioni S, Vendramin GG, et al. A consensus list of microsatellite markers for olive genotyping. Mol Breed. 2009;24:213–31. doi: 10.1007/s11032-009-9285-8. [DOI] [Google Scholar]
- 11.Bracci T, Busconi M, Fogher C, Sebastiani L. Molecular studies in olive (Olea europaea L.): overview on DNA markers applications and recent advances in genome analysis. Plant Cell Rep. 2011;30:449–62. doi: 10.1007/s00299-010-0991-9. [DOI] [PubMed] [Google Scholar]
- 12.Mariotti R, Cultrera NGM, Díez CM, Baldoni L, Rubini A. Identification of new polymorphic regions and differentiation of cultivated olives (Olea europaea L.) through plastome sequence comparison. BMC Plant Biol. 2010;10:211. doi: 10.1186/1471-2229-10-211. [DOI] [PMC free article] [PubMed] [Google Scholar]
- 13.Pafundo S, Agrimonti C, Marmiroli N. Traceability of plant contribution in olive oil by amplified fragment length polymorphisms. J Agric Food Chem. 2005;53:6995–7002. doi: 10.1021/jf050775x. [DOI] [PubMed] [Google Scholar]
- 14.Pafundo S, Agrimonti C, Maestri E, Marmiroli N. Applicability of SCAR markers to food genomics: olive oil traceability. J Agric Food Chem. 2007;55:6052–9. doi: 10.1021/jf0701638. [DOI] [PubMed] [Google Scholar]
- 15.Pasqualone A, Montemurro C, Summo C, Sabetta W, Caponio F, Blanco A. Effectiveness of microsatellite DNA markers in checking the identity of protected designation of origin extra virgin olive oil. J Agric Food Chem. 2007;55:3857–62. doi: 10.1021/jf063708r. [DOI] [PubMed] [Google Scholar]
- 16.Testolin R, Lain O. DNA extraction from olive oil and PCR amplification of microsatellite markers. J Food Sci. 2005;70:108–12. doi: 10.1111/j.1365-2621.2005.tb09011.x. [DOI] [Google Scholar]
- 17.Consolandi C, Palmieri L, Severgnini M, Maestri E, Marmiroli N, Agrimonti C, et al. A procedure for olive oil traceability and authenticity: DNA extraction, multiplex PCR and LDR-universal array analysis. Eur Food Res Technol. 2008;227:1429–38. doi: 10.1007/s00217-008-0863-5. [DOI] [Google Scholar]
- 18.Pafundo S, Busconi M, Agrimonti C, Fogher C, Marmiroli M. Storage-time effects on olive oil DNA assessed by amplified fragments length polymorphisms. Food Chem. 2010;123:787–93. doi: 10.1016/j.foodchem.2010.05.027. [DOI] [Google Scholar]
- 19.Corradini R, Feriotto G, Sforza S, Marchelli R, Gambari R. Enhanced recognition of cystic fibrosis W1282X DNA point mutation by chiral peptide nucleic acids probes by a Surface Plasmon Resonance Biosensor. J Mol Rec. 2004;17:76–84. doi: 10.1002/jmr.646. [DOI] [PubMed] [Google Scholar]
- 20.Calabretta A, Tedeschi T, Di Cola G, Corradini R, Sforza S, Marchelli R. Arginine-based PNA microarrays for APOE genotyping. Mol Biosyst. 2009;5:1323–30. doi: 10.1039/b909912n. [DOI] [PubMed] [Google Scholar]
- 21.Sforza S, Corradini R, Tedeschi T, Marchelli R. Food analysis and food authentication by peptide nucleic acid (PNA)-based technologies. Chem Soc Rev. 2011;40:221–32. doi: 10.1039/b907695f. [DOI] [PubMed] [Google Scholar]
- 22.Germini A, Mezzelani A, Lesignoli F, Corradini R, Marchelli R, Bordoni R, et al. Detection of genetically modified soybean using peptide nucleic acids (PNAs) and microarray technology. J Agric Food Chem. 2004;52:4535–40. doi: 10.1021/jf035355r. [DOI] [PubMed] [Google Scholar]
- 23.Germini A, Rossi S, Zanetti A, Corradini R, Fogher C, Marchelli R. Development of a peptide nucleic acid array platform for the detection of genetically modified organisms in food. J Agric Food Chem. 2005;53:3958–62. doi: 10.1021/jf050016e. [DOI] [PubMed] [Google Scholar]
- 24.Rossi S, Scaravelli E, Germini A, Corradini R, Fogher C, Marchelli R. A PNA-array platform for the detection of hidden allergens in foodstuffs. Eur Food Res Technol. 2006;223:1–6. doi: 10.1007/s00217-005-0034-x. [DOI] [Google Scholar]
- 25.Tedeschi T, Calabretta A, Bencivenni M, Manicardi A, Corrado G, Caramante M, et al. A PNA microarray for tomato genotyping. Mol Biosyst. 2011;7:1902–7. doi: 10.1039/c1mb05048f. [DOI] [PubMed] [Google Scholar]
- 26.D’Agata R, Corradini R, Grasso G, Marchelli R, Spoto G. Ultrasensitive detection of DNA by PNA and nanoparticle-enhanced surface plasmon resonance imaging. Chembiochem. 2008;9:2067–70. doi: 10.1002/cbic.200800310. [DOI] [PubMed] [Google Scholar]
- 27.D’Agata R, Corradini R, Ferretti C, Zanoli L, Gatti M, Marchelli R, et al. Ultrasensitive detection of non-amplified genomic DNA by nanoparticle-enhanced surface plasmon resonance imaging. Biosens Bioelectron. 2010;25:2095–100. doi: 10.1016/j.bios.2010.02.008. [DOI] [PubMed] [Google Scholar]
- 28.Muzzalupo I, Pellegrino M, Perri E. Detection of DNA in virgin olive oils extracted from destoned fruits. Eur Food Res Technol. 2007;224:469–75. doi: 10.1007/s00217-006-0340-y. [DOI] [Google Scholar]
- 29.Busconi M, Foroni C, Corradi M, Bongiorni C, Cattapan F, Fogher C. DNA extraction from olive oil and its use in the identification of the production cultivar. Food Chem. 2003;83:127–34. doi: 10.1016/S0308-8146(03)00218-8. [DOI] [Google Scholar]
- 30.Costa J, Mafra I, Amaral JS, Oliveira MBPP. Detection of genetically modified soybean DNA in refined vegetable oils. Eur Food Res Technol. 2010;230:915–23. doi: 10.1007/s00217-010-1238-2. [DOI] [Google Scholar]
- 31.Kumar S, Kahlon T, Chaudhary S. A rapid screening for adulterants in olive oil using DNA barcodes. Food Chem. 2011;127:1335–41. doi: 10.1016/j.foodchem.2011.01.094. [DOI] [PubMed] [Google Scholar]
- 32.Pérez Pavón JL, del Nogal Sánchez M, Ferńndez Laespada ME, Moreno Cordero B. Determination of filbertone in spiked olive oil samples using headspace-programmed temperature vaporization-gas chromatography-mass spectrometry. Anal Bioanal Chem. 2009;394:1463–70. doi: 10.1007/s00216-009-2795-8. [DOI] [PubMed] [Google Scholar]
- 33.Manicardi A, Calabretta A, Bencivenni M, Tedeschi T, Sforza S, Corradini R, et al. Affinity and selectivity of C2- and C5-substituted “chiral-box” PNA in solution and on microarrays. Chirality. 2010;22(Suppl 1):E161–72. doi: 10.1002/chir.20865. [DOI] [PubMed] [Google Scholar]


