Abstract
Induction of autophagy is known not only to regulate cellular homeostasis but also to decrease triglyceride accumulation in hepatocytes. The aim of this study is to investigate whether DMSO (dimethyl sulfoxide) has a beneficial role in free fatty acid-induced hepatic fat accumulation.
In HepG2 cells, treatment with 0.5 mM palmitate for six hours significantly increased lipid and triglyceride (TG) accumulation, assessed by Oil-red O staining and TG quantification assay. Treatment with 0.01% DMSO for 16 h statistically reduced palmitate-induced TG contents. Pretreatment of 10 mM 3-methyladenine (3MA) for 2 h restored hepatocellular lipid contents, which were attenuated by treatment with DMSO. DMSO increased LC3-II conversion and decreased SQSTM1/p62 expression in a time and dose-dependent manner. In addition, the number of autophagosomes and autolysosomes, as seen under an electron microscopy, as well as the percentage of RFP-LAMP1 colocalized with GFP-LC3 dots in cells transfected with both GFP-LC3 and RFP-LAMP1, as seen under a fluorescent microscopy, also increased in DMSO-treated HepG2 cells. DMSO also suppressed p-eIF2α/p-EIF2S1, ATF4, p-AKT1, p-MTOR and p-p70s6k/p-RPS6KB2 expression as assessed by western blotting. Knockdown of ATF4 expression using siRNA suppressed ATF4 expression and phosphorylation of AKT1, MTOR and RPS6KB2, but increased LC3-II conversion. DMSO reduced not only soluble but also insoluble mtHTT (mutant huntingtin aggregates) expressions, which were masked in the presence of autophagy inhibitor. DMSO, a kind of chemical chaperone, activated autophagy by suppressing ATF4 expression and might play a protective role in the development of fatty acid-induced hepatosteatosis.
Keywords: autophagy, hepatosteatosis, dimethyl sulfoxide, ATF4
Introduction
Although the primary cause of the accumulation of various lipids in the liver is not yet clear, an increased supply of free fatty acids, de novo hepatogenic lipogenesis, decreased oxidation of free fatty acids, and secretion of hepatic VLDL (very low density lipoprotein-triglyceride) have been implicated in the development of nonalcoholic fatty liver disease (NAFLD).1,2 In this regard, NAFLD may be a separate disease with a different pathogenesis, and developing a new molecular model thereof is essential in adequate management of NAFLD or NASH (nonalcoholic steatohepatitis).3,4 Among the practical medical treatments of NAFLD, taurine-conjugated ursodeoxycholic acid (UDCA), known as a chemical chaperone, resulted in the resolution of fatty liver disease and enhancement of insulin action in the liver.5 Recent studies have shown that macroautophagy (henceforth referred to as autophagy) functions within hepatocytes to eliminate misfolded proteins6 as well as to degrade hepatocellular triglyceride accumulation.7-9 Based on these reports, we hypothesized that stored fat could be decreased not only through inhibition of lipogenesis but also through clearance of hepatocellular lipids. Therefore, we investigated whether dimethyl sulfoxide (DMSO), a member of the group of compounds with low molecular weight called chemical chaperones,10 has a beneficial role in reducing free fatty acid-induced hepatic fat accumulation.
Results
DMSO reduces lipid accumulation in hepatocytes
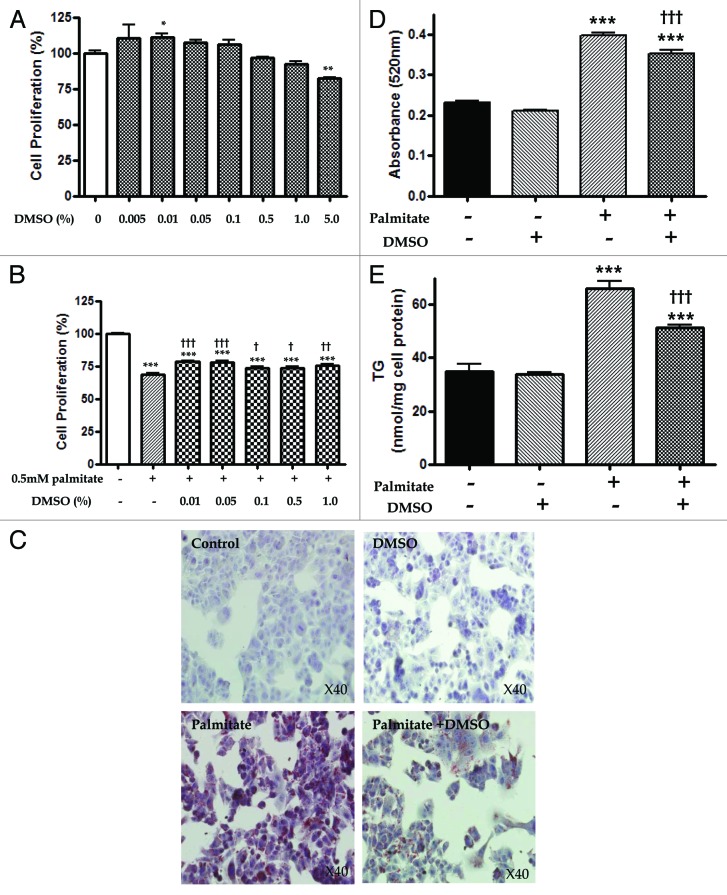
DMSO was reported to induce cytotoxicity.11,12 In this regard, we performed an MTT assay to determine the relative proliferation or viability (presented as the percentage of untreated control) of a human hepatoma cell line (HepG2 cells) after 24 h of DMSO (0, 0.005, 0.01, 0.05, 0.1, 0.5, 1.0 and 5.0%) treatment. DMSO at concentrations of 0.005 to 0.1% proved beneficial to proliferation, but proliferation decreased for concentration at or higher than 0.5% with significance at the concentration of 5% (82.39 ± 1.07, p < 0.01) (Fig. 1A). HepG2 cells exposed to 0.5 mM palmitate for 24 h showed significantly decreased cell proliferation (68.52 ± 3.03, p < 0.001). Pre-treatment with 0.01, 0.05, 0.1, 0.5 and 1.0% DMSO for 16 h partially alleviated the palmitate-induced HepG2 cell toxicity with significance (Fig. 1B).
Figure 1. DMSO reduces lipid accumulation in hepatocytes proliferation and lipid accumulation of HepG2 cells after treatment with DMSO in the absence or presence of palmitate. (A) In the MTT assay, relative proliferation (presented as % of untreated control) of HepG2 cells exposed to DMSO for 24 h decreased at higher than 0.5%: 96.82 ± 1.72% with 0.5%, 92.15 ± 5.25 with 1.0% and 82.39 ± 1.07 with 5.0% (p < 0.01). (B) HepG2 cells exposed to 0.5 mM palmitate for 24 h showed significantly decreased cell proliferation (68.52 ± 3.03, p < 0.0 01), and pre-treatment with 0.01, 0.05, 0.1, 0.5 and 1.0% DMSO for 16 h partially prevented palmitate-induced HepG2 cell toxicity with significance. Results are representative of eight independent experiments. (C and D) In microscopy staining of cells with Oil red O and a spectrophotometer analysis, treatment with 0.5 mM palmitate increased lipid accumulation, but pretreatment with 0.01% DMSO before 0.5 mM palmitate exposure significantly reduced free fatty acid-induced lipid content. (E) In triglyceride determination, pretreatment with 0.01% DMSO also partially restored free fatty acid-induced triglyceride (TG) accumulation (66.01 ± 5.40 vs. 51.48 ± 2.75 p < 0.001). The experiments were performed six times to determine MTT and ORO as well as TG under identical conditions. The results are shown as mean ± SEM *p < 0.05, **p < 0.01, ***p < 0.001 vs. untreated control cells. †p < 0.05, ††p < 0.01,†††p < 0.001 vs. palmitate-treated cells.
Intracellular lipid accumulation was analyzed by microscopy after staining with cells with Oil red O (ORO), and quantification using a spectrophotometer at 520 nm. Since triglyceride (TG) is the major component of the lipid droplets, we also checked the TG content of the cells in this experiment. Thereby, we could observe visible lipid droplets in cells incubated with palmitate (Fig. 1C). Compared with the untreated controls, HepG2 cells treated with 0.01% DMSO for 16 h showed minimally decreased assessable lipid content (0.23 ± 0.01 vs. 0.21 ± 0.003) without statistical significance as assessed by fat quantization with ORO (Fig. 1D). HepG2 cells exposed to 0.5 mM palmitate for 6 h showed significantly increased lipid accumulation (0.23 ± 0.01 vs. 0.40 ± 0.02. p < 0.001) and TG determination (34.98 ± 5.76 vs. 66.01 ± 5.40 p < 0.001) (Fig. 1D and E). Pretreatment with 0.01% DMSO before exposure to 0.5 mM palmitate for 6 h also partially inhibited free fatty acid-induced lipid contents (0.40 ± 0.02 vs. 0.35 ± 0.02, p < 0.001) and TG accumulation (66.01 ± 5.40 vs. 51.48 ± 2.75 p < 0.001) with significance, suggesting a limited modulating role among different lipogenic and lipid clearance pathways.
DMSO induces autophagy
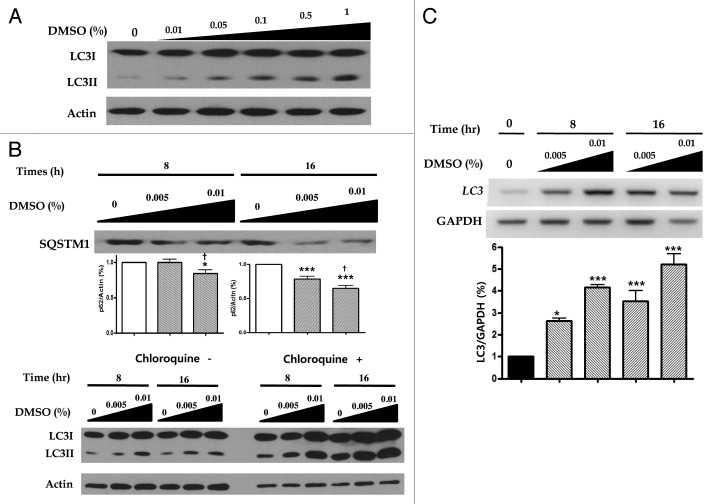
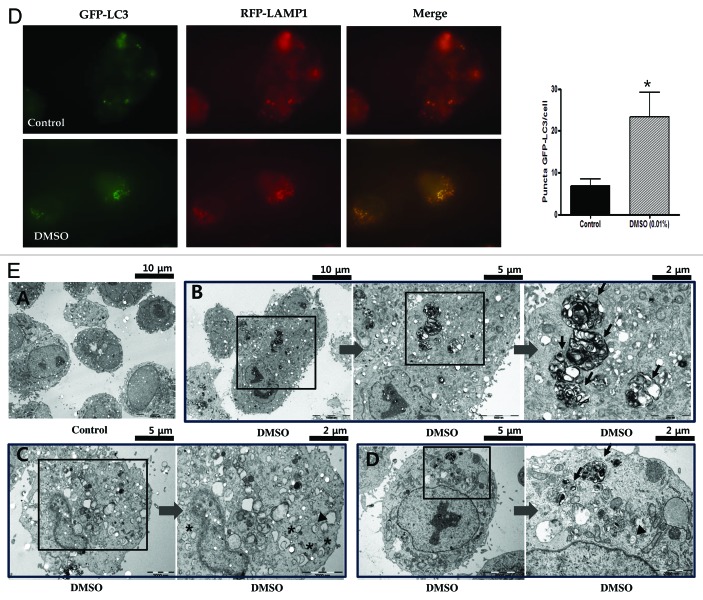
To elucidate the possible mechanism of macrolipophagy-mediated clearance of lipid droplets,7 steps of autophagy that can be monitored were performed. First, LC3 (microtubule-associated protein 1 light chain 3)-II conversion of HepG2 cells treated with 0.01 to 1.0% DMSO for 16 h was increased in a dose-dependent manner, monitored by western blotting (Fig. 2A). HepG2 cells exposed to 0.05 and 0.1% DMSO for 8 to 16 h were shown to increase LC3-II conversion and decrease SQSTM1/p62 (hereafter SQSTM1) in a dose- and time-dependent manner (Fig. 2B). Second, we tested for whether increased DMSO could be due to either the induction of autophagy or the inhibition of lysosomal degradation by using autophagic flux assay. In the presence of 50 µM lysomal inhibitor chloroquine, more decrease in SQSTM1 expression and increased expression of LC3-II conversion were found in a time- and dose-dependent manner than by DMSO alone (Fig. 2B). To determine the RNA levels of LC3, we employed reverse transcription polymerase chain reaction (RT-PCR). Time and dose-dependent expression of LC3 transcription was also found in HepG2 cells treated with 0.01% DMSO (Fig. 2C). Third, HepG2 cells were infected with a specific autophagic marker GFP-LC3 (comprising green fluorescent protein fused to the N-terminus of LC3), and visualized by fluorescence microscopy. As presented in Figure 2D, a punctate pattern of GFP-LC3 accumulated upon the challenge with 0.01% DMSO, an excessive number of dots appeared in DMSO-treated cells compared the control groups (6.86 ± 4.37 vs. 23.38 ± 16.32, p < 0.05). In addition, HepG2 cells were also co-transfected with both GFP-LC3 and RFP-LAMP1 (lysosome associated membrane protein 1-tagged with red fluorescent protein) and then treated with 0.01% DMSO for 16 h. Fluorescence microscopy showed RFP-LAMP1 colocalized with GFP-LC3 in the cytoplasm. Finally, one pathognomonic feature of autophagy is the ultrastructural evidence of autophagosomes. We ultimately examined DMSO-treated HepG2 cells using an electron microscope to confirm the induction of autophagy. Figure 2E shows that after 16 h of exposure to 0.01% DMSO autophagosomes and autolysosomes are abundantly present.
Figure 2. DMSO induces autophagy DMSO modulates the expression of the autophagy. (A) In monitoring the induction steps of autophagy, assessed by LC3-I conversion to LC3-II, converted LC3-II expressions were increased in a dose-dependent manner as 0.01 to 1.0% DMSO treatment concentration for 16 h increased. (B) HepG2 cells treated with 0.005 and 0.01% DMSO for 8 and 16 h showed decreased SQSTM1 expression and increased LC3-II conversion in a time-dependent manner. Results are representative of five independent experiments. In LC3 flux assays by immunoblot, in the absence or presence of 50 μM chloroquine (CQ, lysosomal inhibitors), DMSO increased the LC3-II conversion in a time (0, 8, 16 and 24 h) and dose (0, 0.005, 0.01)-dependent manner, and chloroquine further upregulated LC3-II expression in the same manners (B, lower panel). (C) The level of mRNA expression of LC3 was also increased by DMSO treatment in a dose- and time-dependent manner. Results are representative of three independent experiments. Results are shown as mean ± SEM *p < 0.05, ***p < 0.001 vs. untreated control cells, †p < 0.05 vs. 0.005% DMSO-treated cells. (D) For monitoring of the vesicle formation step of autophagy and autophagosomes-lysosome fusion, assessed by fluorescence microscopic assay, colocalized punctate patterns of autophagy marker GFP-LC3 and RFP-LAMP1 were increased in response to autophagic induction d by 0.01% DMSO. (E) An excessive number of dots appeared in DMSO-treated cells in view of controls (6.86 ± 4.37 vs. 23.38 ± 16.32, p < 0.05). The experiments were performed seven times under identical conditions. In transmission electron microscopy, ultrastructure of HepG2 cells treated with 0.01% DMSO for 16 h was analyzed. Arrow heads, autophagosome; arrows, autolysosome; asterisks, curved phagophore.
Figure 2D and E. See previous page for figure legend.
Inhibition of autophagy blocks DMSO-induced reduction of lipid accumulation
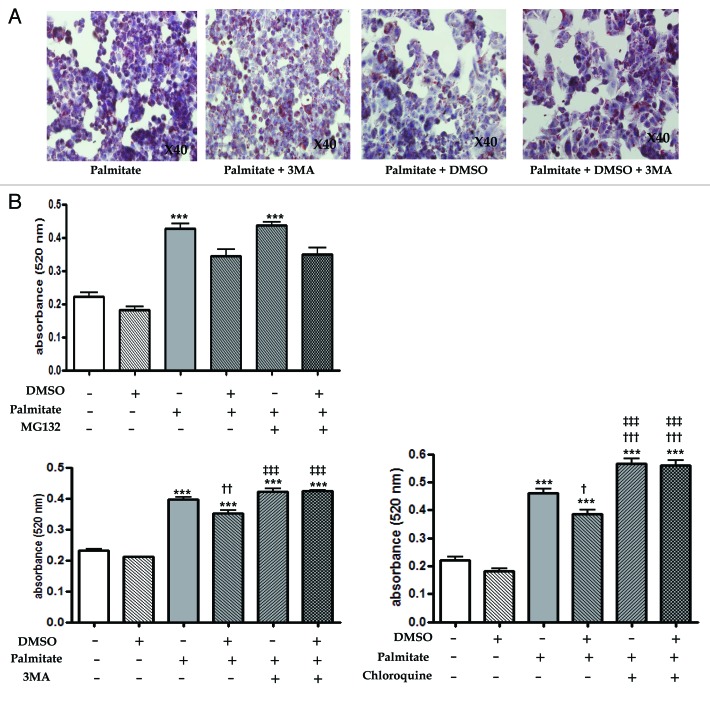
In order to verify the hypothesis stating that DMSO could attenuate free fatty acid-induced lipid accumulation via macrolipophagy induction, we investigated its autophagic role in the presence or absence of (1) MG132 for ubiquitin-proteasome inhibition, (2) 3-methyladenie (3MA) for autophagy inhibition, and (3) chloroquine for lysosomal inhibition. Similar to previous results, in Figure 1D and E, 0.5 mM palmitate at 6 h significantly increased lipid accumulation; however, 0.01% DMSO partially attenuated palmitate-induced lipid accumulation (Fig. 3A and B). In the treatment of MG132, a potent membrane-permeable proteasome inhibitor, no statistical difference in lipid accumulation was found between cells treated with palmitate + DMSO and those with palmitate + DMSO + MG132 (0.34 ± 0.05 vs. 0.35 ± 0.06, p > 0.05), suggesting no involvement of proteasome on the lipid reducing effects of DMSO. In the treatment of 3-MA, which inhibits autophagy by blocking autophagosome formation via the inhibition of type III phosphatidylinositol 3-kinases (PtdIns3K) at the sequestration stage, where a double-membrane structure forms around a portion of the cytosol and sequesters it from the rest of cytoplasm to form the autophagosomes,13 a significant difference in lipid content was found between cells treated with palmitate + DMSO and those with palmitate + DMSO + 3-MA (0.35 ± 0.02 vs. 0.42 ± 0.01, p < 0.001). Chloroquine is known to accumulate in lysosomes due to its weak base properties and inhibit the lysosomal pathway of protein degradation. There was a significant difference in lipid content between cells treated with palmitate + DMSO and those treated with palmitate + DMSO + chloroquine (0.42 ± 0.01 vs. 0.56 ± 0.05, p < 0.001).
Figure 3. Inhibition of autophagy blocks the effects of DMSO that reduces lipid accumulation. Lipid accumulation was determined by fat quantization in the presence or absence of the ubiquitin-proteasome inhibitor (MG132), the specific autophagy inhibitor (3-methyladenie, 3MA) and the lysosomal inhibitor (chloroquine, CQ). These inhibitors were pretreated for 2 h and then 0.01% DMSO added to each wells. (A and B) After treatment of 0.01% DMSO for 16 h, HepG2 cells were exposed 0.5 mM palmitate for 6 h. Palmitate-treated HepG2 cells (0.5 mM for 6 h) exhibited a significant increase in lipid accumulation. Compared with cells treated with palmitate and DMSO, no statistical difference in the treatment of 1 mM MG132 was observed. Treatment of 10 mM 3MA or 50 mM chloroquine in the presence of DMSO and palmitate significantly increased lipid content. The lipid content of cells treated with palmitate + 3MA were similar to those of cells treated with palmitate alone. (B) The lipid content of cells treated with palmitate + chloroquine were significantly higher than those of cells treated with palmitate alone were (0.57 ± 0.05 vs. 0.46 ± 0.05, p < 0.001). Results are representative of five independent experiments. Results are shown as mean ± SEM ***p < 0.001 vs. untreated control cells, †p < 0.05, ††p < 0.01, †††p < 0.01 vs. palmitate-treated cells, ‡‡‡p < 0.01 vs. palmitate and DMSO-treated cells.
DMSO reduces expression of ER stress markers and induces autophagy
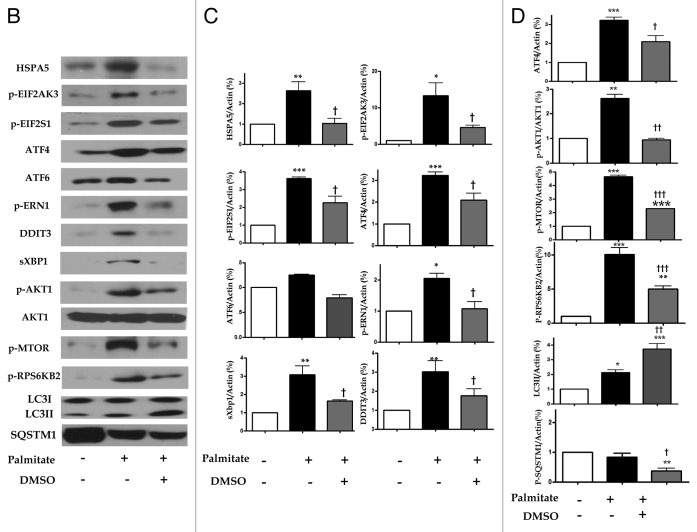
To elucidate the hypothesis stating that downregulation of an unfolded protein response or ER stress markers, such as GRP78/HSPA5 (hereafter HSPA5), p-PERK/p-EIF2AK3 (hereafter EIF2AK3), p-eIF2α/p-EIF2S1 (hereafter p-EIF2S1), ATF4, ATF6, p-IRE1/p-ERN1 (hereafter p-ERN1), sXBP1 and CHOP/DDIT3 (hereafter DDIT3) by DMSO, would induce autophagy, with DMSO acting as a chemical chaperone, western blotting assay was performed. In the absence of a stressor, DMSO inhibited upstream of unfolded protein response or ER stress pathway, such as phosphorylation of p-EIF2AK3, EIF2S1 and the expression of ATF4, ATF6, p-AKT1 and p-MTOR in a time- and dose-dependent manner (Fig. 4A). Similar to previous reports on palmitate-induced increased expression of ER stress markers in various cell lines,14-16 HepG2 cells exposed to 0.5 mM palmitate for 6 h significantly activated HSPA5, p-EIF2AK3, p-EIF2S1, ATF4, ATF6, p-ERN1, sXBP1 and DDIT3 with significance (Fig. 4A and B). Regarding upregulated LC3II conversion as a self-protecting mechanism in our hypothesis, autophagy induction might be upregulated in response to ER stress, which could be also considered as a stressor marker. As expected, 0.01% DMSO efficiently inhibited palmitate-induced ER stress marker (Fig. 4B and C). Of the ER stress markers, EIF2S1 phosphorylation is also known to be a critical part of the PtdIns3K/AKT1/MTOR/ RPS6KB2 pathway, which may regulate either autophagy induction or suppression.17 The downstream target of phophorylated EIF2S1 is ATF4, and knockdown of ATF4 expression can induce autophagy.18 As shown in Figure 4B and D, 0.01% DMSO reduced the expression of phophorylated EIF2S1, ATF4, p-AKT1, p-MTOR and p-RPS6KB2, resulting in activated LC3II conversion and increased autophagy flux as confirmed by decreased levels of SQSTM1. As seen in Figure 4B and D, decreased expression of SQSTM1 in the presence of 0.5 mM palmitate alone was further decreased by addition of DMSO.
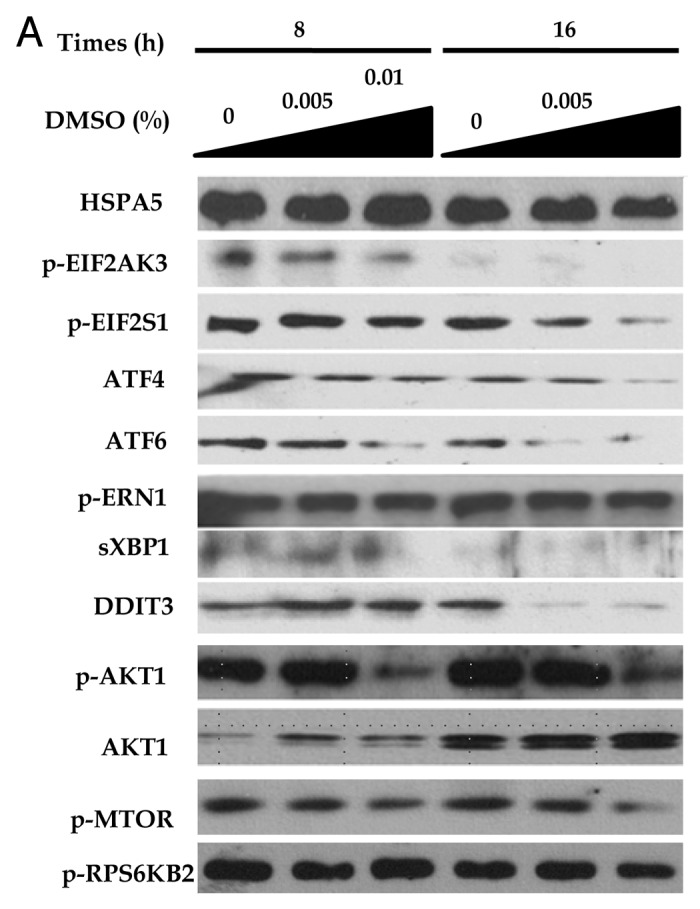
Figure 4. DMSO reduces expression of ER stress markers and induces autophagy effects of DMSO on cultured HepG2 cells. (A) In western blotting assays, DMSO downregulated the expression of ER stress markers in a time- and dose-dependent manner. (B and C) DMSO inhibits palmitate-induced ER stress markers. HepG2 cells exposed to 0.5 mM palmitate showed significant increase in ER stress markers (HSPA5, p-EIF2AK3, p-EIF2S1, ATF4, ATF6, p-ERN1, sXBP1 and DDIT3). Pretreatment of 0.01% DMSO significantly reduced palmitate-induced ER stress. (D) DMSO reduced the expression of phosphorylated EIF2S1, ATF4, p-AKT1, p-MTOR and p-RPS6KB2 resulting in activated LC3II conversion and decreased levels of SQSTM1. These experiments were performed four times under identical conditions. Results are shown as mean ± SEM **p < 0.01, ***p < 0.001 vs. untreated control cells. †p < 0.05, ††p < 0.01, †††p < 0.01 vs. palmitate-treated cells.
Figure 4B–D. See previous page for figure legend.
DMSO-induced autophagy is controlled through ATF4-mediated downregulation of phosphorylated AKT1
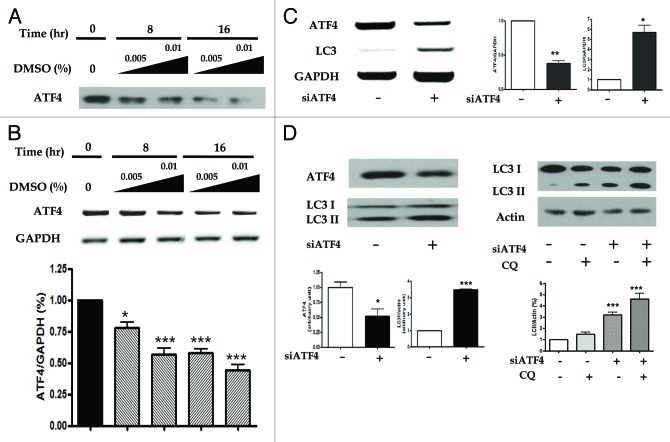
To determine the pivotal role of ATF4 in DMSO-induced autophagy, we tested the RNA levels of ATF4 using reverse transcription polymerase chain reaction (RT-PCR). As shown in Figure 5A and B, a time- and dose-dependent significant suppression of ATF4 in protein and mRNA levels was found in HepG2 cells treated with 0.01% DMSO treatment. We also investigated its effects under ATF4 knockdown conditions. We transfected HepG2 cells with siRNA molecules against ATF4 and then incubated them in the presence or absence of palmitate. As shown in Figure 5C and D, siRNA against ATF4 significantly increased LC3-II conversion. We also found that in the presence of chloroquine (1.0 ± 0.0 vs. 4.62 ± 0.99, p < 0.001), the expression of LC3-II was further increased than by siATF4 alone (1.0 ± 0.0 vs. 3.21 ± 0.48, p < 0.001) (Fig. 5D).
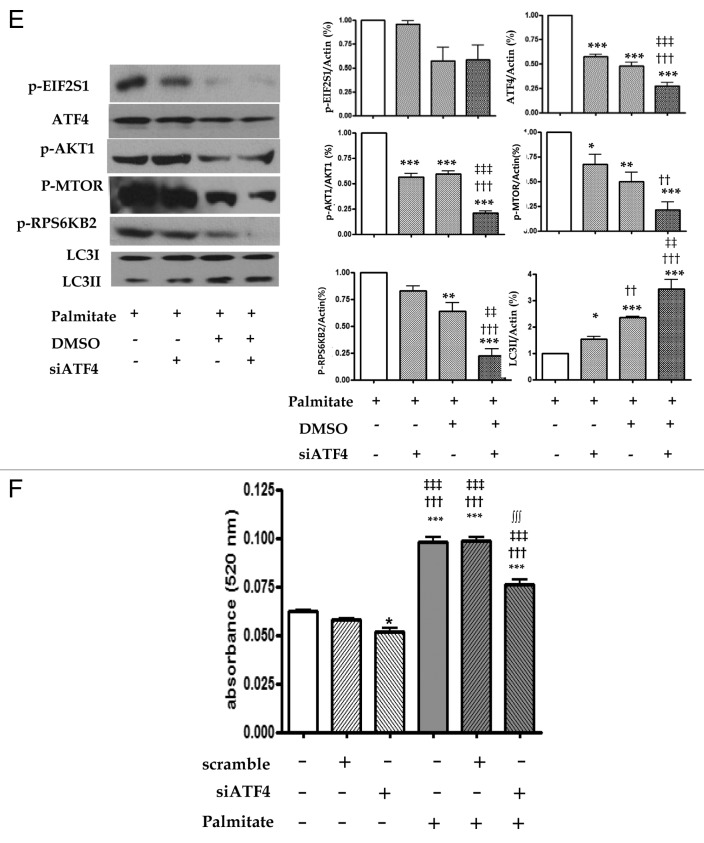
Figure 5. DMSO-induced autophagy is controlled through ATF4-mediated downregulation of phosphorylated AKT1. Expression of ATF4 and LC3 were assessed by western blotting and RT-PCR in the presence of siRNA against ATF4. (A and B) ATF4 siRNA were transiently transfected into HepG2 cells with LipofectAMINE 2000. The level of protein and mRNA expression of ATF4 was suppressed a dose- and time-dependent manner in HepG2 cells treated with 0.01% DMSO treatment. siRNA-transfected HepG2 cells were treatment 0.5 mM palmitate in the absence or presence of 0.01% DMSO for 6 h. (C) Knockdown of ATF4 expression significantly increased mRNA and protein expression of LC3 (D, left panel). And right panel of (D) indicated autophagic flux assays in the absence or presence of 50 nM CQ. The expression of LC3-II was further increased than by siATF4 alone. The experiments were performed five times under identical conditions. Results are shown as mean ± SEM *p < 0.05, **p < 0.01, ***p < 0.001 vs. untreated control cells. (E) Knockdown of ATF4 expression using siRNA suppressed ATF4 expression and phosphorylation of AKT1, MTOR and RPS6KB2, but increased LC3-II conversion. The experiments were performed four times under identical conditions. Results are shown as mean ± SEM *p < 0.05, **p < 0.01, ***p < 0.001 vs. palmitate-treated cells, ††p < 0.01, †††p < 0.001 vs. palmitate and si-ATF4-treated cells, ‡‡p < 0.01, ‡‡‡p < 0.001 vs. palmitate and DMSO-treated cells. To demonstrate the attenuation of the palmitate-induced lipid accumulation by the knockdown of ATF4, lipid accumulation was determined by fat quantization in the presence of siRNA against ATF4. Scramble siRNA and ATF4 siRNA were transiently transfected into HepG2 cells with LipofectAMINE 2000. (F) Transfected HepG2 cells were treated palmitae for 6 h. siRNA against ATF4 statistically decreased palmitate-induced lipid accumulation. The experiments were performed four times under identical conditions. *p < 0.05, ***p < 0.001 vs. untreated control cells, †††p < 0.001 vs. scramble RNA-treated cells, ‡‡‡p < 0.001 vs. siATF4-treated cells, ∫∫∫p < 0.001 vs. palmitate-treated cells.
We checked the effect of ATF4 silencing on autophagy by detecting LC3-II using western blot. As shown in Figure 5E, treatment with ATF4 siRNA decreased the expression of ATF4, p-AKT1, p-MTOR and p-RPS6KB2, significantly in ATF4 (1.0 ± 0.0 vs. 0.57 ± 0.05, p < 0.001), p-AKT1 (1.0 ± 0.0 vs. 0.56 ± 0.09, p < 0.001) and p-MTOR (1.0 ± 0.0 vs. 0.67 ± 0.24, p < 0.05). However, the same treatment significantly increased the expression of LC3-II (1.0 ± 0.0 vs. 1.54 ± 0.27, p < 0.05).
Figure 5E and F. See previous page for figure legend.
The knockdown of ATF4 attenuates the palmitate-induced lipid accumulations
Intracellular lipid accumulation was analyzed using a spectrophotometer at 520 nm under ATF4 knockdown conditions. siRNA against ATF4 significantly attenuated palmitate-induced lipid accumulation (0.098 ± 0.008 vs. 0.076 ± 0.009, p < 0.001) in Figure 5F.
The aggregation of polyglutamine was reduced by DMSO-induced autophagy
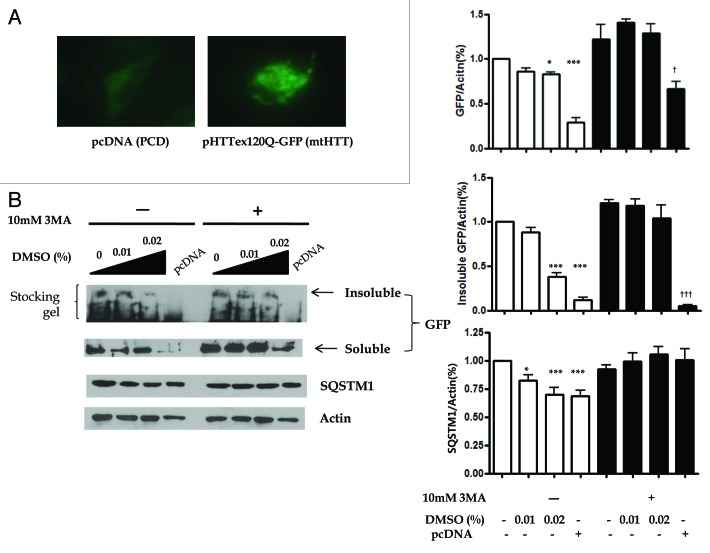
To confirm whether the DMSO-induced autophagy can also degrade protein aggregates, we established a cell-based functional assay using a GFP-fused segment of HTT exon1 containing expanded polyglutamine (n = 120).19,20 The transfection of pHTTex120Q-GFP (mtHTT) into cells alone could induce the expression of dot-like aggregates in HepG2 cells. As shown in Figure 6A, we found the aggregation and localization of GFP-fused mtHTT in HepG2 cells under fluorescence microscope. To elucidate whether chemical chaperones leads to alleviation in mtHTT aggregation in HepG2 cells, we explored the effect of DMSO on mtHTT aggregates. Cells were also transfected with pcDNA (PCD) as a negative control. We separated polyglutamine aggregates to separate mtHTT aggregates into detergent-soluble and insoluble fraction and quantify the level of soluble and insoluble mtHTT proteins. As seen in Figure 6B, DMSO significantly alleviated insoluble mtHTT expression (1.0 ± 0.0 vs. 0.88 ± 0.12, 0.38 ± 0.11, 0.11 ± 0.08, p < 0.001 for 0.02% DMSO and pcDNA), which were not found in the presence of 3-methyladenie (3MA) (1.21 ± 0.09 vs. 1.18 ± 0.17, 1.04 ± 0.31, 0.05 ± 0.023). Autophagy flux assessed by SQSTM1 was decreased by treatment with DMSO.
Figure 6. The aggregation of polyglutamine was reduced by DMSO-induced autophagy. (A) Aggregates of pHTTex120Q-GFP (mtHTT), assessed by fluorescence microscopic assay, were formed by transfection of mtHTT into HepG2 cells using Lipofectamin 2000. HepG2 cells transfected with either pHTTex120Q-GFP (mtHTT) or pcDNA for 20 h were treated with 0.00 to 0.02% DMSO for 16 h. Cell lysates were prepared, separated into soluble and insoluble fractions and performed using western blotting with anti-GFP or anti-actin antibody. (B) The soluble and insoluble mtHTT expressions were attenuated by the treatment of DMSO but not in the presence of 3MA. The expressions of SQSTM1 were also significantly decreased. The experiments were performed five times under identical conditions. *p < 0.05, ***p < 0.001 vs. untreated control cells in the absence of 3MA, †p < 0.05, †††p < 0.001 vs. untreated control cells in the presence of 3MA.
Discussion
In a human disease model, inactivation of autophagy results in cytosolic protein inclusions, such as misfolded proteins and excess accumulation of damaged organelles, which lead to liver injury and other diseases.21 It has recently become known that autophagy mediates the elimination of stored lipid droplets and that inhibition of autophagy leads to the development of hepatosteatosis.7-9,22 Based on these findings, Singh et al. described the process of cellular lipid storage and the autophagic machinery allowing the targeting of a lipid cargo by lysosomes for degradation as macrolipophagy.7,9 In view of these facts, our attention was drawn to the antilipotoxic effects of chemical chaperones on clearing fat droplet accumulation in human hepatocellular carcinoma cells.
We hypothesized that DMSO (dimethyl sulfoxide) activates induction of autophagy, or so called macrolipophagy via downregulation of the ATF4/AKT1 pathway.5 First, we observed that the proliferation or viability of HepG2 cells treated with DMSO for 24 h proved beneficial to proliferation, as assessed by MTT, at low concentrations (0.005 to 0.1%), but showed decreased proliferation at concentrations higher than 0.5%. Although MTT assay is generally used to indicate cell proliferation and cell death, it is mainly a mitochondrial functional assay. In this regard, we postulated that DMSO at low concentrations might play a protective role on the mitochondria and cell proliferation. Next, when we evaluated its attenuating effects on lipid accumulation using oil red O staining and TG quantification assay, we found that pretreatment with 0.01% DMSO before 0.5 mM palmitate exposure significantly reduced free fatty acid-induced lipid content and TG accumulation, while untreated controls did not show such reduction. In addition, this attenuation of palmitate-induced lipid accumulation by DMSO could not be observed in the presence of 3-methyladenine. These results suggest that treatment of DMSO partially attenuates lipid accumulation in human hepatocellular carcinoma cell lines. To differentiate whether or not DMSO enhances autophagy-dependent degradation, we verified the induction of autophagy through autophagy monitoring (related LC3 binding protein turnover assays for the induction steps of autophagy and SQSTM1) in the absence or presence of lysosomal inhibitors chloroquine, fluorescence microscopy for colocalization of the GFP-LC3 and RFP-LAMP1 punctate, and electron microscopy for detection of autophagosomes and autolysosomes.
Chemical chaperones were reported to alleviate ER stress.23,24 In accordance with the cytoprotective effects of a chemical chaperones, treatment with DMSO decreased the expression of ER stress markers even in the absence of stress (Fig. 4A). As expected, exposure to 0.5 mM palmitate for 6 h significantly activated HSPA5, p-EIF2AK3, p-EIF2S1, ATF4, ATF6, p-ERN1, sXBP1 and DDIT3. Similar to previous reports on ER stress-induced autophagy induction across various cell types including yeast and mammalian cells, 0.5 mM palmitate not only caused ER stress but also upregulated autophagy flux confirmed by increased LC3-II conversion and decreased expression of SQSTM1 in this study (Fig. 4B). We postulated that the induction of autophagy in this condition might be considered as a self-protective mechanism against cell stress. Among the ER stress makers, phosphorylation of EIF2S1 increases and enables translation of ATF4 in response to unfolded protein response and ER stress, and the suppression of EIF2S1 phosphorylation efficiently decreases the level of phospho-AKT1, which regulates MTOR activity and its autophagy induction.17,25 Treatment with 0.01% DMSO significantly inhibited palmitate-induced ER stress markers and augmented the LC3-II conversion via suppression of p-EIF2S1, ATF4, p-AKT1 and p-MTOR in this study (Fig. 4D). We hypothesized that downregulation of ATF4 by DMSO might play an essential role in inducing autophagy. To test this hypothesis, we demonstrated the dose and time-dependent suppression of ATF4 by DMSO in protein and m-RNA levels (Fig. 5A and B). Knockdown of ATF4 expression using siRNA significantly suppressed expression of ATF4, p-AKT1, p-MTOR and RPS6KB2 but increased LC3-II conversion (Fig. 5E). However, the knockdown effects of ATF4 siRNA did not attenuate the phosphorylation of EIF2S1. These results could support our hypothesis that ATF4 inhibition is an important mechanism for lipid clearance in free fatty acid-induced lipid accumulation. Concerning the expression of p-AKT1 in the p-AKT1/MTOR pathway, it is known that expression of p-AKT1 is increased in the early phase of exposure, and decreased in prolonged exposure to palmitate, while that of MTOR is increased in a time- and dose-dependent manner. In this regard, we postulated that the induction of macrolipophagy by DMSO might be different from that achieved by palmitate. And we tried to confirm the autophagy-mediated lipid clearance mechanism. Our results showed that the treatment of HepG2 cells with DMSO reduced palmitate-induced lipids, but in the presence of the specific autophagy inhibitor 3-methyladenine (3MA), treatment with DMSO did not reduced the amount of lipid. In addition, UPS (ubiquitin/proteasome system) is known to play a major role in the highly regulated extralysosomal degradation of cytosolic proteins and of proteins residing in the nucleus and endoplasmic reticulum in eukaryotic cells.26 Since there was no difference in lipid accumulation in cells treated with MG132 in the presence of palmitate and DMSO, we suggest that the potential proteasomal inhibition of DMSO might be actually negligible. Taken together, our results suggest that DMSO attenuated lipid accumulation through activation of the macrolipophagy pathway, which appears to be one of the possible mechanisms by which DMSO attenuates free fatty acid-induced cellular lipotoxicity.
There may be considerable debate as to whether the ability of DMSO is specifically beneficial for removing free fatty acid-induced hepatic lipid accumulation or is also applicable in degrading protein aggregates. To answer the possible debate, we adopted a cell-based functional assay using a GFP-fused segment of HTT exon1 containing expanded polyglutamine (mtHTT).19,20 In previous reports on mtHTT in neuronal cell lines, increased levels of molecular chaperones, such as chaperonin TRiC and HSP70, and chemical chaperone, 4-PBA, reduced both mtHTT aggregation and neural cell apoptosis.20,27-29 Comparable to many cases, DMSO reduced not only soluble but also insoluble mtHTT expressions, which were masked in the presence of autophagy inhibitor. From these results, it is plausible that DMSO might affect various types of autophagy.
There is a limitation to this study. We did not demonstrate DMSO-induced macrolipophagic effects in an animal model.
In conclusion, DMSO, a kind of chemical chaperone, activates autophagy by suppressing ATF4 expression and might play a protective role in the development of free fatty acid-induced hepatosteatosis. Further investigation is needed to verify the beneficial roles of chemical chaperones prior to treatment of patients with hepatosteatosis or NAFLD.
Materials and Methods
Cell culture
Human hepatoma cell line HepG2 cells were grown at 5% CO2 in Dulbecco's Modified Eagle's Medium (DMEM) (Welgene, LM 001-05) containing antibiotics and 10% fetal calf serum (Welgene, S101-01).
Free fatty acid (FFA) preparation
FFA solutions were prepared as described in reference.30 Briefly, 100 mM palmitate (Sigma, P9767) stocks were prepared in 0.1 M NaOH at 70°C and filtered. One percent (weight/volume) palmitate-free BSA (Sigma, A2153) solution was prepared in serum-free DMEM. After the palmitate dissolved, the palmitate solutions were added to serum-free DMEM containing BSA. The 5 mM palmitate/1% BSA solution was prepared by complexing appropriate amounts of palmitate to 1% BSA in a 40°C water bath.
Cell proliferation assessed by MTT
HepG2 cells were dispensed in wells of 24-well plates at a density of 5 × 10⁴ cells/well. HepG2 cells were pre-treated with various concentration of DMSO (0.01, 0.05, 0.1, 0.5 and 1.0%) for 16 h and then the cells were incubated in the presence of 0.5 mM palmitate for 24 h. The cells were then treated with 0.5 mg/ml 3-(4,5-dimethylthiazol-2-yl)-2,5-diphenyl-tetrazolium bromide (MTT) (Sigma, M5655) for 4 h at 37°C and then dissolved in 250 μl DMSO. After 30 min at room temperature, absorbance was measured at 570 nm using a micro-plate reader (Molecular Devices).
Fat quantization by Oil Red O staining and triglyceride determination
Lipid droplets were visualized by Oil Red O (Sigma, O0625) staining. After treatment with 0.5 mM palmitate in the presence or absence of 0.01% DMSO, the cells were fixed with 10% formalin for 1 h and then stained in pre-warmed Oil Red O solution for 1 h in a 60°C water bath. The red-stained lipid droplets were observed under a light microscope. To measure the quantification of lipid accumulation, Oil Red O was eluted by adding 100% isopropanol and optical density was detected using a spectrophotometer at 520 nm. Triglyceride levels in cells were determined using a triglyceride measurement kit (BioVision, K622-100) following the guideline provided by the company.
Detection of autophagy
In this study, autophagy was then induced in cells, which were maintained with complete medium by adding 0.005% and 0.01% DMSO for 8 to 24 h supplemented with 5% FBS. Autophagy was determined by (1) detection of autophagic flux, autophagosome substrates SQSTM1 and the specific processing of the autophagy protein LC3 with or without a 50 µM lysosomal protease inhibitor, chloroquine, (Sigma, C6628) by western blot analysis31; (2) detection of autophagosomes with GFP-LC3 marker by fluorescence microscopy (GFP-LC3 punctate assay); and (3) detection of autophagosomes and autolysosomes using transmission electron microscopic assay. For the GFP-LC3 punctate assay, HepG2 cells were transfected with plasmids expressing GFP-LC3 (ORIGINE, RC100021). Twenty-four hours after treatment with 0.01% DMSO, these cells were fixed with 4% paraformaldehyde and were then observed under a fluorescence microscope. Cells were classified as having a predominantly diffuse GFP stain or having numerous punctate structures representing autophagosomes. At least 30 cells were scored in each of two independent experiments.32 In addition, HepG2 cells were also co-infected with both GFP-LC3 and RFP-LAMP1 (lysosome associated membrane protein 1-tagged with red fluorescent protein) and then treated with 0.01% DMSO for 16 h. Fluorescence microscopy showed RFP-LAMP1 colocalized with GFP-LC3 in the cytoplasm. For detection of autophagosomes using electron microscopic assay, 0.01% DMSO treated-HepG2 cells were fixed with 2% glutaraldehyde-2% paraformaldehyde buffered with 0.1 M phosphate buffer (pH 7.2) overnight at 4°C, post-fixed with 1% osmium tetroxide in a 0.1M sodium cacodylate buffer (pH 7.4) for 1 h at room temperature, and were dehydrated with a graded series of ethanol. The dehydrated pellets were then embedded in Epon.
Immunoblotting
Cells were lysed in PRO-PREPTM (iNtRON biotechnology, 17081). Whole cell lysates were resolved by SDS-PAGE, electroblotted onto a nitrocellulose membrane (BIO-RAD, 162-0115), and probed with the indicated antibodies. Horseradish peroxidase-conjugated anti-rabbit (Santa Cruz Biotechnology, SC-2004) or anti-mouse secondary antibodies (Santa Cruz Biotechnology, SC-2005) were used along with the ECL Plus system (Amersham Biosciences, RPN2132) to visualize immunoreactive bands.33 Proteins were detected using the following primary antibodies: LC3B (Cell Signaling Technology, 2275), ATF4 (Santa Cruz Biotechnology, C-20), HSPA5 (Abcam, ab21685), p-EIF2AK3 (Santa Cruz Biotechnology, SC-32577), p-EIF2S1 (Cell Signaling Technology, 3597), ATF6 (Abcam, ab11909), p-ERN1 (Santa Cruz Biotechnology, SC-20790), sXbp1 (BioLegend, 619502), DDIT3 (Santa Cruz Biotechnology, SC-575), AKT1 (Cell Signaling Technology, 4691), phospho-AKT1 (Cell Signaling Technology, 4060), phospho-MTOR (Cell Signaling Technology, 2971), phopho-RPS6KB2 (Cell Signaling Technology, 9208), GFP (Cell Signaling Technology, 2956), SQSTM1 (Cell Signaling Technology, 5114) and actin (Santa Cruz Biotechnology, SC-47778) were used as primary antibodies.
RNA extraction and RT-PCR
Total cellular RNA was extracted using TRIzol reagent (Invitrogen, 15596-018) according to the manual sheets provided with the product. SuperScript III First-Strand kit (Invitrogen, 18080-051) was used to perform cDNA synthesis. The primer sequences used for amplification were as follows: ATF4 forward primer, 5′- GGCCACCATGGCGTATTA-3′; reverse primer, 5′-TGCTGAATGCCGTGAGAA-3′; GAPDH forward primer, 5′-ATCACTGCCACCCAGAAGAC-3′; and reverse primer, 5′-ATGAGGTCCACCACCCTGTT-3′; LC3 forward primer, 5′-AGACCTTCAA GCAGCGCCG -3′, reverse primer, 5′-ACACTGACAATTTCATCCCG-3′. The temperature profile was at 94°C for 5 min, followed by 25–27 cycles at 94°C for 45 sec, 55°C for 30 sec and 72°C for 30 sec. The numbers of PCR amplification cycles for ATF4, LC3 and GAPDH were 27, 30 and 25 respectively. PCR reactions in final PCR products were determined in DNA agarose 2% gels.
Small interfering RNA-mediated knockdown of ATF4 expression
Validated ATF4 small interfering RNA (siRNA) and negative control siRNA were purchased from Santa-Cruz Biotechnology (Santa-Cruz Biotechnology, SC-35112). siRNAs and LipofectAMINE 2000 (Invitrogen, 11668-027) were diluted into Opti-MEM I reduced serum medium (Invitrogen, 51985034) according to the manufacturer’s protocol. HepG2 cells were incubated for 16 h with a tranfection mixture at a final RNA concentration of 50 pmol and then supplemented with fresh medium. Cells were then subjected to western blot analysis.
Decrease of aggregated polyglutamine by treatment with DMSO
Green fluorescent protein (GFP)-fused segment of HTT exon1 containing expanded polyglutamine (n = 120) were kindly provided by Prof. Jung YK.19 HepG2 cells were transfected with pHTTex120Q-GFP (mtHTT) using Lipofectamin 2000 according to the manufacturer’s protocol. Cells were then observed under fluorescence microscope to evaluate the amount of mtHTT. Cells were lyzed with sampling buffer (10% glycerol, 2% SDS, 62.5 mM Tris–HCl, 2% b-mercaptoethanol, pH 6.8). For preparation of insoluble fractions, cells were lysed with lysis buffer (0.1% Nonidet P-40, 250 mM NaCl, 5 mM EDTA, 50 mM Hepes, pH 7.4) and subjected to centrifugation at 400 g for 3 min. The pellets were resuspended in a volume of lysis buffer equal to the volume of the supernatant as described.19
Statistical analysis
Statistical analysis was performed using PRISM (GraphPad Software Inc.). Results are expressed as mean ± SD. Statistical significance was calculated using Student’s t-test, or for comparisons involving more than two groups, one-way analysis of variance (ANOVA) with a post hoc Bonferroni multiple comparison test being used to assess the differences between the groups. Statistical significance was defined as the conventional p value of < 0.05.
Acknowledgments
This study was supported by the National Research Foundation of Korea Grant (NRF-2010-0003277) funded by the Korean Government (MEST) and the Korean Diabetes Association (2009).
Disclosure of Potential Conflicts of Interest
No potential conflicts of interest were disclosed.
Footnotes
Previously published online: www.landesbioscience.com/journals/autophagy/article/20260
References
- 1.Tilg H, Moschen AR. Evolution of inflammation in nonalcoholic fatty liver disease: the multiple parallel hits hypothesis. Hepatology. 2010;52:1836–46. doi: 10.1002/hep.24001. [DOI] [PubMed] [Google Scholar]
- 2.Barter PJ. The causes and consequences of low levels of high density lipoproteins in patients with diabetes. Diabetes Metab J. 2011;35:101–6. doi: 10.4093/dmj.2011.35.2.101. [DOI] [PMC free article] [PubMed] [Google Scholar]
- 3.Musso G, Gambino R, Cassader M, Pagano G. A meta-analysis of randomized trials for the treatment of nonalcoholic fatty liver disease. Hepatology. 2010;52:79–104. doi: 10.1002/hep.23623. [DOI] [PubMed] [Google Scholar]
- 4.Lee JY, Moon JH, Park JS, Lee BW, Kang ES, Ahn CW, et al. Dietary oleate has beneficial effects on every step of non-alcoholic Fatty liver disease progression in a methionine- and choline-deficient diet-fed animal model. Diabetes Metab J. 2011;35:489–96. doi: 10.4093/dmj.2011.35.5.489. [DOI] [PMC free article] [PubMed] [Google Scholar]
- 5.Ozcan U, Yilmaz E, Ozcan L, Furuhashi M, Vaillancourt E, Smith RO, et al. Chemical chaperones reduce ER stress and restore glucose homeostasis in a mouse model of type 2 diabetes. Science. 2006;313:1137–40. doi: 10.1126/science.1128294. [DOI] [PMC free article] [PubMed] [Google Scholar]
- 6.Kubota H. Quality control against misfolded proteins in the cytosol: a network for cell survival. J Biochem. 2009;146:609–16. doi: 10.1093/jb/mvp139. [DOI] [PubMed] [Google Scholar]
- 7.Singh R, Kaushik S, Wang Y, Xiang Y, Novak I, Komatsu M, et al. Autophagy regulates lipid metabolism. Nature. 2009;458:1131–5. doi: 10.1038/nature07976. [DOI] [PMC free article] [PubMed] [Google Scholar]
- 8.Ding WX, Li M, Chen X, Ni HM, Lin CW, Gao W, et al. Autophagy reduces acute ethanol-induced hepatotoxicity and steatosis in mice. Gastroenterology. 2010;139:1740–52. doi: 10.1053/j.gastro.2010.07.041. [DOI] [PMC free article] [PubMed] [Google Scholar]
- 9.Singh R. Autophagy and regulation of lipid metabolism. Results Probl Cell Differ. 2010;52:35–46. doi: 10.1007/978-3-642-14426-4_4. [DOI] [PMC free article] [PubMed] [Google Scholar]
- 10.Morello JP, Petäjä-Repo UE, Bichet DG, Bouvier M. Pharmacological chaperones: a new twist on receptor folding. Trends Pharmacol Sci. 2000;21:466–9. doi: 10.1016/S0165-6147(00)01575-3. [DOI] [PubMed] [Google Scholar]
- 11.Vondrácek J, Soucek K, Sheard MA, Chramostová K, Andrysík Z, Hofmanová J, et al. Dimethyl sulfoxide potentiates death receptor-mediated apoptosis in the human myeloid leukemia U937 cell line through enhancement of mitochondrial membrane depolarization. Leuk Res. 2006;30:81–9. doi: 10.1016/j.leukres.2005.05.016. [DOI] [PubMed] [Google Scholar]
- 12.Château MT, Ginestier-Verne C, Chiesa J, Caravano R, Bureau JP. Dimethyl sulfoxide-induced apoptosis in human leukemic U937 cells. Anal Cell Pathol. 1996;10:75–84. [PubMed] [Google Scholar]
- 13.Klionsky DJ, Ohsumi Y. Vacuolar import of proteins and organelles from the cytoplasm. Annu Rev Cell Dev Biol. 1999;15:1–32. doi: 10.1146/annurev.cellbio.15.1.1. [DOI] [PubMed] [Google Scholar]
- 14.Guo W, Wong S, Xie W, Lei T, Luo Z. Palmitate modulates intracellular signaling, induces endoplasmic reticulum stress, and causes apoptosis in mouse 3T3-L1 and rat primary preadipocytes. Am J Physiol Endocrinol Metab. 2007;293:E576–86. doi: 10.1152/ajpendo.00523.2006. [DOI] [PubMed] [Google Scholar]
- 15.Wei Y, Wang D, Topczewski F, Pagliassotti MJ. Saturated fatty acids induce endoplasmic reticulum stress and apoptosis independently of ceramide in liver cells. Am J Physiol Endocrinol Metab. 2006;291:E275–81. doi: 10.1152/ajpendo.00644.2005. [DOI] [PubMed] [Google Scholar]
- 16.Karaskov E, Scott C, Zhang L, Teodoro T, Ravazzola M, Volchuk A. Chronic palmitate but not oleate exposure induces endoplasmic reticulum stress, which may contribute to INS-1 pancreatic beta-cell apoptosis. Endocrinology. 2006;147:3398–407. doi: 10.1210/en.2005-1494. [DOI] [PubMed] [Google Scholar]
- 17.Kazemi S, Mounir Z, Baltzis D, Raven JF, Wang S, Krishnamoorthy JL, et al. A novel function of eIF2alpha kinases as inducers of the phosphoinositide-3 kinase signaling pathway. Mol Biol Cell. 2007;18:3635–44. doi: 10.1091/mbc.E07-01-0053. [DOI] [PMC free article] [PubMed] [Google Scholar]
- 18.Ye J, Kumanova M, Hart LS, Sloane K, Zhang H, De Panis DN, et al. The GCN2-ATF4 pathway is critical for tumour cell survival and proliferation in response to nutrient deprivation. EMBO J. 2010;29:2082–96. doi: 10.1038/emboj.2010.81. [DOI] [PMC free article] [PubMed] [Google Scholar]
- 19.Noh JY, Lee H, Song S, Kim NS, Im W, Kim M, et al. SCAMP5 links endoplasmic reticulum stress to the accumulation of expanded polyglutamine protein aggregates via endocytosis inhibition. J Biol Chem. 2009;284:11318–25. doi: 10.1074/jbc.M807620200. [DOI] [PMC free article] [PubMed] [Google Scholar]
- 20.Lee H, Noh JY, Oh Y, Kim Y, Chang JW, Chung CW, et al. IRE1 plays an essential role in ER stress-mediated aggregation of mutant huntingtin via the inhibition of autophagy flux. Hum Mol Genet. 2012;21:101–14. doi: 10.1093/hmg/ddr445. [DOI] [PubMed] [Google Scholar]
- 21.Mizushima N, Levine B, Cuervo AM, Klionsky DJ. Autophagy fights disease through cellular self-digestion. Nature. 2008;451:1069–75. doi: 10.1038/nature06639. [DOI] [PMC free article] [PubMed] [Google Scholar]
- 22.Czaja MJ. Autophagy in health and disease. 2. Regulation of lipid metabolism and storage by autophagy: pathophysiological implications. Am J Physiol Cell Physiol. 2010;298:C973–8. doi: 10.1152/ajpcell.00527.2009. [DOI] [PMC free article] [PubMed] [Google Scholar]
- 23.de Almeida SF, Picarote G, Fleming JV, Carmo-Fonseca M, Azevedo JE, de Sousa M. Chemical chaperones reduce endoplasmic reticulum stress and prevent mutant HFE aggregate formation. J Biol Chem. 2007;282:27905–12. doi: 10.1074/jbc.M702672200. [DOI] [PubMed] [Google Scholar]
- 24.Kanki K, Kawamura T, Watanabe Y. Control of ER stress by a chemical chaperone counteracts apoptotic signals in IFN-gamma-treated murine hepatocytes. Apoptosis. 2009;14:309–19. doi: 10.1007/s10495-009-0318-x. [DOI] [PubMed] [Google Scholar]
- 25.Jung CH, Ro SH, Cao J, Otto NM, Kim DH. mTOR regulation of autophagy. FEBS Lett. 2010;584:1287–95. doi: 10.1016/j.febslet.2010.01.017. [DOI] [PMC free article] [PubMed] [Google Scholar]
- 26.Baumeister W, Walz J, Zühl F, Seemüller E. The proteasome: paradigm of a self-compartmentalizing protease. Cell. 1998;92:367–80. doi: 10.1016/S0092-8674(00)80929-0. [DOI] [PubMed] [Google Scholar]
- 27.Kitamura A, Kubota H, Pack CG, Matsumoto G, Hirayama S, Takahashi Y, et al. Cytosolic chaperonin prevents polyglutamine toxicity with altering the aggregation state. Nat Cell Biol. 2006;8:1163–70. doi: 10.1038/ncb1478. [DOI] [PubMed] [Google Scholar]
- 28.Tam S, Geller R, Spiess C, Frydman J. The chaperonin TRiC controls polyglutamine aggregation and toxicity through subunit-specific interactions. Nat Cell Biol. 2006;8:1155–62. doi: 10.1038/ncb1477. [DOI] [PMC free article] [PubMed] [Google Scholar]
- 29.Qi X, Hosoi T, Okuma Y, Kaneko M, Nomura Y. Sodium 4-phenylbutyrate protects against cerebral ischemic injury. Mol Pharmacol. 2004;66:899–908. doi: 10.1124/mol.104.001339. [DOI] [PubMed] [Google Scholar]
- 30.Mayer CM, Belsham DD. Palmitate attenuates insulin signaling and induces endoplasmic reticulum stress and apoptosis in hypothalamic neurons: rescue of resistance and apoptosis through adenosine 5′ monophosphate-activated protein kinase activation. Endocrinology. 2010;151:576–85. doi: 10.1210/en.2009-1122. [DOI] [PubMed] [Google Scholar]
- 31.Yan J, Yang H, Wang G, Sun L, Zhou Y, Guo Y, et al. Autophagy augmented by troglitazone is independent of EGFR transactivation and correlated with AMP-activated protein kinase signaling. Autophagy. 2010;6:67–73. doi: 10.4161/auto.6.1.10437. [DOI] [PubMed] [Google Scholar]
- 32.Yee KS, Wilkinson S, James J, Ryan KM, Vousden KH. PUMA- and Bax-induced autophagy contributes to apoptosis. Cell Death Differ. 2009;16:1135–45. doi: 10.1038/cdd.2009.28. [DOI] [PMC free article] [PubMed] [Google Scholar]
- 33.Kwon MJ, Chung HS, Yoon CS, Ko JH, Jun HJ, Kim TK, et al. The Effects of Glyburide on Apoptosis and Endoplasmic Reticulum Stress in INS-1 Cells in a Glucolipotoxic Condition. Diabetes Metab J. 2011;35:480–8. doi: 10.4093/dmj.2011.35.5.480. [DOI] [PMC free article] [PubMed] [Google Scholar]


